
Basic Information
Description
The human CLDN18.2 coding sequence was inserted into the ROSA26 locus in MC38 cells. Human CLDN18.2 is highly expressed on the surface of B-hCLDN18.2 MC38 cells.
-
Application

-
B-hCLDN18.2 MC38 cells have the capability to establish tumors in vivo and can be used for efficacy studies.
-
Target strategy
-
The exogenous promoter and human CLDN18.2 coding sequence was inserted into the ROSA26 locus in murine.
-
Protein expression analysis
-
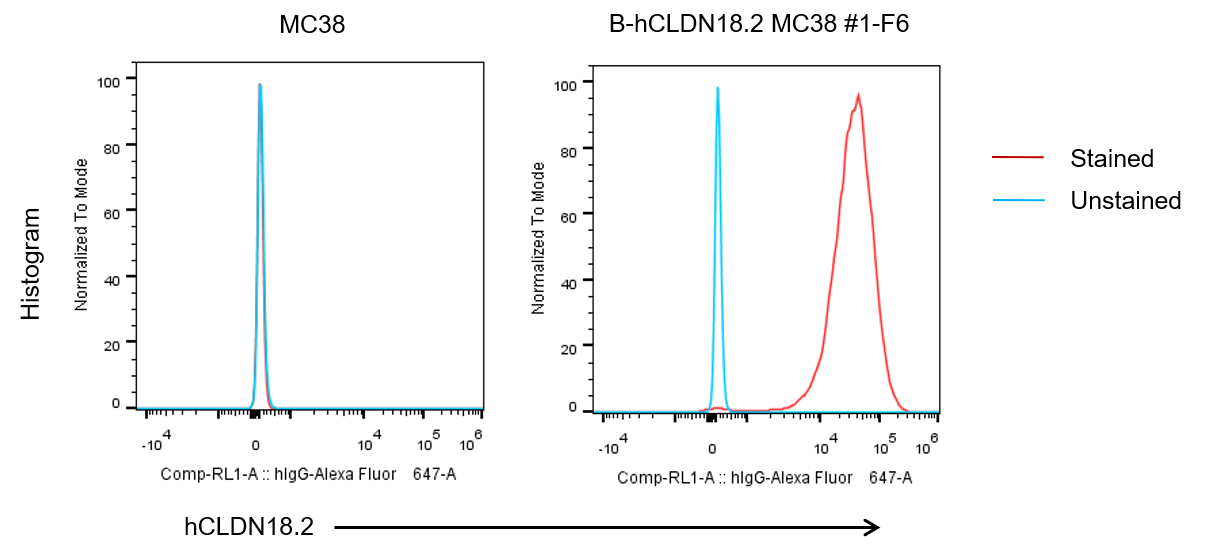
CLDN18.2 expression analysis in B-hCLDN18.2 MC38 cells by flow cytometry. Single cell suspensions from wild-type MC38 and B-hCLDN18.2 MC38 cultures were stained with species-specific anti-CLDN18.2 antibody. Human CLDN18.2 was detected on the surface of B-hCLDN18.2 MC38 cells but not wild-type MC38 cells. The 1-F6 clone of B-hCLDN18.2 MC38 cells was used for in vivo experiments.
-
Tumor growth curve & Body weight changes
-
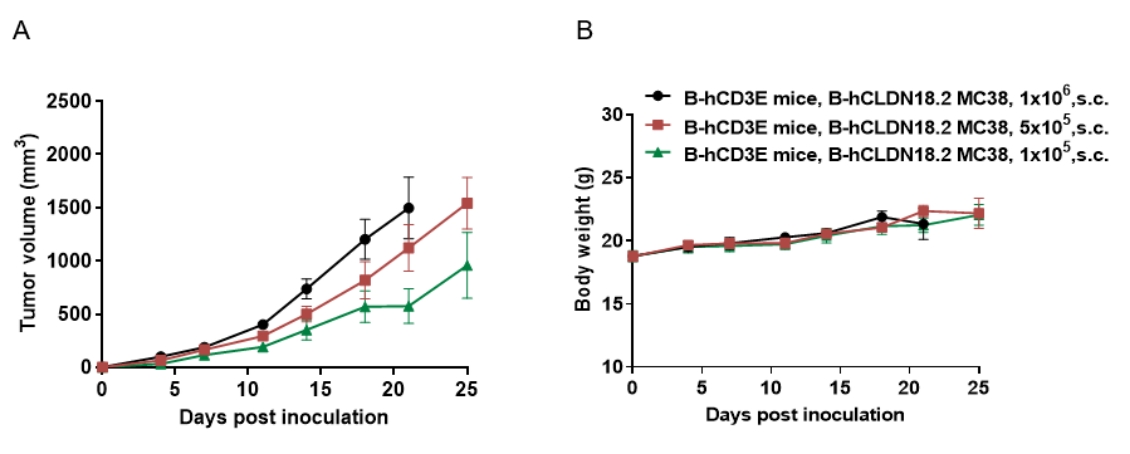
Subcutaneous homograft tumor growth of B-hCLDN18.2 MC38 cells. B-hCLDN18.2 MC38 cells (5×10⁵) and wild-type MC38 cells (5×10⁵) were subcutaneously implanted into C57BL/6 mice (female, n=5). Tumor volume and body weight were measured twice a week. (A) Average tumor volume ± SEM. (B) Body weight (Mean± SEM). Volume was expressed in mm3 using the formula: V=0.5 X long diameter X short diameter2. As shown in panel A, B-hCLDN18.2 MC38 cells were able to establish tumors in vivo and can be used for efficacy studies.
-
In vivo efficacy of anti human CLDN18.2 antibodies
-
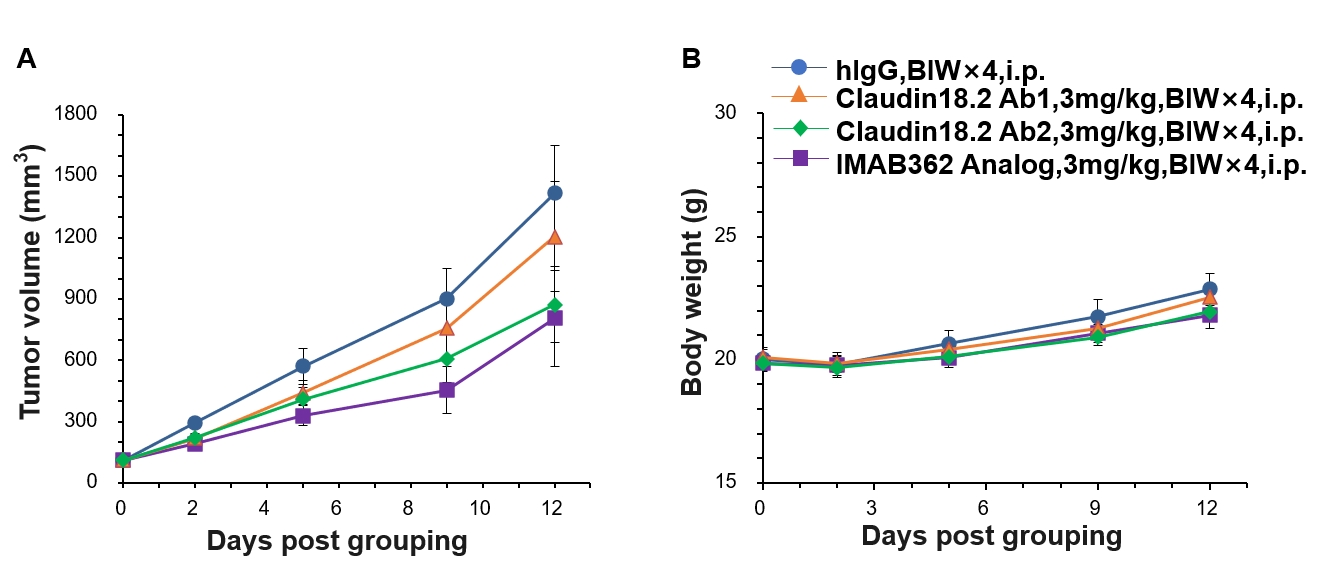
Antitumor activity of anti-human CLDN18.2 antibodies in C57BL/6 mice. (A) Anti human CLDN18.2 antibodies inhibited B-hCLDN18.2 MC38 tumor growth in C57BL/6 mice. B-hCLDN18.2 MC38 were subcutaneously implanted into C57BL/6 mice (n=7). Mice were grouped when tumor volume reached approximately 100 mm3, at which time they were treated with anti-human CLDN18.2 antibody with doses and schedules indicated in panel A. (B) Body weight changes during treatment. As shown in panel A, anti-human CLDN18.2 antibody was efficacious in controlling tumor growth in C57BL/6 mice, demonstrating that the B-hCLDN18.2 MC38 provide a powerful preclinical model for in vivo evaluation of anti-human CLDN18.2 antibodies. Values are expressed as mean ± SEM.
-
In vivo efficacy of anti human CLDN18.2-ADC drugs
-
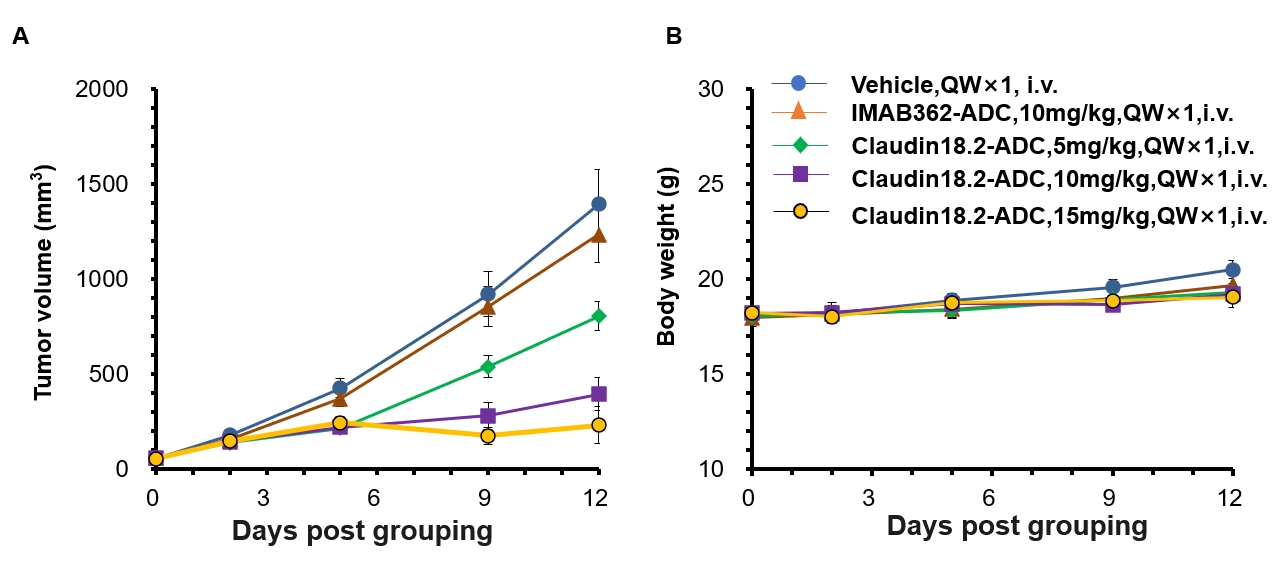
Antitumor activity of anti human CLDN18.2-ADC drugs in C57BL/6 mice. (A) Anti human CLDN18.2-ADC drugs inhibited B-hCLDN18.2 MC38 tumor growth in C57BL/6 mice. B-hCLDN18.2 MC38 were subcutaneously implanted into C57BL/6 mice(n=6). Mice were grouped when tumor volume reached approximately 100 mm3, at which time they were treated with anti human CLDN18.2-ADC drugs with doses and schedules indicated in panel A. (B) Body weight changes during treatment. As shown in panel A, anti human CLDN18.2-ADC drugs was efficacious in controlling tumor growth in C57BL/6 mice, demonstrating that the B-hCLDN18.2 MC38 provide a powerful preclinical model for in vivo evaluation of anti human CLDN18.2-ADC drugs. Values are expressed as mean ± SEM.
