
Basic Information
-
Targeting strategy

-
Gene targeting strategy for B-hPD-1/hPD-L1,Igh-J KO mice.
The exon 2 of mouse Pd-1 gene that encodes the IgV domain was replaced by human PD-1 exon 2 in B-hPD-1/hPD-L1,Igh-J KO mice.
The exon 3 of mouse Pd-l1 gene that encodes the IgV domain was replaced by human PD-L1 exon 3 in B-hPD-1/hPD-L1,Igh-J KO mice.
The exons of mouse Ighd4-1 and Ighj1-4 gene were knockout in B-hPD-1/hPD-L1,Igh-J KO mice.
-
Protein expression analysis
-
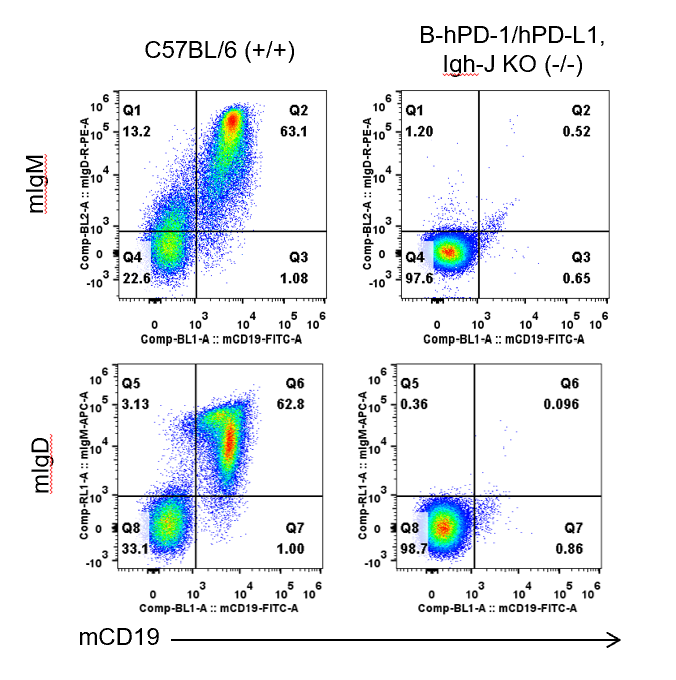
Strain IgM & IgD expression analysis in homozygous B-hPD-1/hPD-L1, Igh-J KO mice by flow cytometry.
Splenocytes were collected from wild-type C57BL/6 mice and B-hPD-1/hPD-L1, Igh-J KO mice . Mouse IgM & IgD were detectable on B cells in wild-type mice but not in B-hPD-1/hPD-L1, Igh-J KO mice .
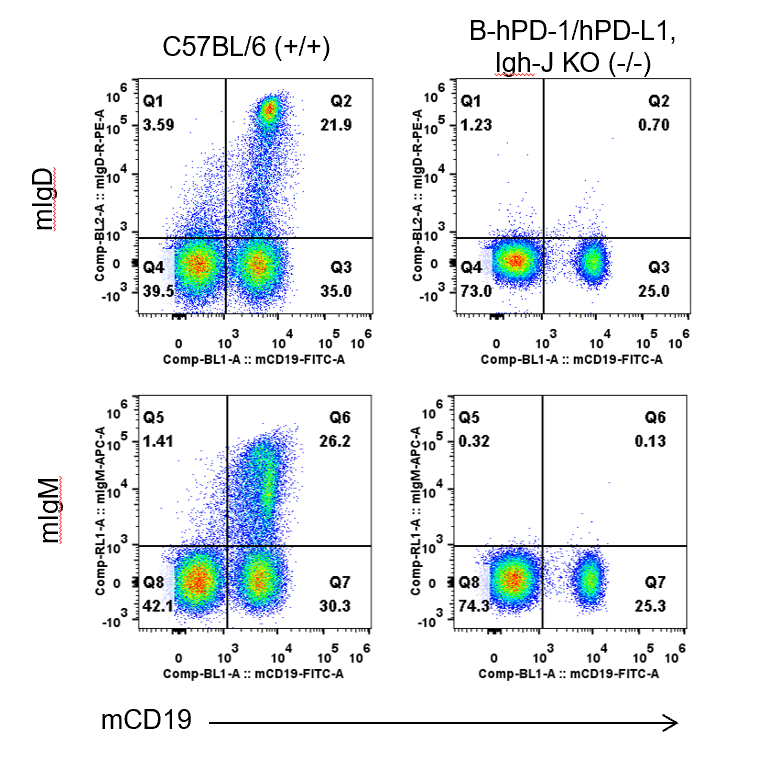
Strain IgM & IgD expression analysis in homozygous B-hPD-1/hPD-L1, Igh-J KO mice by flow cytometry.
BMs were collected from wild-type C57BL/6 mice and B-hPD-1/hPD-L1, Igh-J KO mice. Mouse IgM & IgD were detectable on B cells in wild-type mice but not in B-hPD-1/hPD-L1, Igh-J KO mice.
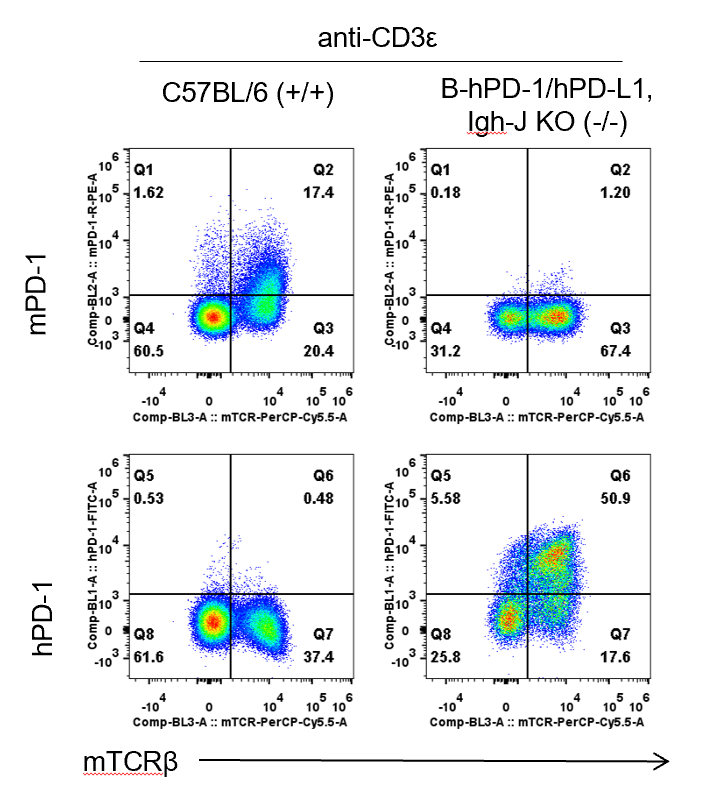
Strain m/hPD-1 expression analysis in homozygous B-hPD-1/hPD-L1, Igh-J KO mice by flow cytometry.
Splenocytes were collected from wild-type C57BL/6 mice and homozygous B-hPD-1/hPD-L1, Igh-J KO mice stimulated with anti-CD3ε in vivo (7.5μg/mice, stimulation for 24hours, i.p.). Mouse PD-1 was exclusively detectable in wild-type mice. Human PD-1 was exclusively detectable in homozygous B-hPD-1/hPD-L1, Igh-J KO mice.
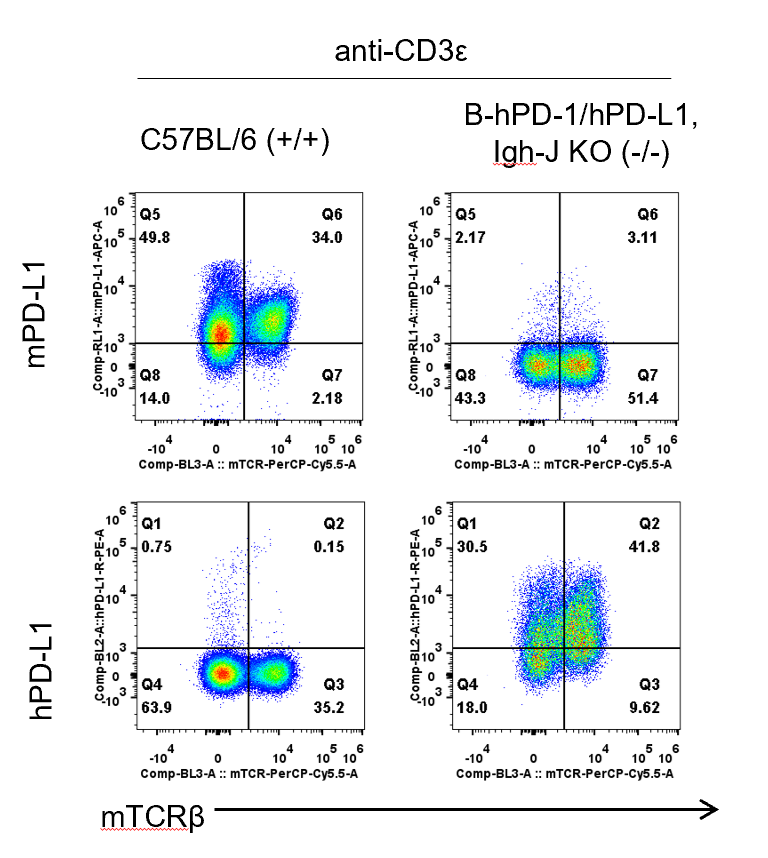
Strain m/hPD-L1 expression analysis in homozygous B-hPD-1/hPD-L1, Igh-J KO mice by flow cytometry.
Splenocytes were collected from wild-type C57BL/6 mice and homozygous B-hPD-1/hPD-L1, Igh-J KO mice stimulated with anti-CD3ε in vivo (7.5μg/mice, stimulation for 24hours, i.p. ). Mouse PD-L1 was exclusively detectable in wild-type mice. Human PD-L1 was exclusively detectable in homozygous B-hPD-1/hPD-L1, Igh-J KO mice.
-
Analysis of leukocytes cell subpopulation in spleen
-
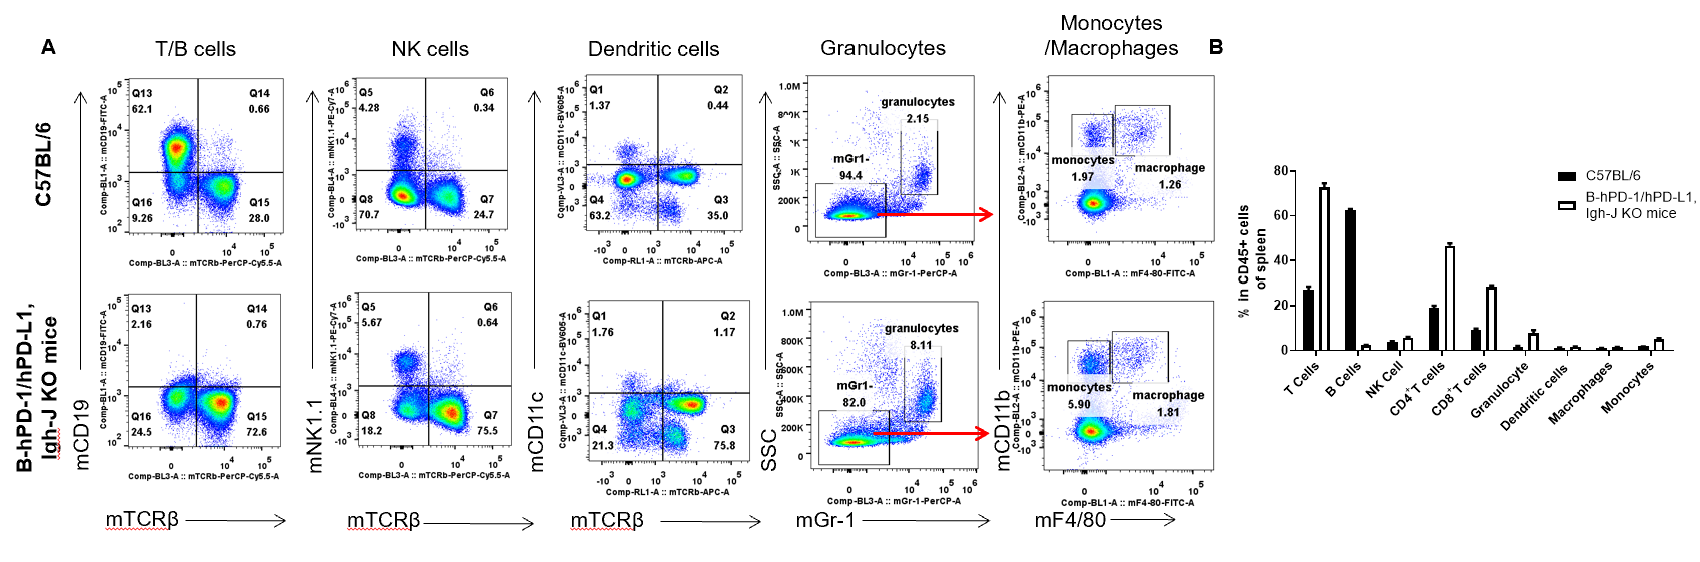
Analysis of spleen leukocyte subpopulations by FACS. Splenocytes were isolated from female C57BL/6 and homozygous B-hPD-1/hPD-L1, Igh-J KO mice (n=3, 6-week-old). Flow cytometry analysis of the splenocytes was performed to assess leukocyte subpopulations. A. Representative FACS plots. Single live cells were gated for the CD45+ population and used for further analysis as indicated here. B. Results of FACS analysis. Compared with C57BL/6 mice, homozygous B-hPD-1/hPD-L1, Igh-J KO mice lost B cells and increased the percent of other cell types, such as T cell, NK cell, monocyte, dendritic cell, granulocyte, and macrophage. Values are expressed as mean ± SEM.
-
Analysis of T cell subpopulation in spleen
-
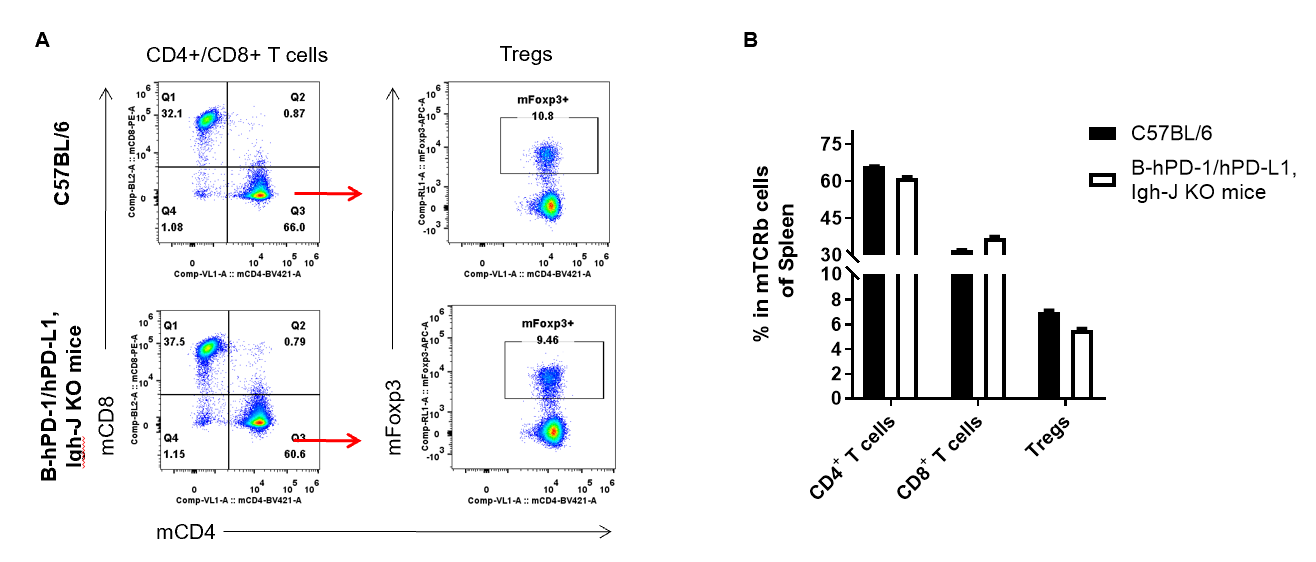
Analysis of spleen T cell subpopulations by FACS. Splenocytes were isolated from female C57BL/6 and homozygous B-hPD-1/hPD-L1, Igh-J KO mice (n=3, 6-week-old). Flow cytometry analysis of the splenocytes was performed to assess leukocyte subpopulations. A. Representative FACS plots. Single live CD45+ cells were gated for TCRβ+T cell population and used for further analysis as indicated here. B. Results of FACS analysis. There were no differences between C57BL/6 and homozygous B-hPD-1/hPD-L1, Igh-J KO mice, demonstrating that PD-1/PD-L1 humanization and Igh J KO do not change the overall development, differentiation or distribution of these T cell subtypes. Values are expressed as mean ± SEM.
-
Analysis of leukocytes cell subpopulation in LNs
-
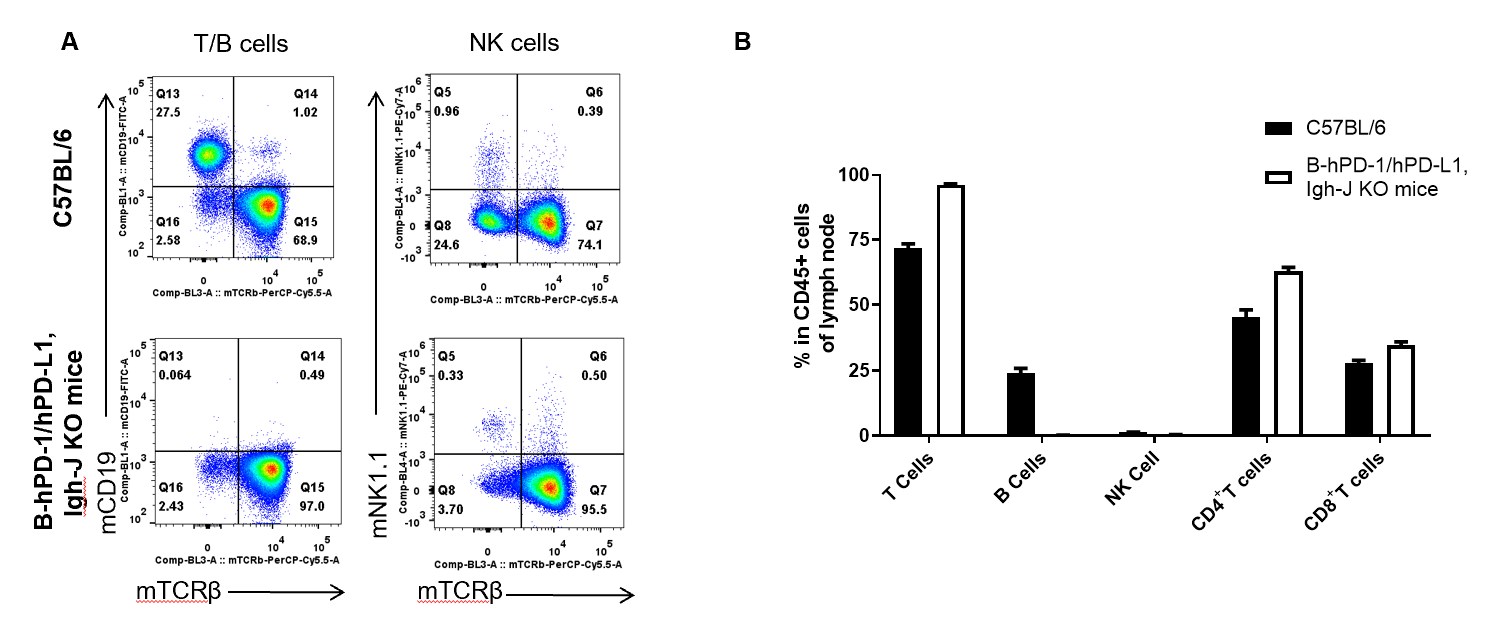
Analysis of LNs leukocyte subpopulations by FACS. LNs were isolated from female C57BL/6 and homozygous B-hPD-1/hPD-L1, Igh-J KO mice(n=3, 6-week-old). Flow cytometry analysis of the LNs was performed to assess leukocyte subpopulations. A. Representative FACS plots. Single live cells were gated for the CD45+ population and used for further analysis as indicated here. B. Results of FACS analysis. Compared with C57BL/6 mice, homozygous B-hPD-1/hPD-L1, Igh-J KO mice lost B cells and increased the percent of other cell types, such as T cell, NK cell, monocyte, dendritic cell, granulocyte, and macrophage. Values are expressed as mean ± SEM.
-
Analysis of T cell subpopulation in LNs
-
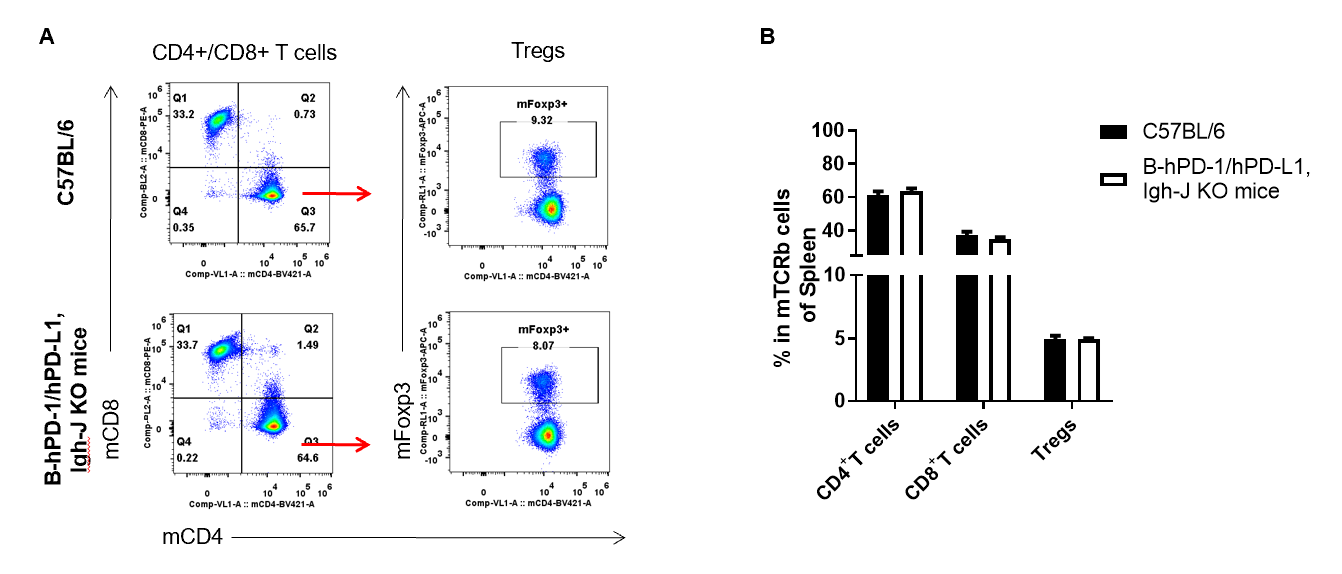
Analysis of LNs T cell subpopulations by FACS. LNs were isolated from female C57BL/6 and homozygous B-hPD-1/hPD-L1, Igh-J KO mice (n=3, 6-week-old). Flow cytometry analysis of the LNs was performed to assess leukocyte subpopulations. A. Representative FACS plots. Single live CD45+ cells were gated for TCRβ+T cell population and used for further analysis as indicated here. B. Results of FACS analysis. There were no differences between C57BL/6 and homozygous B-hPD-1/hPD-L1, Igh-J KO mice, demonstrating that PD-1/PD-L1 humanization and Igh J KO do not change the overall development, differentiation, or distribution of these T cell subtypes. Values are expressed as mean ± SEM.
-
Analysis of leukocytes cell subpopulation in blood
-
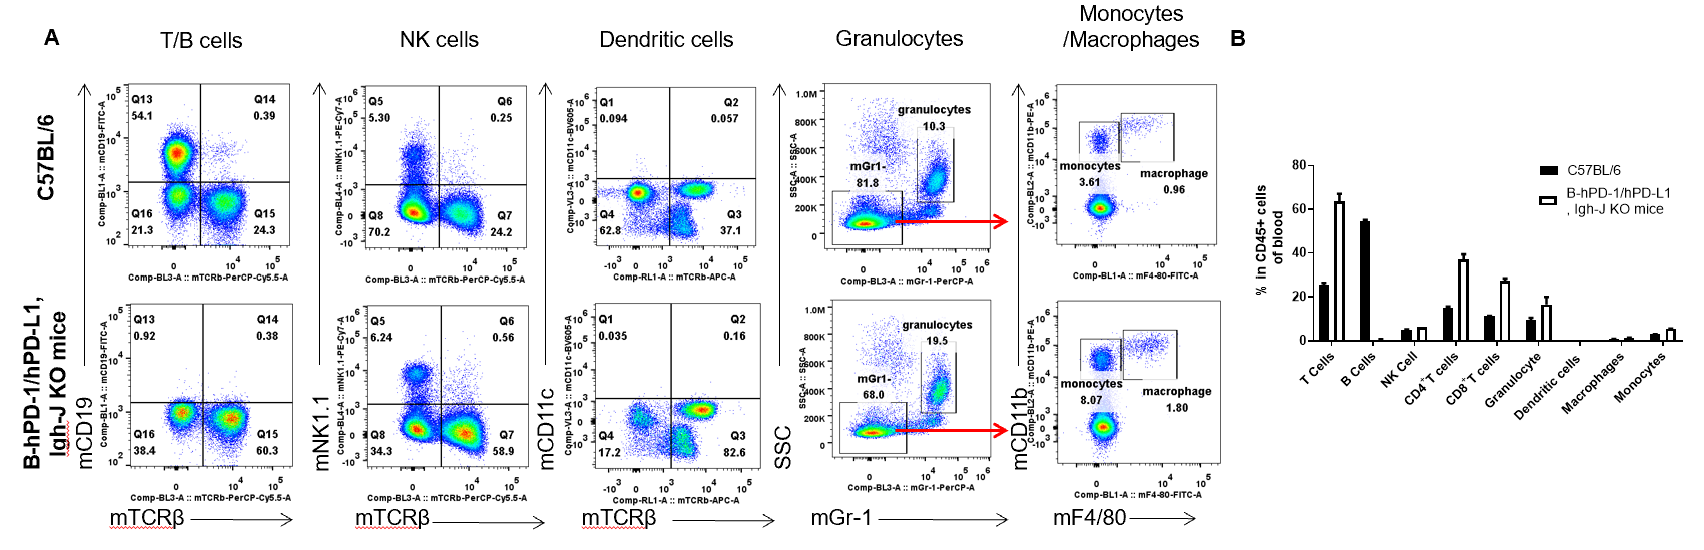
Analysis of blood leukocyte subpopulations by FACS. Blood was isolated from female C57BL/6 and homozygous B-hPD-1/hPD-L1, Igh-J KO mice (n=3, 6-week-old). Flow cytometry analysis of the blood was performed to assess leukocyte subpopulations. A. Representative FACS plots. Single live cells were gated for the CD45+ population and used for further analysis as indicated here. B. Results of FACS analysis. Compared with C57BL/6 mice, homozygous B-hPD-1/hPD-L1, Igh-J KO mice lost B cells and increased the percent of other cell types, such as T cell, NK cell, monocyte, dendritic cell, granulocyte, and macrophage. Values are expressed as mean ± SEM.
-
Analysis of T cell subpopulation in blood
-
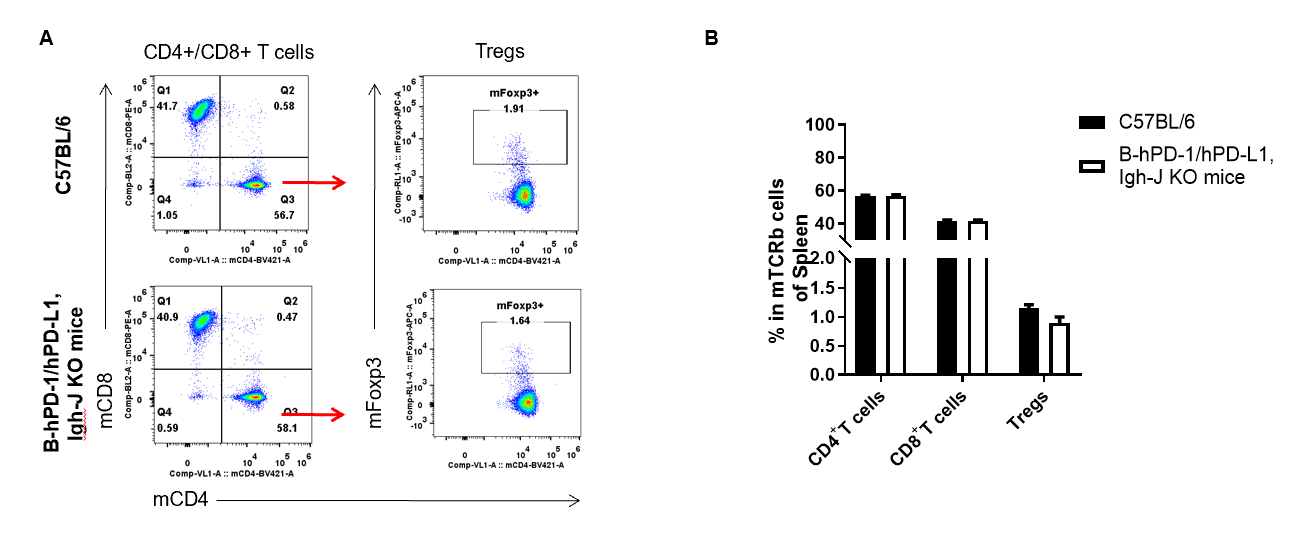
Analysis of blood T cell subpopulations by FACS. Blood was isolated from female C57BL/6 and homozygous B-hPD-1/hPD-L1, Igh-J KO mice(n=3, 6-week-old). Flow cytometry analysis of the blood was performed to assess leukocyte subpopulations. A. Representative FACS plots. Single live CD45+ cells were gated for TCRβ+T cell population and used for further analysis as indicated here. B. Results of FACS analysis. There were no differences between C57BL/6 and homozygous B-hPD-1/hPD-L1, Igh-J KO mice, demonstrating that PD-1/PD-L1 humanization and Igh J KO do not change the overall development, differentiation, or distribution of these T cell subtypes. Values are expressed as mean ± SEM.
-
In vivo efficacy of M7824 in B cell deficient mice model
-
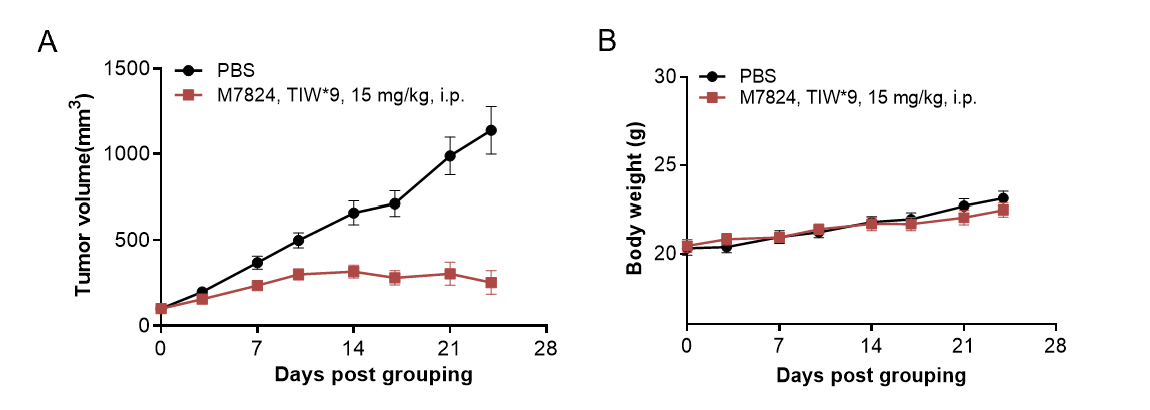
Antitumor activity of M7824 in B-hPD-1/hPD-L1, Igh J KO mice. (A) M7824 inhibited B-hPD-L1 MC38 tumor growth in B-hPD-1/hPD-L1, Igh J KO mice. Murine colon cancer B-hPD-L1 MC38 cells were subcutaneously implanted into homozygous B-hPD-1/hPD-L1, Igh J KO mice (female, 6-7 week-old, n=8). Mice were grouped when tumor volume reached approximately 100 mm3, and treated with M7824 at doses and schedules in panel A. (B) Body weight changes during treatment. As shown in panel A, M7824 (in house) were efficacious in controlling tumor growth in B-hPD-1/hPD-L1, Igh J KO mice , demonstrating they provide a powerful preclinical model for in vivo evaluation of drugs with high immunogenicity, such as M7824. Values are expressed as mean ± SEM.
-
In vivo efficacy of M7824 in B cell competent mice model
-
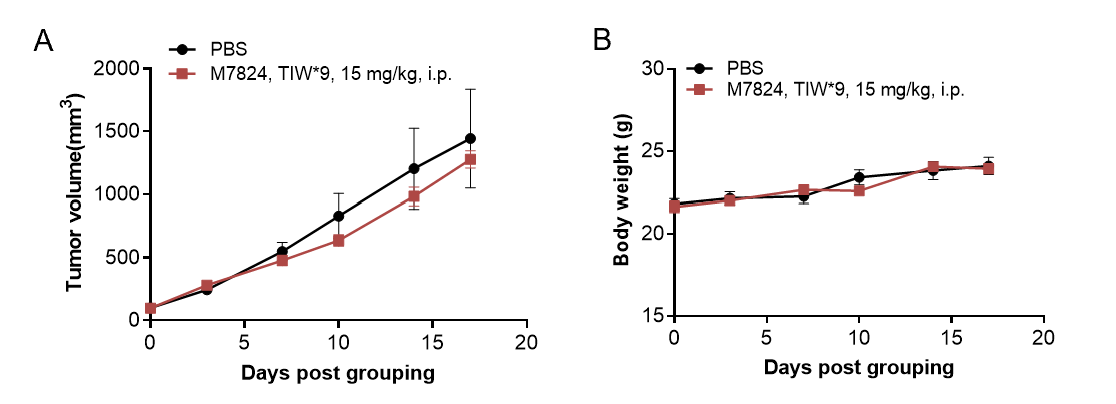
Antitumor activity of M7824 in B-hPD-1/hPD-L1 mice. (A) M7824 did not affect B-hPD-L1 MC38 tumor growth in B-hPD-1/hPD-L1 mice. Murine colon cancer B-hPD-L1 MC38 cells were subcutaneously implanted into homozygous B-hPD-1/hPD-L1 mice (female, 6-7 week-old, n=8). Mice were grouped when tumor volume reached approximately 100 mm3, and treated with M7824 at doses and schedules in panel A. (B) Body weight changes during treatment. As shown in panel A, M7824 (in house) were not efficacious in controlling tumor growth in B-hPD-1/hPD-L1 mice, demonstrating B cell competent mice model is not a good model for in vivo efficacy for drugs with high immunogenicity, such as M7824. Values are expressed as mean ± SEM.
-
Serum M7824 analogue and anti-M7824 analogue antibody levels
-
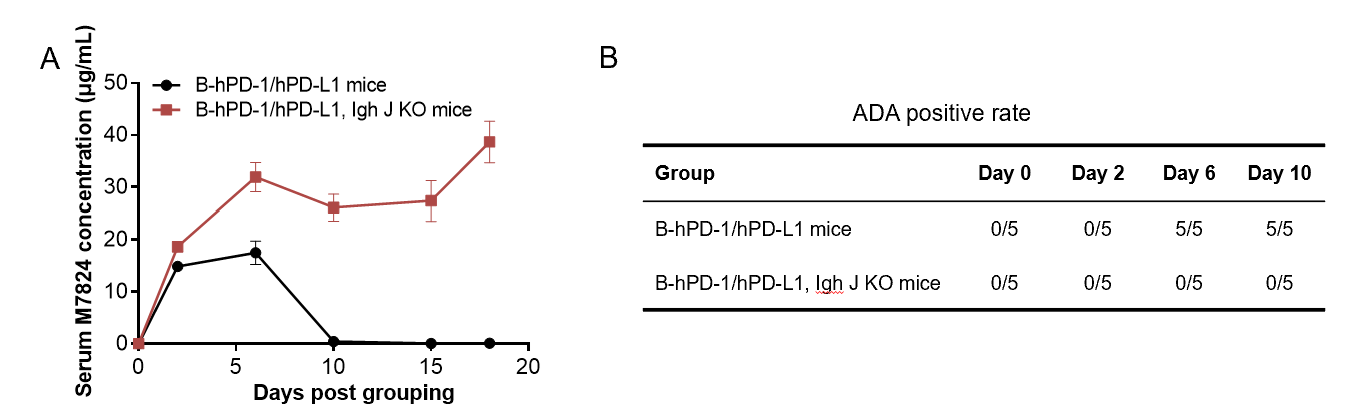
Serum M7824 analogue and anti-M7824 analogue antibody levels.
Serum M7824 analogue concentration (A) and ADA level (B) were detected by ELISA. M7824 analogue concentration was significantly higher in B cell deficient mice(B-hPD-1/hPD-L1, Igh J KO mice). ADA positive rate was significantly lower in B cell deficient mice(B-hPD-1/hPD-L1, Igh J KO mice). Parametric method of mean + 1.645 x SD was used to determine immunogenicity cut point (Shankar, G et al 2008). ADA was present in all B-hPD-1/hPD-L1 mice after day 6.
