
Basic Information
Description
In Biocytogen’s B-PD-1-EGFP knock-in (KI) mice, the PD-1 gene was targeted and replaced with the EGFP gene.
B-PD-1-EGFP mice do not express PD-1 protein, but express EGFP under the regulatory sequences of the mouse PD-1 gene.
-
Targeting Strategy

-
Targeting Strategy
Gene targeting strategy for B-PD-1-EGFP KI mice. The EGFP gene encoding green fluorescent protein was inserted after the 5 ‘UTR sequences of mouse PD-1 gene to replace it in B-PD-1-EGFP mice.
-
Details
-
Protein expression analysis

Strain specific PD-1 and EGFP expression analysis in heterozygous and homozygous B-PD-1-EGFP KI mice by flow cytometry. Splenocytes were collected from WT (+/+), heterozygous (H/+) and homozygous (H/H) B-PD-1-EGFP KI mice and analyzed by flow cytometry with species-specific anti-PD1 and anti-EGFP antibodies. Mouse PD-1 was detectable in WT and heterozygous B-PD-1-EGFP KI mice. EGFP was detectable in heterozygous and homozygous B-PD-1-EGFP KI mice but not in WT mice.
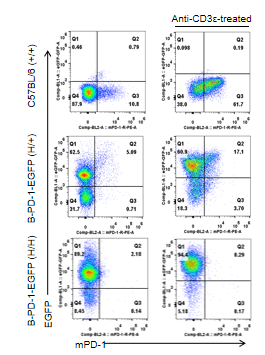
Strain specific PD-1 and EGFP expression analysis in heterozygous and homozygous B-PD-1-EGFP KI mice by flow cytometry. Splenocytes were collected from WT (+/+), heterozygous (H/+) and homozygous (H/H) B-PD-1-EGFP KI mice and analyzed by flow cytometry with species-specific anti-PD1 and anti-EGFP antibodies. Mouse PD-1 was detectable in WT and heterozygous B-PD-1-EGFP KI mice. EGFP was detectable in heterozygous and homozygous B-PD-1-EGFP KI mice but not in WT mice.
Spleen weight

Macroscopic observations of spleens. A. Spleen from indicated mice at 7 weeks of the age were photographed. B. Spleen weight. These data indicated that there was no change in the heterozygous and homozygous B-PD-1-EGFP KI mice at 7 weeks of the age compared to the wild type C57BL/6 mice.
Analysis of spleen leukocytes cell subpopulations in B-PD-1-EGFP KI mice
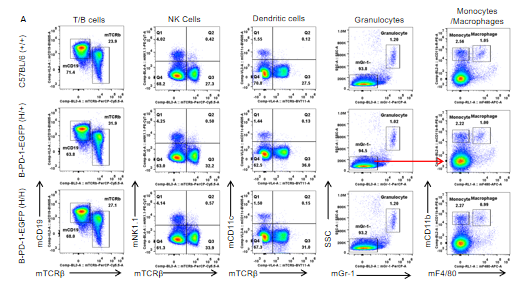
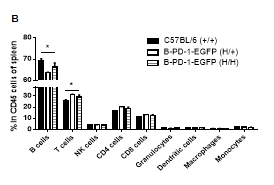
Analysis of spleen leukocyte subpopulations by FACS Splenocytes were isolated from female C57BL/6 and B-PD-1-EGFP KI mice (n=3, 7-week-old). Flow cytometry analysis of the splenocytes was performed to assess leukocyte subpopulations. A. Representative FACS plots. Single live cells were gated for CD45 population and used for further analysis as indicated here. B. Results of FACS analysis. Percent of T cells, B cells in B-PD-1-EGFP KI mice were higher than those in the C57BL/6 mice. While NK cells, DCs, granulocytes, monocytes and macrophages in B-PD-1-EGFP KI mice were similar to those in the C57BL/6 mice, demonstrating that Knock out of Mpd-1 may change the development, differentiation or distribution of some cell types in spleen. Values are expressed as mean ± SEM.
Analysis of spleen T cell subpopulations in B-PD-1-EGFP KI mice
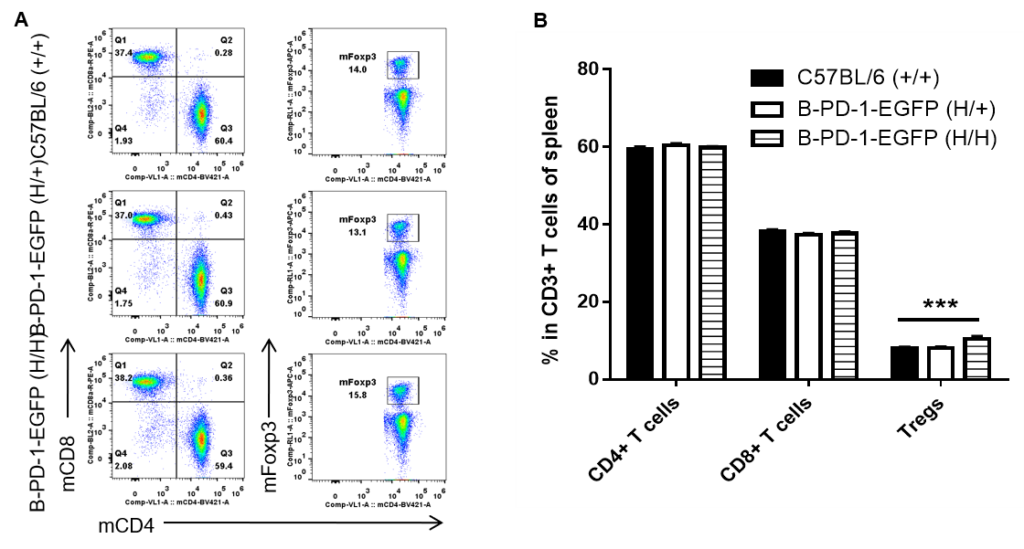
Analysis of spleen T cell subpopulations by FACS Splenocytes were isolated from female C57BL/6 and B-PD-1-EGFP KI mice (n=3, 7-week-old). Flow cytometry analysis of the splenocytes was performed to assess leukocyte subpopulations. A. Representative FACS plots. Single live CD45+ T cells were gated for CD3+ T cell population and used for further analysis as indicated here. B. Results of FACS analysis. Percent of CD8+ T cells, CD4+ T cells in B-PD-1-EGFP KI mice were similar to those in the C57BL/6 mice, while percent of Tregs in homozygous B-PD-1-EGFP KI mice were higher than those in the C57BL/6 mice, demonstrating that knock out of PD-1 may changed the development, differentiation or distribution of these Tregs in spleen. Values are expressed as mean ± SEM.
