
Basic Information
-
mRNA expression analysis

-
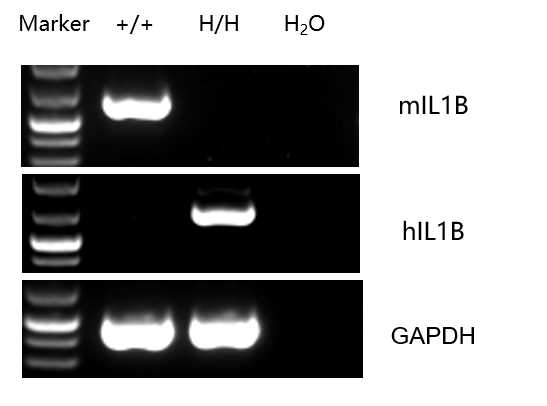
Strain specific analysis of IL1B gene expression in B-hIL1B mice by RT-PCR. Mouse Il1b was detectable in splenocytes of wild-type mice (+/+). Human IL1B was detectable only in homozygous B-hIL1B mice (H/H) but not in wild-type mice.
-
Protein expression analysis
-
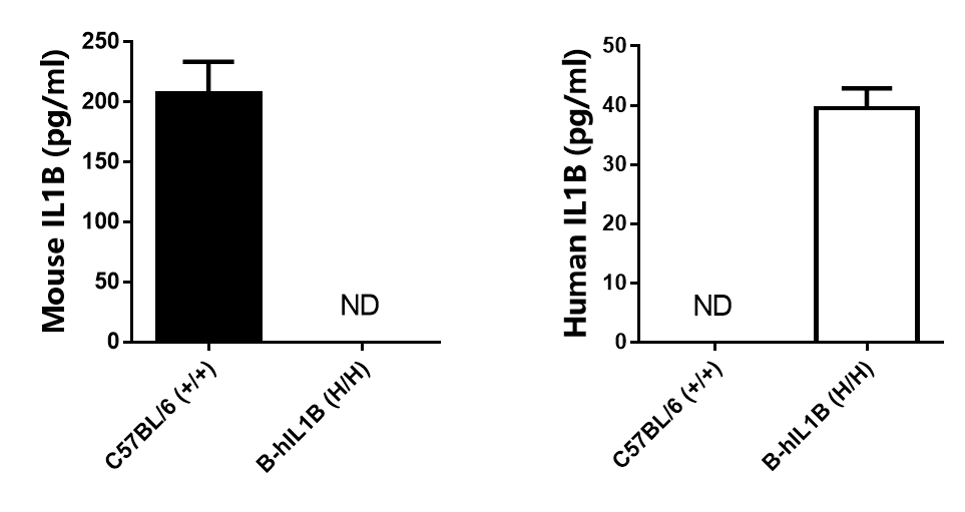
Strain specific IL1B expression analysis in homozygous B-hIL1B mice by ELISA.
Bone marrow cell supernatant were collected from C57BL/6 (+/+) and homozygous B-hIL1B mice (H/H) stimulated with LPS in vivo, and analyzed by ELISA with species-specific IL1B ELISA kit. Mouse IL1B was detectable in C57BL/6 mice. Human IL1B was exclusively detectable in homozygous B-hIL1B mice but not C57BL/6 mice. ND, not detectable.
-
Immune Cell Profile
-
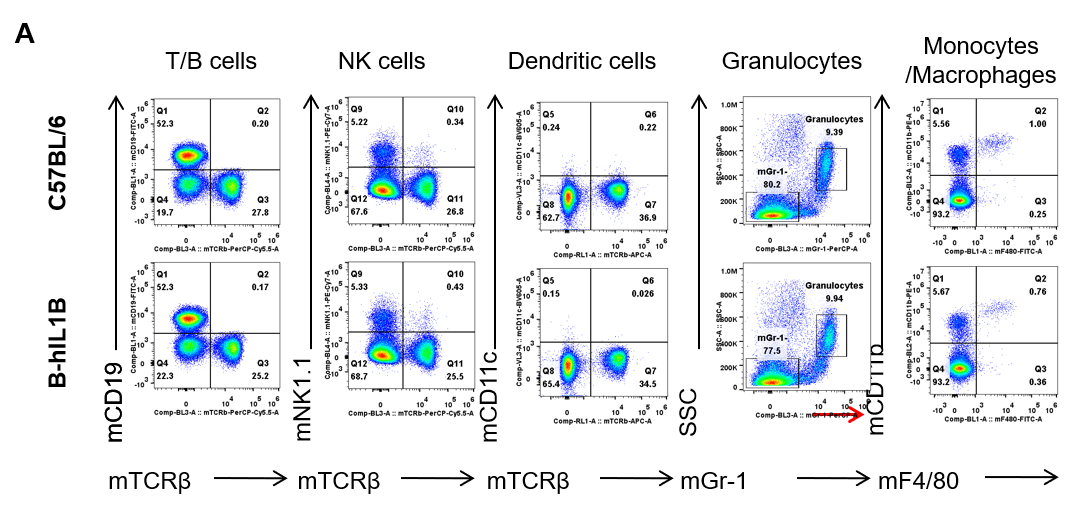
Analysis of spleen leukocytes cell subpopulations in B-hIL1B mice
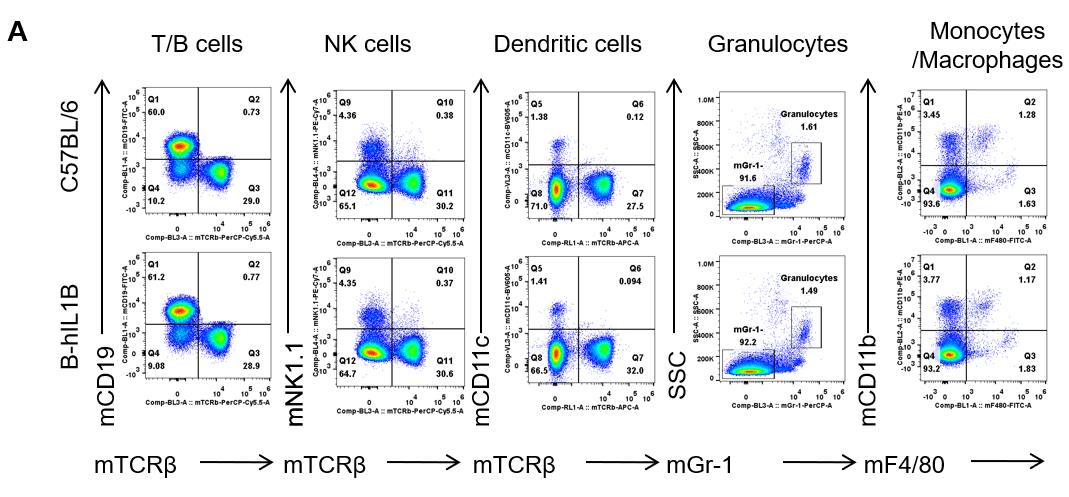
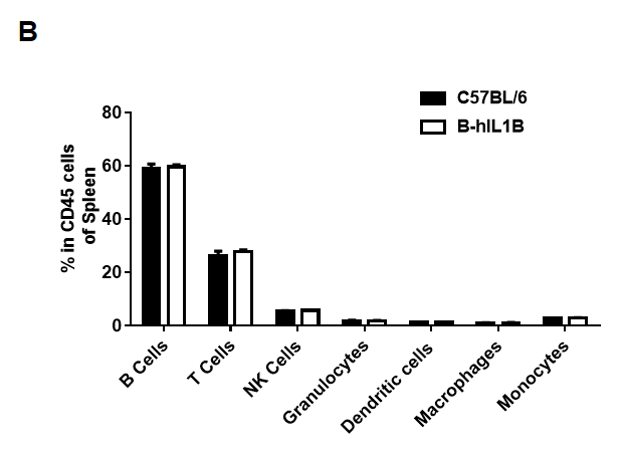
Analysis of spleen leukocyte subpopulations by FACS.
Splenocytes were isolated from female C57BL/6 and B-hIL1B mice (n=5, 6-week-old). Flow cytometry analysis of the splenocytes was performed to assess leukocyte subpopulations. A. Representative FACS plots. Single live cells were gated for the CD45+ population and used for further analysis as indicated here. B. Results of FACS analysis. Percent of T cells, B cells, NK cells, dendritic cells, granulocytes, monocytes and macrophages in homozygous B-hIL1B mice were similar to those in the C57BL/6 mice, demonstrating that introduction of hIL1B in place of its mouse counterpart dose not change the overall development, differentiation or distribution of these cell types in spleen. Values are expressed as mean ± SEM.
Analysis of spleen T cell subpopulations in B-hIL1B mice
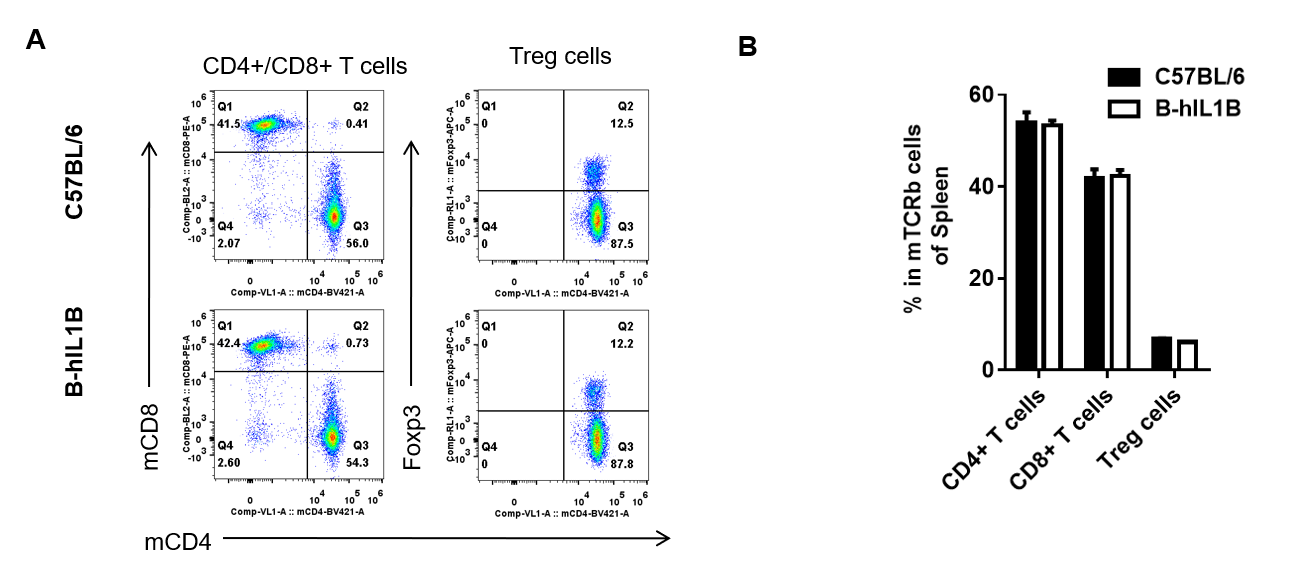
Analysis of spleen T cell subpopulations by FACS.
Splenocytes were isolated from female C57BL/6 and B-hIL1B mice (n=5, 6-week-old). Flow cytometry analysis of the splenocytes was performed to assess leukocyte subpopulations. A. Representative FACS plots. Single live CD45+ cells were gated for TCRβ+ T cell population and used for further analysis as indicated here. B. Results of FACS analysis. Percent of CD8+ T cells, CD4+ T cells, and Treg cells in homozygous B-hIL1B mice were similar to those in the C57BL/6 mice, demonstrating that introduction of hIL1B in place of its mouse counterpart does not change the overall development, differentiation or distribution of these T cell subtypes in spleen. Values are expressed as mean ± SEM.
Analysis of lymph node leukocytes cell subpopulations in B-hIL1B mice
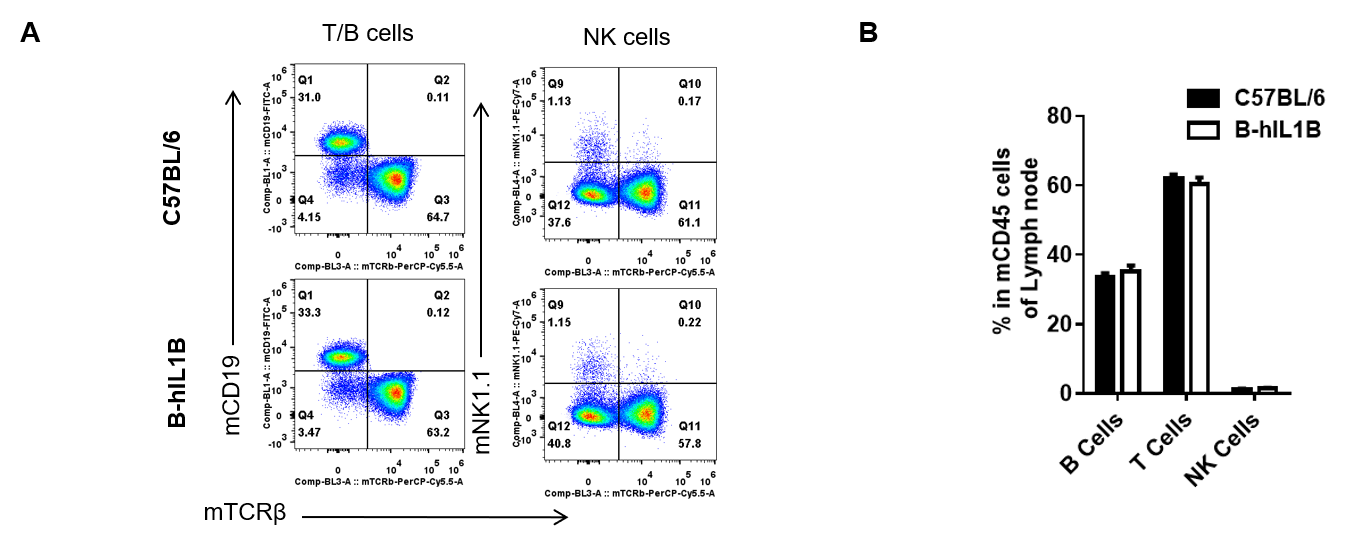
Analysis of lymph node leukocyte subpopulations by FACS
Lymphocytes were isolated from female C57BL/6 and B-hIL1B mice (n=5, 6-week-old). Flow cytometry analysis of the Lymphocyte was performed to assess leukocyte subpopulations. A. Representative FACS plots. Single live cells were gated for the CD45+ population and used for further analysis as indicated here. B. Results of FACS analysis. Percent of T cells, B cells, NK cells, dendritic cells, granulocytes, monocytes and macrophages in homozygous B-hIL1B mice were similar to those in the C57BL/6 mice, demonstrating that introduction of hIL1B in place of its mouse counterpart dose not change the overall development, differentiation or distribution of these cell types in lymph node. Values are expressed as mean ± SEM.
Analysis of lymph node T cell subpopulations in B-hIL1B mice
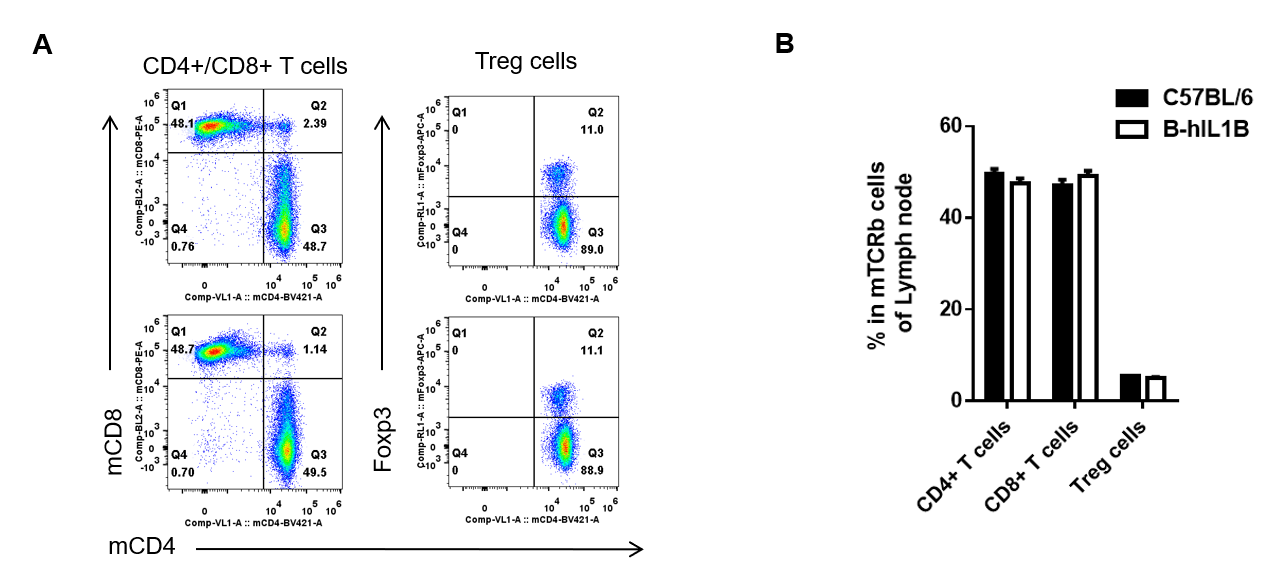
Analysis of lymph node T cell subpopulations by FACS
Lymphocytes were isolated from female C57BL/6 and B-hIL1B mice (n=5, 6-week-old). Flow cytometry analysis of the Lymphocytes was performed to assess leukocyte subpopulations. A. Representative FACS plots. Single live CD45+ cells were gated for TCRβ+ T cell population and used for further analysis as indicated here. B. Results of FACS analysis. Percent of CD8+ T cells, CD4+ T cells, and Treg cells in homozygous B-hIL1B mice were similar to those in the C57BL/6 mice, demonstrating that introduction of hIL1B in place of its mouse counterpart does not change the overall development, differentiation or distribution of these T cell subtypes in lymph node. Values are expressed as mean ± SEM.
Analysis of blood leukocytes cell subpopulations in B-hIL1B mice
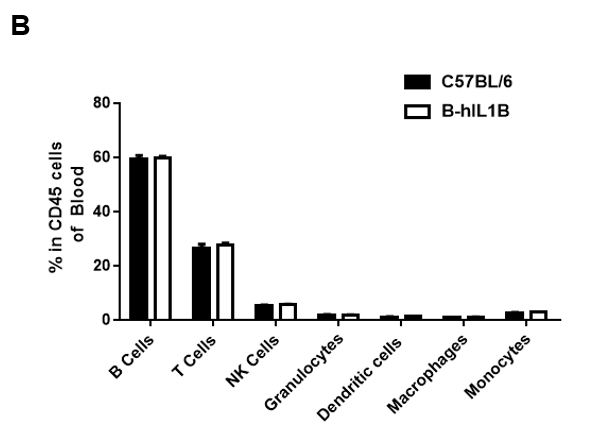
Analysis of blood leukocyte subpopulations by FACS.
Blood cells were isolated from female C57BL/6 and B-hIL1B mice (n=5, 6-week-old). Flow cytometry analysis of the blood cells was performed to assess leukocyte subpopulations. A. Representative FACS plots. Single live cells were gated for the CD45+ population and used for further analysis as indicated here. B. Results of FACS analysis. Percent of T cells, B cells, NK cells, dendritic cells, granulocytes, monocytes and macrophages in homozygous B-hIL1B mice were similar to those in the C57BL/6 mice, demonstrating that introduction of hIL1B in place of its mouse counterpart dose not change the overall development, differentiation or distribution of these cell types in blood. Values are expressed as mean ± SEM.
Analysis of blood T cell subpopulations in B-hIL1B mice
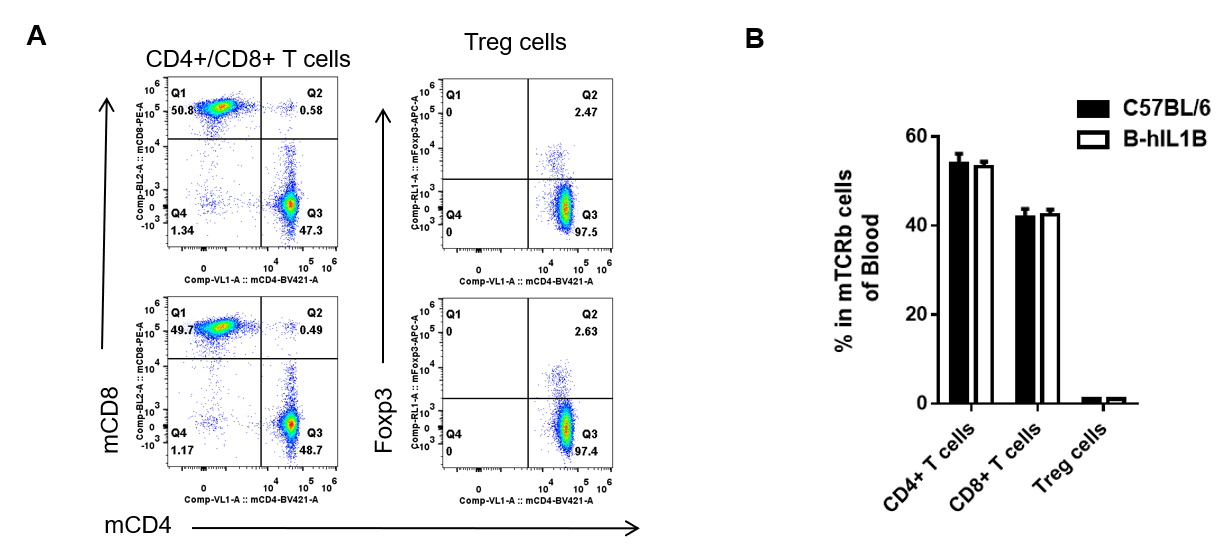
Analysis of blood T cell subpopulations by FACS
Blood cells were isolated from female C57BL/6 and B-hIL1B mice (n=5, 6-week-old). Flow cytometry analysis of the blood cells was performed to assess leukocyte subpopulations. A. Representative FACS plots. Single live CD45+ cells were gated for TCRβ+ T cell population and used for further analysis as indicated here. B. Results of FACS analysis. Percent of CD8+ T cells, CD4+ T cells, and Treg cells in homozygous B-hIL1B mice were similar to those in the C57BL/6 mice, demonstrating that introduction of hIL1B in place of its mouse counterpart does not change the overall development, differentiation or distribution of these T cell subtypes in blood. Values are expressed as mean ± SEM.
-
In vivo efficacy of anti human IL1B antibody
-
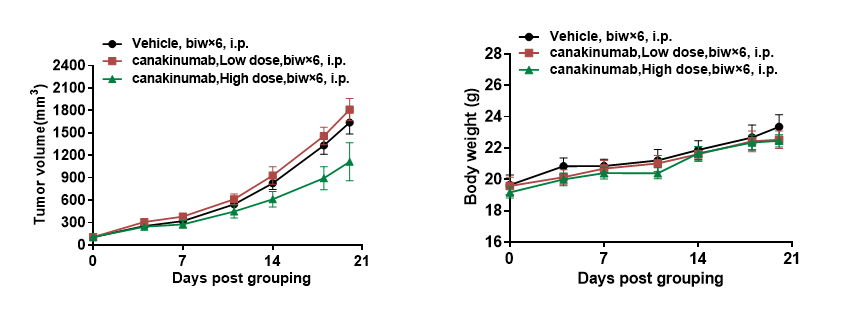
Antitumor activity of anti-human IL1B antibody in B-hIL1B mice. (A) Anti human IL1B antibody canakinumab(in house) inhibited MC38 tumor growth in B-hIL1B mice. Murine colon cancer MC38 cells were subcutaneously implanted into homozygous B-hIL1B mice (female, 6 week-old, n=5). Mice were grouped when tumor volume reached approximately 100 mm3, at which time they were treated with anti-human IL1B antibody canakinumab(in house) with different doses and schedules indicated in panel. (B) Body weight changes during treatment. As shown in panel A, anti-human IL1B antibody canakinumab(in house) was efficacious in controlling tumor growth in B-hIL1B mice, demonstrating that the B-hIL1B mice provide a powerful preclinical model for in vivo evaluation of anti-human IL1B antibodies. Values are expressed as mean ± SEM.
