
Basic Information
-
Gene Targeting Strategy

-
Gene targeting strategy for B-hIL2/hIL2RA/hIL2RB mice.
The mouse Il2 gene that encoding the full coding sequence was replaced by human IL2 full coding sequence in B-hIL2/hIL2RA/hIL2RB mice.
The exons 2-6 of mouse Il2ra gene that encodes the extracellular domain were replaced by human IL2RA exons 2-6 in B-hIL2/hIL2RA/hIL2RB mice.
The exons 2~8 of mouse Il2rb gene that encodes the extracellular domain were replaced by human IL2RB exons 2-8 in B-hIL2/hIL2RA/hIL2RB mice.
-
Protein Expression Analysis
-
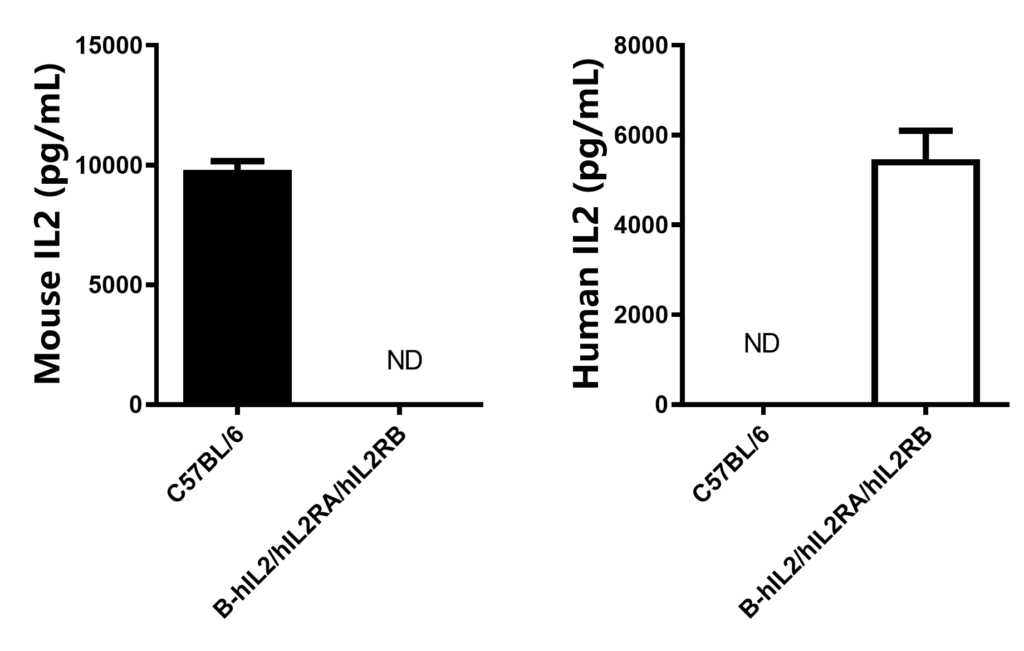
Strain specific IL2 expression analysis in homozygous B-hIL2/hIL2RA/ hIL2RB mice by ELISA. Serum was collected from wild-type mice (+/+) and homozygous B-hIL2/hIL2RA/ hIL2RB mice (H/H) stimulated with anti-mCD3 and anti-mCD28 in vitro, and analyzed by ELISA with species-specific IL2 ELISA kit. Mouse IL2 was detectable in wild-type mice. Human IL2 was exclusively detectable in homozygous B-hIL2/hIL2RA/ hIL2RB mice but not in wild-type mice. (ND: Not detectable)
IL2RA protein expression in T cells
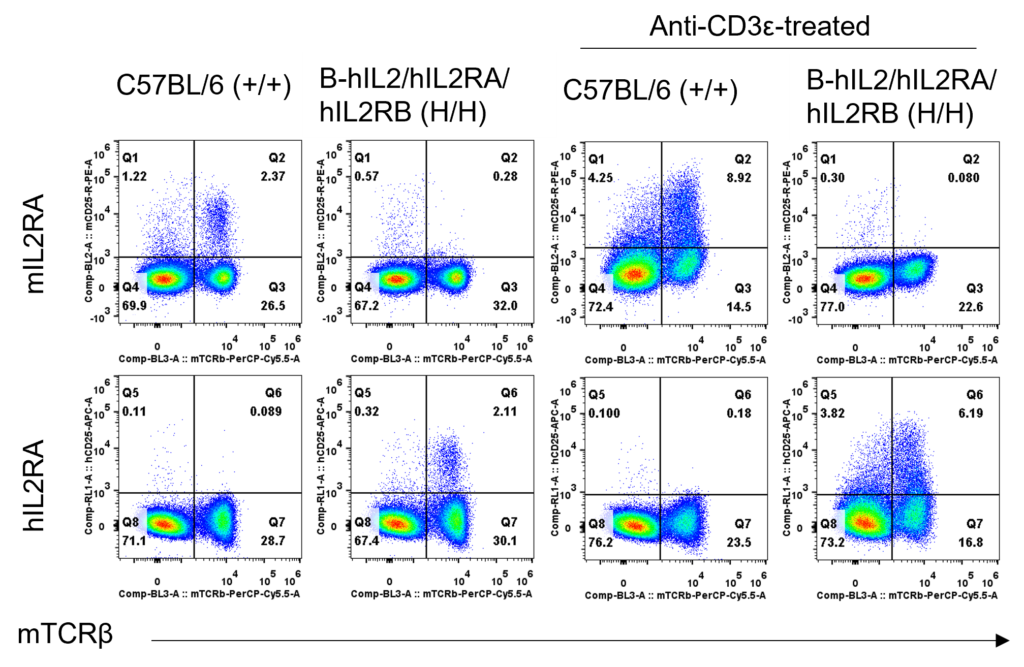
Strain specific IL2RA expression analysis in homozygous B-hIL2/hIL2RA/hIL2RB mice (H/H) by flow cytometry. Splenocytes were collected from wild-type mice (+/+) and homozygous B-hIL2/hIL2RA/hIL2RB mice (H/H) stimulated with anti-CD3ε in vivo, and analyzed by flow cytometry with anti-IL2RA antibody. Mouse IL2RA was detectable in T cells of wild-type mice. Human IL2RA was exclusively detectable in T cells of homozygous B-hIL2/hIL2RA/hIL2RB (H/H) but not in wild-type mice by the species-specific anti-IL2RA antibody.
IL2RA protein expression in CD4+ T cells
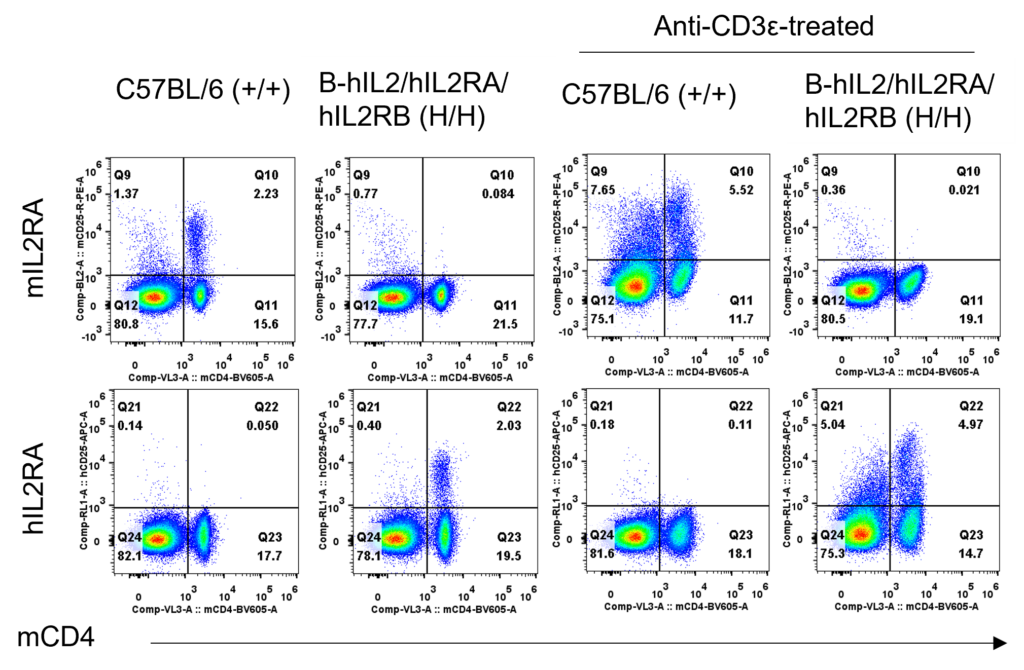
Strain specific IL2RA expression analysis in homozygous B-hIL2/hIL2RA/hIL2RB mice (H/H) by flow cytometry. Splenocytes were collected from wild-type mice (+/+) and homozygous B-hIL2/hIL2RA/hIL2RB mice (H/H) stimulated with anti-CD3ε in vivo, and analyzed by flow cytometry with anti-IL2RA antibody. Mouse IL2RA was detectable in CD4+ T cells of wild-type mice. Human IL2RA was exclusively detectable in CD4+ T cells of homozygous B-hIL2/hIL2RA/hIL2RB (H/H) but not in wild-type mice by the species-specific anti-IL2RA antibody.
IL2RA protein expression in CD8+ T cells
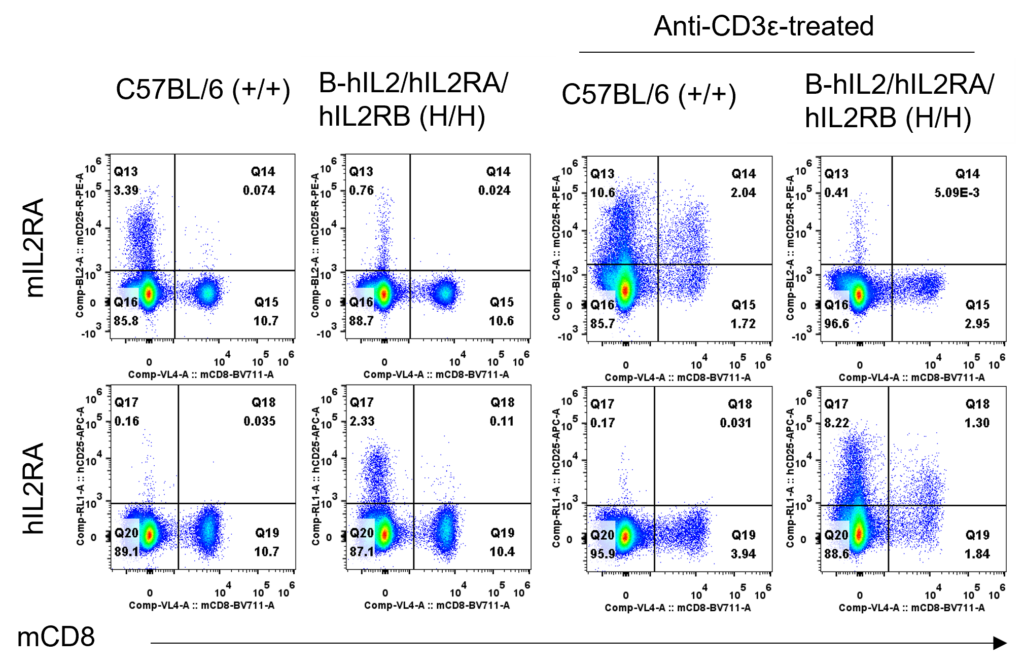
Strain specific IL2RA expression analysis in homozygous B-hIL2/hIL2RA/hIL2RB mice (H/H) by flow cytometry. Splenocytes were collected from wild-type mice (+/+) and homozygous B-hIL2/hIL2RA/hIL2RB mice (H/H) stimulated with anti-CD3ε in vivo, and analyzed by flow cytometry with anti-IL2RA antibody. Mouse IL2RA was detectable in CD8+ T cells of wild-type mice. Human IL2RA was exclusively detectable in CD8+ T cells of homozygous B-hIL2/hIL2RA/hIL2RB (H/H) but not in wild-type mice by the species-specific anti-IL2RA antibody.
IL2RA protein expression in Treg cells

Strain specific IL2RA expression analysis in homozygous B-hIL2/hIL2RA/hIL2RB mice (H/H) by flow cytometry. Splenocytes were collected from wild-type mice (+/+) and homozygous B-hIL2/hIL2RA/hIL2RB mice (H/H) stimulated with anti-CD3ε in vivo, and analyzed by flow cytometry with anti-IL2RA antibody. Mouse IL2RA was detectable in Treg cells of wild-type mice. Human IL2RA was exclusively detectable in Treg cells of homozygous B-hIL2/hIL2RA/hIL2RB (H/H) but not in wild-type mice by the species-specific anti-IL2RA antibody.
IL2RB protein expression in T cells

Strain specific IL2RB expression analysis in homozygous B-hIL2/hIL2RA/hIL2RB mice (H/H) by flow cytometry. Splenocytes were collected from wild-type mice (+/+) and homozygous B-hIL2/hIL2RA/hIL2RB mice (H/H) stimulated with anti-CD3ε in vivo, and analyzed by flow cytometry with anti-IL2RB antibody. Mouse IL2RB was detectable in T cells of wild-type mice. Human IL2RB was exclusively detectable in T cells of homozygous B-hIL2/hIL2RA/hIL2RB (H/H) but not in wild-type mice by the species-specific anti-IL2RB antibody.
IL2RB protein expression in CD4+ T cells

Strain specific IL2RB expression analysis in homozygous B-hIL2/hIL2RA/hIL2RB mice (H/H) by flow cytometry. Splenocytes were collected from wild-type mice (+/+) and homozygous B-hIL2/hIL2RA/hIL2RB mice (H/H) stimulated with anti-CD3ε in vivo, and analyzed by flow cytometry with anti-IL2RB antibody. Mouse IL2RB was detectable in CD4+ T cells of wild-type mice. Human IL2RB was exclusively detectable in CD4+ T cells of homozygous B-hIL2/hIL2RA/hIL2RB (H/H) but not in wild-type mice by the species-specific anti-IL2RB antibody.
IL2RB protein expression in CD8+ T cells

Strain specific IL2RB expression analysis in homozygous B-hIL2/hIL2RA/hIL2RB mice (H/H) by flow cytometry. Splenocytes were collected from wild-type mice (+/+) and homozygous B-hIL2/hIL2RA/hIL2RB mice (H/H) stimulated with anti-CD3ε in vivo, and analyzed by flow cytometry with anti-IL2RB antibody. Mouse IL2RB was detectable in CD8+ T cells of wild-type mice. Human IL2RB was exclusively detectable in CD8+ T cells of homozygous B-hIL2/hIL2RA/hIL2RB (H/H) but not in wild-type mice by the species-specific anti-IL2RB antibody.
-
Immune Cell Analysis
-
Analysis of leukocyte subpopulation in B-hIL2/hIL2RA/hIL2RB mice


Analysis of spleen leukocyte subpopulations by FACS. Splenocytes were isolated from C57BL/6 and B-hIL2/hIL2RA/hIL2RB mice (female, n=3, 8-week-old). Flow cytometry analysis of the splenocytes were performed to assess leukocyte subpopulations. (A) Representative FACS plots. Single live cells were gated for the CD45+ population and used for further analysis as indicated here. (B) Results of FACS analysis. The percent of T cells, B cells, NK cells, granulocytes, dendritic cells, monocytes and macrophages in homozygous B-hIL2/hIL2RA/hIL2RB mice were similar to those in the C57BL/6 mice. Values are expressed as mean ± SEM.
Analysis of spleen T cell subpopulations in B-hIL2/hIL2RA/hIL2RB mice

Analysis of spleen T cell subpopulations by FACS. Splenocytes were isolated from C57BL/6 and B-hIL2/hIL2RA/hIL2RB mice (female, n=3, 8-week-old). Flow cytometry analysis of the splenocytes were performed to assess leukocyte subpopulations. (A) Representative FACS plots. Single live CD45+ cells were gated for TCRβ+ T cell population and used for further analysis as indicated here. (B) Results of FACS analysis. The percent of CD8+ T cells, CD4+ T cells and Tregs in homozygous B-hIL2/hIL2RA/hIL2RB mice were similar to those in the C57BL/6 mice. Values are expressed as mean ± SEM.
Analysis of leukocyte subpopulation in B-hIL2/hIL2RA/hIL2RB mice


Analysis of blood leukocyte subpopulations by FACS. Blood cells were isolated from C57BL/6 and B-hIL2/hIL2RA/hIL2RB mice (female, n=3, 8-week-old). Flow cytometry analysis of the blood cells were performed to assess leukocyte subpopulations. (A) Representative FACS plots. Single live cells were gated for the CD45+ population and used for further analysis as indicated here. (B) Results of FACS analysis. The percent of T cells, B cells, granulocytes, dendritic cells, monocytes and macrophages in homozygous B-hIL2/hIL2RA/hIL2RB mice were similar to those in the C57BL/6 mice. NK cells were decrease in homozygous B-hIL2/hIL2RA/hIL2RB mice than those in the C57BL/6 mice. Values are expressed as mean ± SEM.
Analysis of blood T cell subpopulations in B-hIL2/hIL2RA/hIL2RB mice

Analysis of blood T cell subpopulations by FACS. Blood cells were isolated from C57BL/6 and B-hIL2/hIL2RA/hIL2RB mice (female, n=3, 8-week-old). Flow cytometry analysis of the blood cells were performed to assess leukocyte subpopulations. (A) Representative FACS plots. Single live CD45+ cells were gated for TCRβ+ T cell population and used for further analysis as indicated here. (B) Results of FACS analysis. The percent of CD8+ T cells, CD4+ T cells and Tregs in homozygous B-hIL2/hIL2RA/hIL2RB mice were similar to those in the C57BL/6 mice. Values are expressed as mean ± SEM.
Analysis of lymph node leukocyte subpopulation in B-hIL2/hIL2RA/hIL2RB mice

Analysis of lymph node leukocyte subpopulations by FACS. Lymph node cells were isolated from C57BL/6 and B-hIL2/hIL2RA/hIL2RB mice (female, n=3, 8-week-old). Flow cytometry analysis of the lymph node cells were performed to assess leukocyte subpopulations. (A) Representative FACS plots. Single live cells were gated for the CD45+ population and used for further analysis as indicated here. (B) Results of FACS analysis. The percent of T cells tend to increase, NK cells and B cells tend to decrease in homozygous B-hIL2/hIL2RA/hIL2RB mice than those in C57BL/6 mice. Values are expressed as mean ± SEM.
Analysis of lymph node T cell subpopulations in B-hIL2/hIL2RA/hIL2RB mice

Analysis of lymph node T cell subpopulations by FACS. Lymph node cells were isolated from C57BL/6 and B-hIL2/hIL2RA/hIL2RB mice (female, n=3, 8-week-old). Flow cytometry analysis of the lymph node cells were performed to assess leukocyte subpopulations. (A) Representative FACS plots. Single live CD45+ cells were gated for TCRβ+ T cell population and used for further analysis as indicated here. (B) Results of FACS analysis. The percent of CD8+ T cells, CD4+ T cells and Tregs in homozygous B-hIL2/hIL2RA/hIL2RB mice were similar to those in the C57BL/6 mice. Values are expressed as mean ± SEM.
-
IL2 Stimulates the Phosphorylation of STAT5 in CD3+ T Cells
-

IL2 stimulates the phosphorylation of STAT5 in CD3+ T cells. Splenocytes were collected from wild-type C57BL/6 mice (+/+), homozygous B-hIL2RA mice and B-hIL2/hIL2RA/hIL2RB mice (H/H) separately. Stimulated the T cells with human IL2 (100U/mL), and analyzed by flow cytometry with anti-pSTAT5 antibody. The phosphorylation of STAT5 were both detection in B-hIL2RA and B-hIL2/hIL2RA/hIL2RB mice. Results indicate that the intracellular signaling of the B-hIL2/hIL2RA/hIL2RB mice was not affected by humanization.
-
Summary
-
Protein expression analysis:
- Human IL2, IL2RA and IL2RB were detectable in B-hIL2/hIL2RA/hIL2RB mice but not in wild-type C57BL/6 mice.
Phosphorylation of STAT5 induced by IL2:
- Human IL2 induce pSTAT5 in T cells of B-hIL2/hIL2RA/hIL2RB mice.
Analysis of leukocyte subpopulations:
- T cells, B cells, granulocytes, dendritic cells, monocytes and macrophages in spleen and blood of B-hIL2/hIL2RA/hIL2RB mice were similar to those in the C57BL/6 mice.
- In lymph node, T cells tend to increase, and B cells tend to decrease in B-hIL2/hIL2RA/hIL2RB mice than those in C57BL/6 mice.
- For NK cell, it has no significant difference in spleen of B-hIL2/hIL2RA/hIL2RB mice and C57BL/6 mice. But, it tends to decrease in blood and lymph node of B-hIL2/hIL2RA/hIL2RB mice.
- T cell subtypes in spleen, blood and lymph node of B-hIL2/hIL2RA/hIL2RB were similar to those in the C57BL/6 mice.
