
Basic Information
-
Gene Targeting Strategy

-
Gene targeting strategy for B-hA2AR mice. The exon 2~3 of mouse Adora2a gene that encodes the full-length protein was replaced by human ADORA2A exon 2~3 in B-hA2AR mice.
-
mRNA Expression Analysis
-
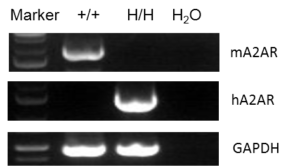
Strain specific analysis of A2AR gene expression in WT and hA2AR mice by RT-PCR. Mouse A2ar mRNA was detectable only in splenocytes of wild-type (+/+) mice. Human A2AR mRNA was detectable only in H/H, but not in +/+ mice.
-
Protein Expression Analysis
-
Protein expression analysis in T cells
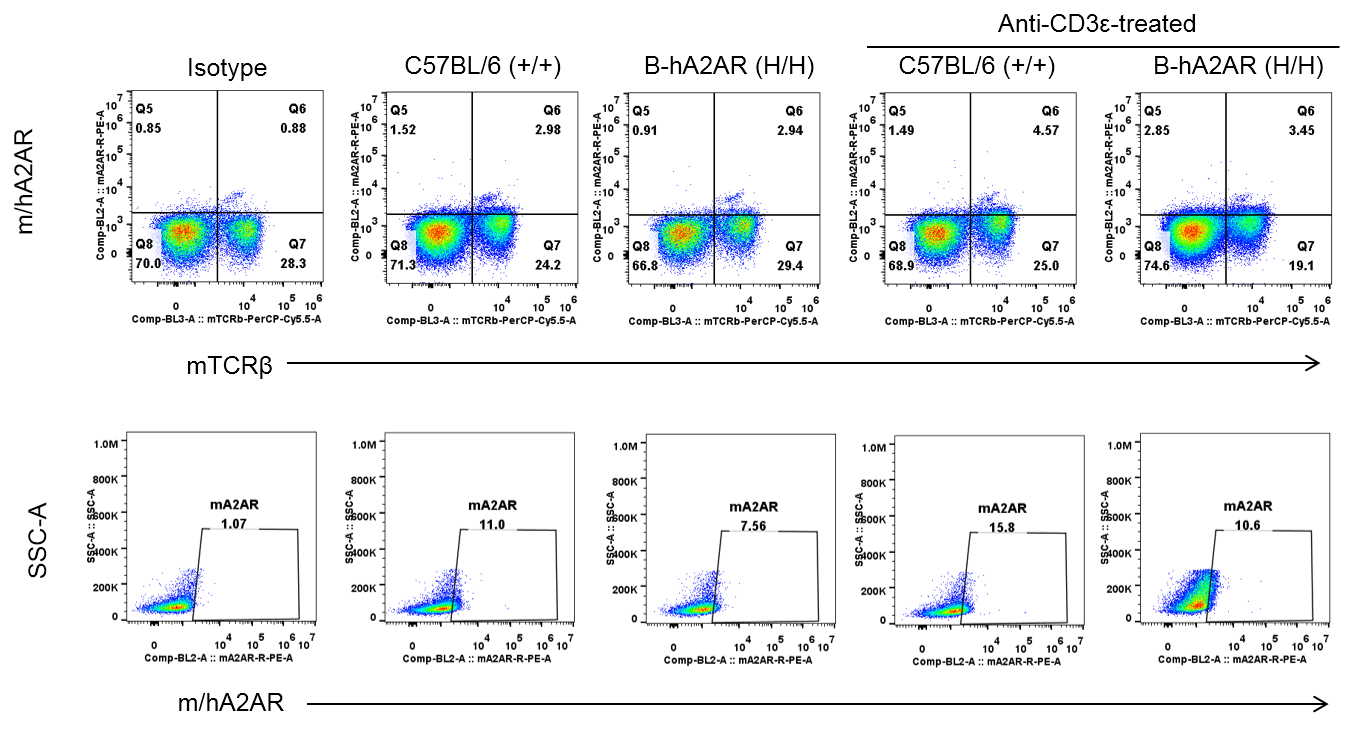
Species-specific A2AR protein expression analysis in humanized B-hA2AR mice. Splenocytes were isolated from wild-type C57BL/6 (+/+) and homozygous B-hA2AR (H/H) mice stimulated with anti-CD3ε (7.5 μg/mice, stimulation for 24 hours, i.p.) in vivo, and analyzed by flow cytometry using anti-m/hA2AR antibodies. Murine and human A2AR proteins were detected in wild-type and B-hA2AR mice.
Protein expression analysis in CD4+ T cells
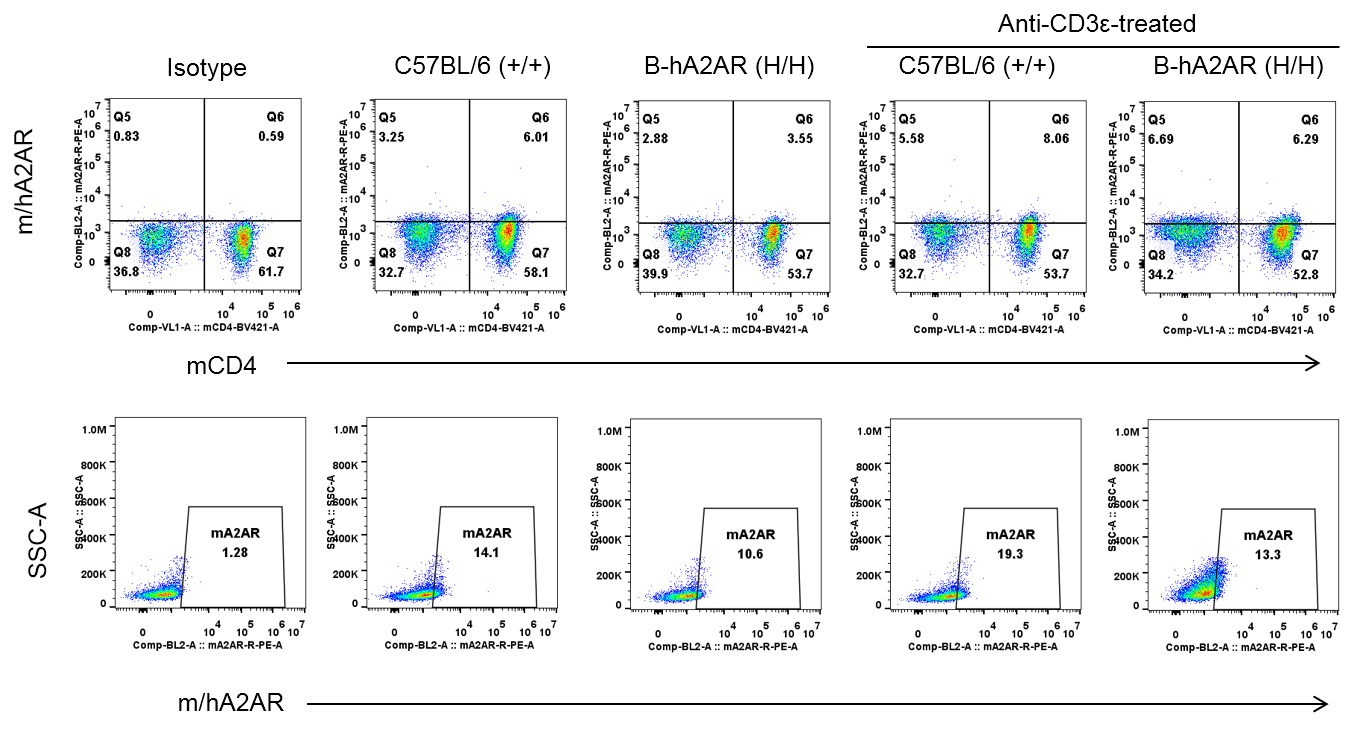
Strain specific A2AR expression analysis in homozygous B-hA2AR mice by flow cytometry. Splenocytes were collected from WT and homozygous B-hA2AR (H/H) mice stimulated with anti-CD3ε (7.5 μg/mice, stimulation for 24 hours, i.p.) in vivo, and analyzed by flow cytometry with species-specific anti-A2AR antibody. Mouse A2AR was detectable in WT mice, human A2AR was detectable in homozygous B-hA2AR due to the anti-mouse A2AR antibody also cross-reacts with human A2AR.
-
Functional Analysis
-
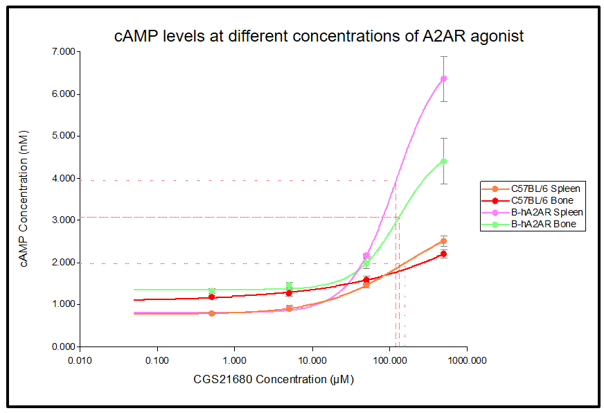
cAMP measurements in spleen and bone of wild-type mice and B-hA2AR mice incubated with different concentration of CGS21680 (an A2AR agonist), and analyzed by LANCE® Ultra cAMP Kit (PerkinElmer). The cAMP levels of spleen cells and bone marrow cells in B-hA2AR mice were higher than those in C57BL/6 mice at 500μM CGS21680. It was speculated that B-hA2AR mice were more sensitive to the stimulation of CGS201680 than wild mice. At the background level, there was no significant difference in A2AR mediated cAMP pathway between B-hA2AR and C57BL/6 mice. Compared with C57BL/6, B-hA2AR more effectively mediated the A2AR-dependent cAMP pathway under strong stimulation.
-
Analysis of Immune Cells
-
Analysis of spleen leukocyte subpopulations in B-hA2AR mice
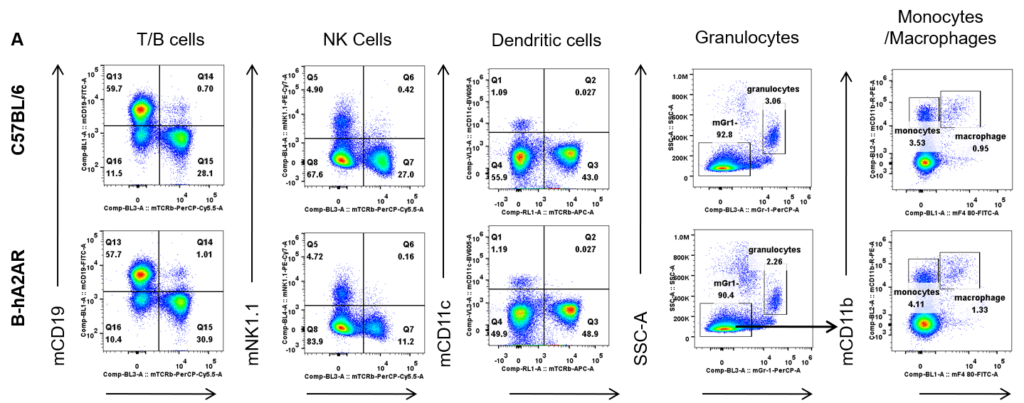
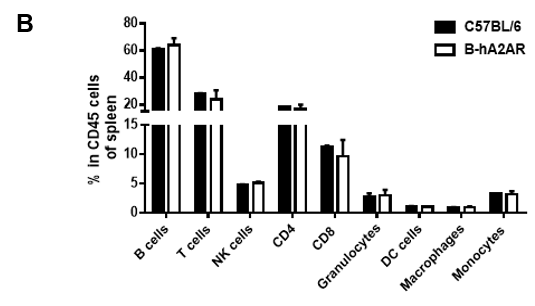
Analysis of splenic leukocyte subpopulations by flow cytometry. Splenocytes were isolated from female C57BL/6 and B-hA2AR mice (n=3, 6 weeks-old) and analyzed by flow cytometry to assess leukocyte subpopulations. (A) Representative flow cytometry plots gated on single live CD45+ cells for further analysis. (B) Results of flow cytometry analysis. Percentages of T, B, NK cells, monocytes/macrophages, and DC were similar in homozygous B-hA2AR mice and C57BL/6 mice, demonstrating that introduction of hA2AR in place of its mouse counterpart does not change the overall development, differentiation, or distribution of these cell types in spleen. Values are expressed as mean ± SEM.
Analysis of spleen T cell subpopulations in B-hA2AR mice
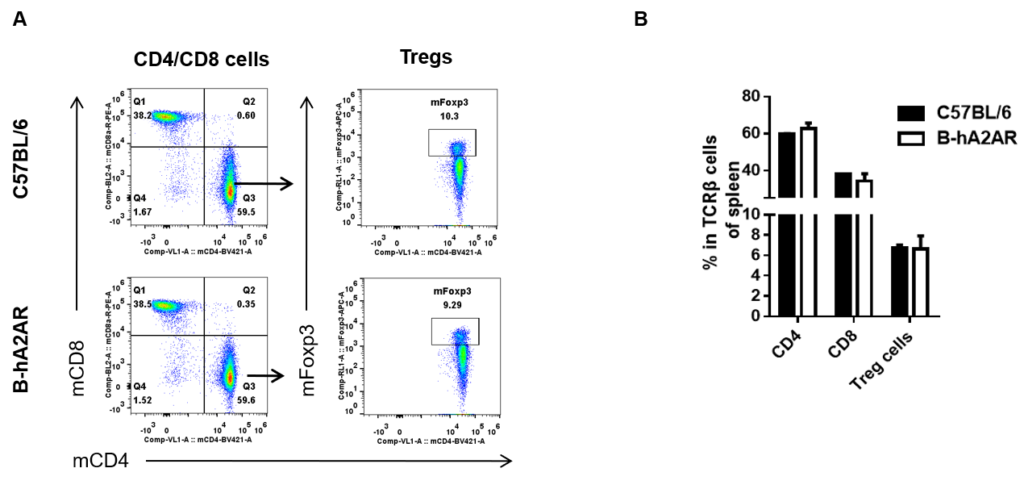
Analysis of splenic T cell subpopulations by flow cytometry. Splenocytes were isolated from female C57BL/6 and B-hA2AR mice (n=3, 6 weeks-old) and analyzed by flow cytometry for T cell subsets. (A) Representative flow cytometry plots gated on TCRβ+ T cells and further analyzed. (B) Results of flow cytometry analysis. Percentages of CD8+, CD4+, and Treg cells were similar in homozygous B-hA2AR and C57BL/6 mice, demonstrating that introduction of hA2AR in place of its mouse counterpart does not change the overall development, differentiation or distribution of these T cell subtypes in spleen. Values are expressed as mean ± SEM.
Analysis of blood leukocyte subpopulations in B-hA2AR mice
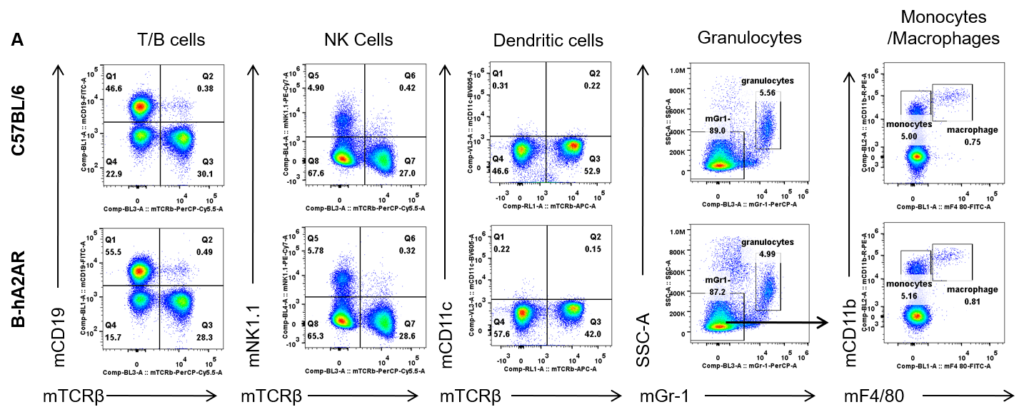
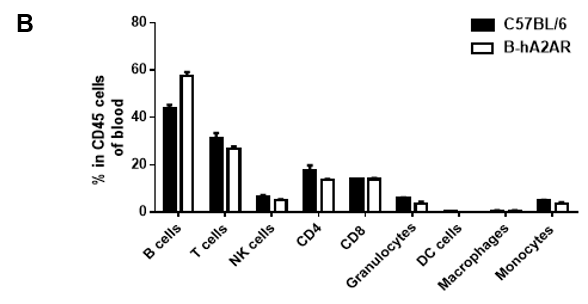
Analysis of blood leukocyte subpopulations by flow cytometry. Blood was isolated from female C57BL/6 and B-hA2AR mice (n=3, 6 weeks-old) and analyzed by flow cytometry to assess leukocyte subpopulations. (A) Representative flow cytometry plots gated on single live CD45+ cells for further analysis. (B) Results of FACS analysis. Percentages of T, B, NK cells, monocytes/macrophages, and DC were similar in homozygous B-hA2AR mice and C57BL/6 mice, demonstrating that introduction of hA2AR in place of its mouse counterpart does not change the overall development, differentiation, or distribution of these cell types in blood. Values are expressed as mean ± SEM.
Analysis of blood T cell subpopulations in B-hA2AR mice
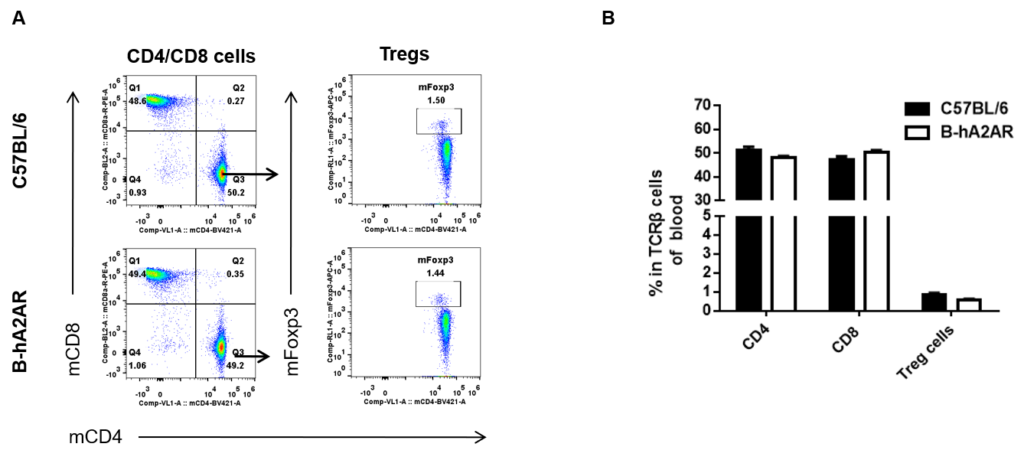
Analysis of blood T cell subpopulations by flow cytometry. Blood was isolated from female C57BL/6 and B-hA2AR mice (n=3, 6 weeks-old) and analyzed by flow cytometry for T cell subsets. (A) Representative FACS plots gated on TCRβ+ T cells and further analyzed. (B) Results of flow cytometry analysis. Percentages of CD8+, CD4+, and Treg cells were similar in homozygous B-hA2AR and C57BL/6 mice, demonstrating that introduction of hA2AR in place of its mouse counterpart does not change the overall development, differentiation or distribution of these T cell subtypes in blood. Values are expressed as mean ± SEM. -
In Vivo Efficacy of A2AR Small Molecule Drugs
-
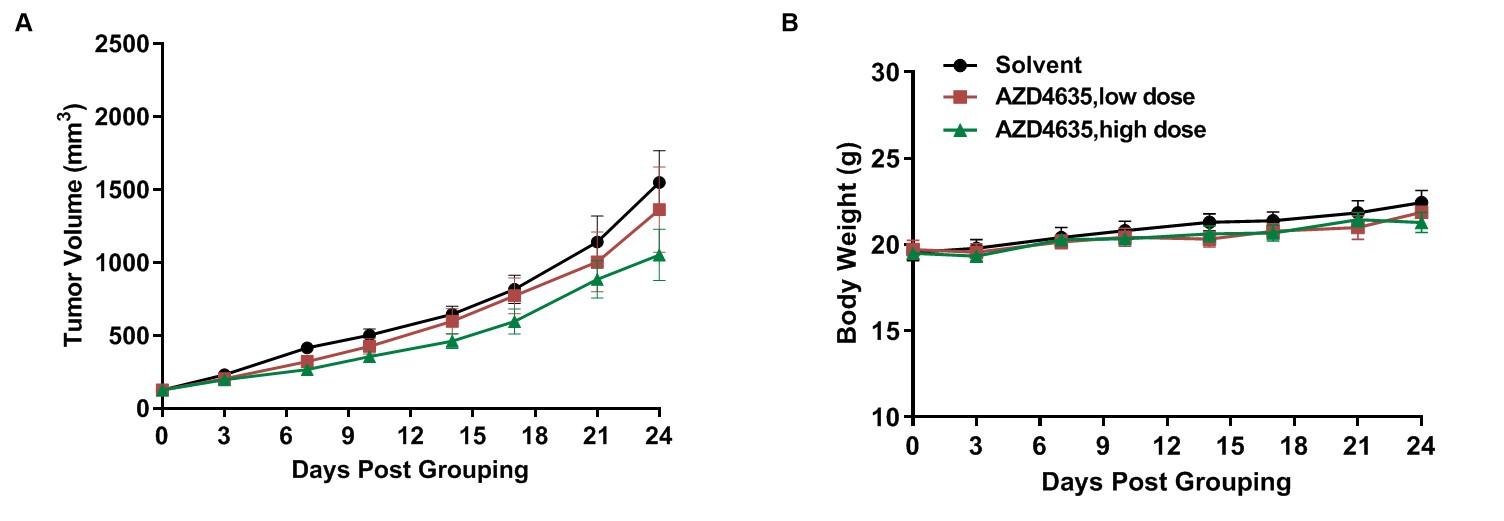
Anti-tumor activity of A2AR small molecule drugs in B-hA2AR mice. (A) A2AR small molecule drugs inhibited MC38 tumor growth in B-hA2AR mice. Murine colon cancer MC38 cells were subcutaneously implanted into homozygous B-hA2AR mice (female, 8-9 week-old, n=6). Mice were grouped when tumor volume reached approximately 100 mm3, at which time they were treated with A2AR small molecule drug. (B) Body weight changes during treatment. As shown in panel A, A2AR small molecule drugs were effective at controlling tumor growth in B-hA2AR, demonstrating that the B-hA2AR mice provide a powerful preclinical model for in vivo evaluation of A2AR small molecule drugs. Values are expressed as mean ± SEM.
