
Basic Information
-
Targeting strategy

-
The exon 2 of mouse CB1 gene that encodes the full-length protein was replaced by human CB1 exon 2 in B-hCB1 mice.
-
mRNA expression analysis
-
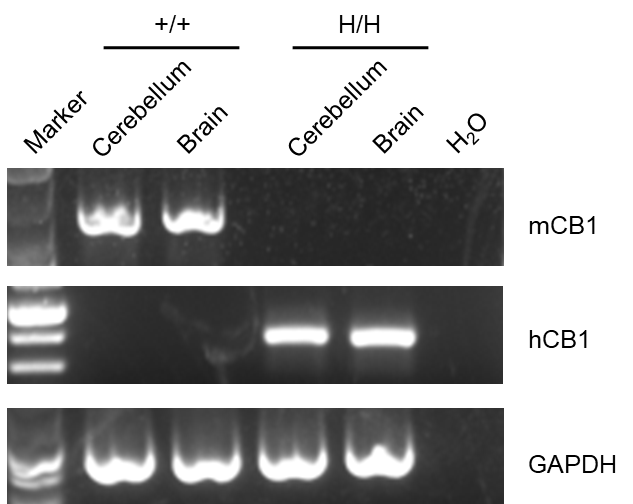
Strain specific analysis of CB1 gene expression in wild-type C57BL/6 mice and B-hCB1 mice by RT-PCR. Mouse CB1 mRNA was detectable only in cerebellum and brain cells of wild-type C57BL/6 mice (+/+). Human CB1 mRNA was detectable only in cerebellum and brain cells of homozygous B-hCB1 mice (H/H), but not in wild-type mice.
-
Protein expression analysis
-
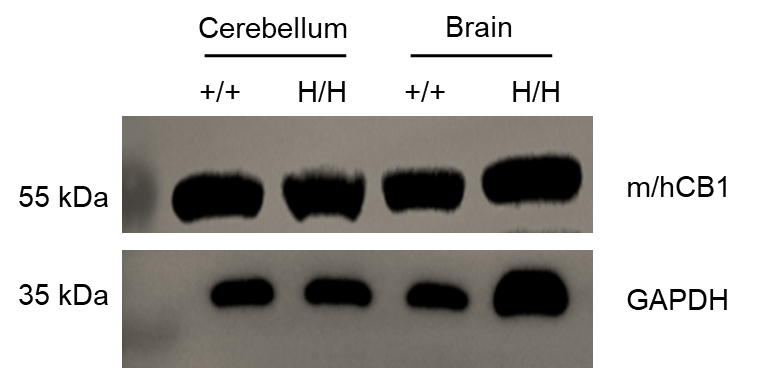
Strain specific CB1 expression analysis in homozygous B-hCB1 mice by western blot. Cerebellum and brain tissue was collected from wild-type C57BL/6 mice (+/+) and homozygous B-hCB1 mice (H/H) and analyzed by western blot with anti-CB1 antibody which was cross reactive between mouse and human. Mouse and human CB1 were detectable in wild-type mice and homozygous B-hCB1 mice.
-
In vivo efficacy of DIO model in B-hCB1 mice
-
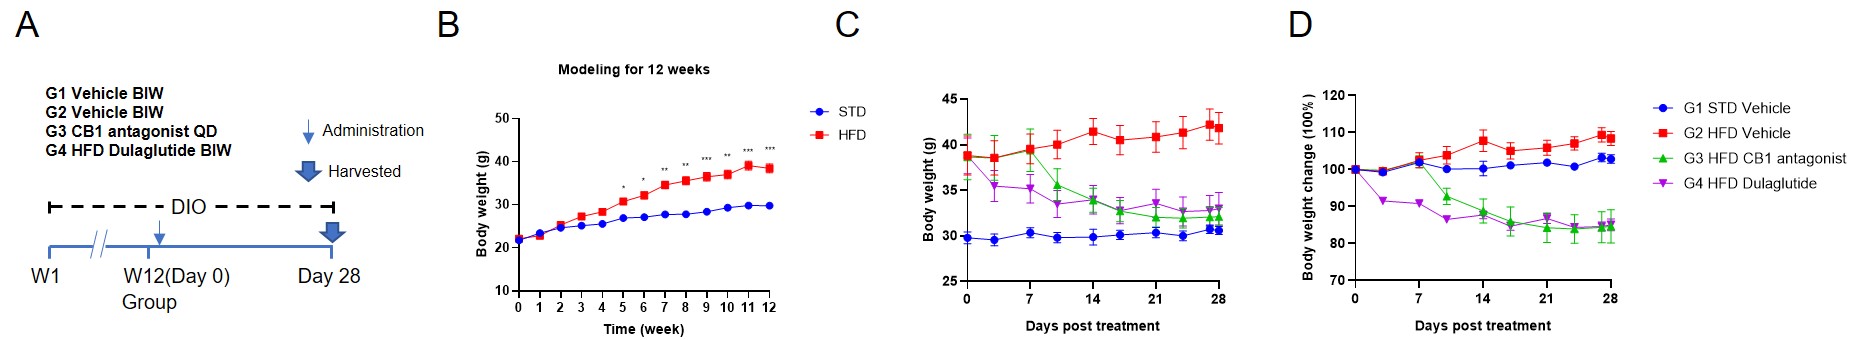
Weight of DIO model in B-hCB1 mice. 30 homozygous animals were randomly divided into 2 groups according to their body weight, 8 animals in group A, fed with STD and 22 animals in Group B, fed with HFD. DIO model of B-hCB1 mice was induced by HFD for 12 weeks, then randomly divided into 3 groups(G2, G3, and G4) and treated with vehicle, antagonists, and dulaglutide respectively(n=7-8). (A) The schematic diagram of experimental processing. (B) Body weight after 12 weeks of DIO. (C-D) Body weight and weight changes in each group after treatment. As shown in Figure B, compared with the group STD, the weight of the HFD group were significantly increased, indicating that B-hCB1 mice can successfully induce obesity models. As shown in Figure C and D, compared with the HFD vehicle group, CB1 antagonists and dulaglutide can significantly reduce the weight. Values are expressed as mean ± SEM.
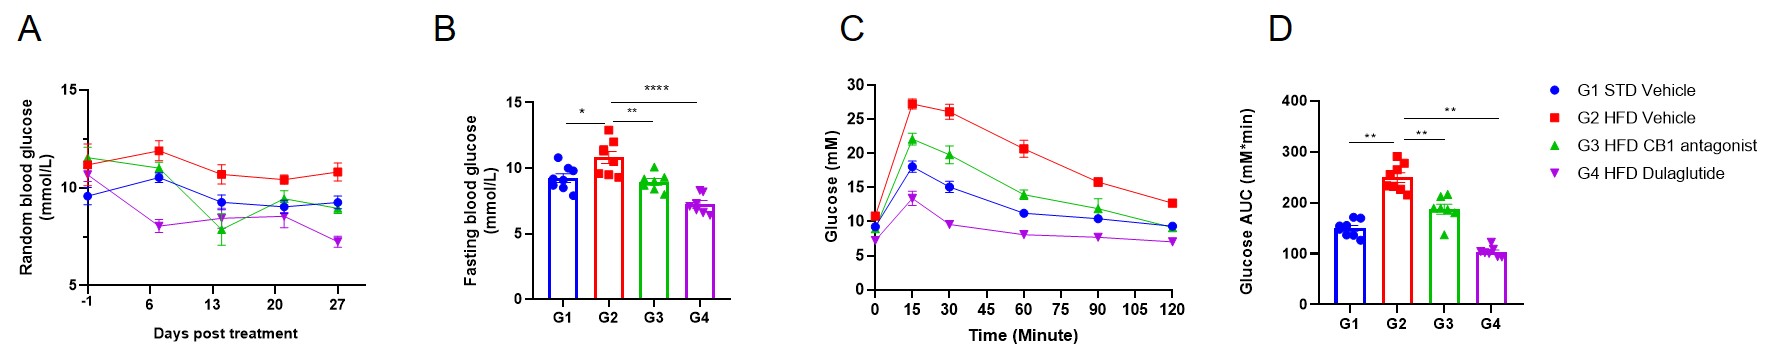
CB1 antagonist reduces blood glucose in male B-hCB1 mice. (A) Random blood glucose. (B) Fasting blood glucose in Day 27 post treatment. (C-D) Glucose tolerance test. As shown in the figure, the CB1 antagonist and dulaglutide can reduce the random blood glucose and fasting blood glucose and improve glucose tolerance in male B-hCB1 mice. Values are expressed as mean ± SEM.
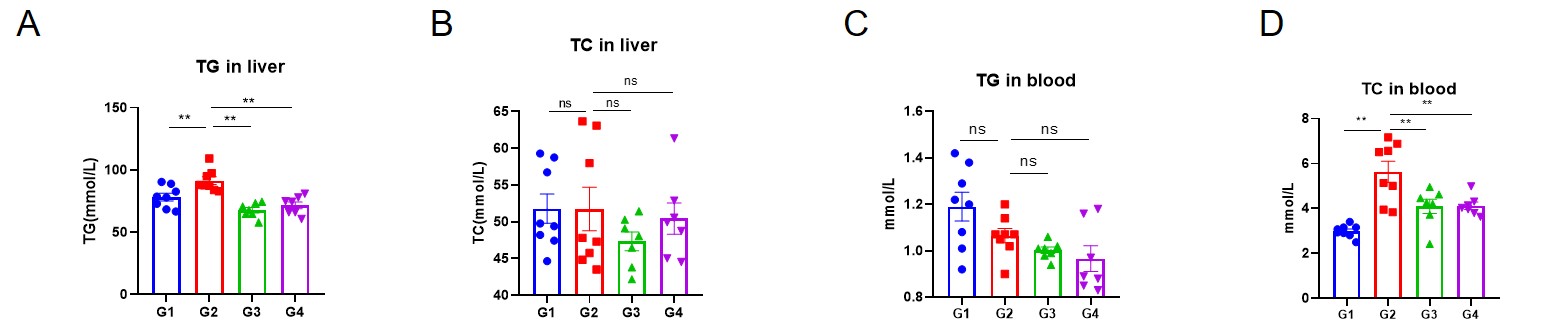
CB1 antagonist improved lipid metabolism in male B-hCB1 mice. (A) TG in liver. (B) TC in liver. (C) TG in blood. (D) TC in blood. As shown in the figure, the CB1 antagonist and dulaglutide can reduce the level of TG in liver and TC in blood. Values are expressed as mean ± SEM.
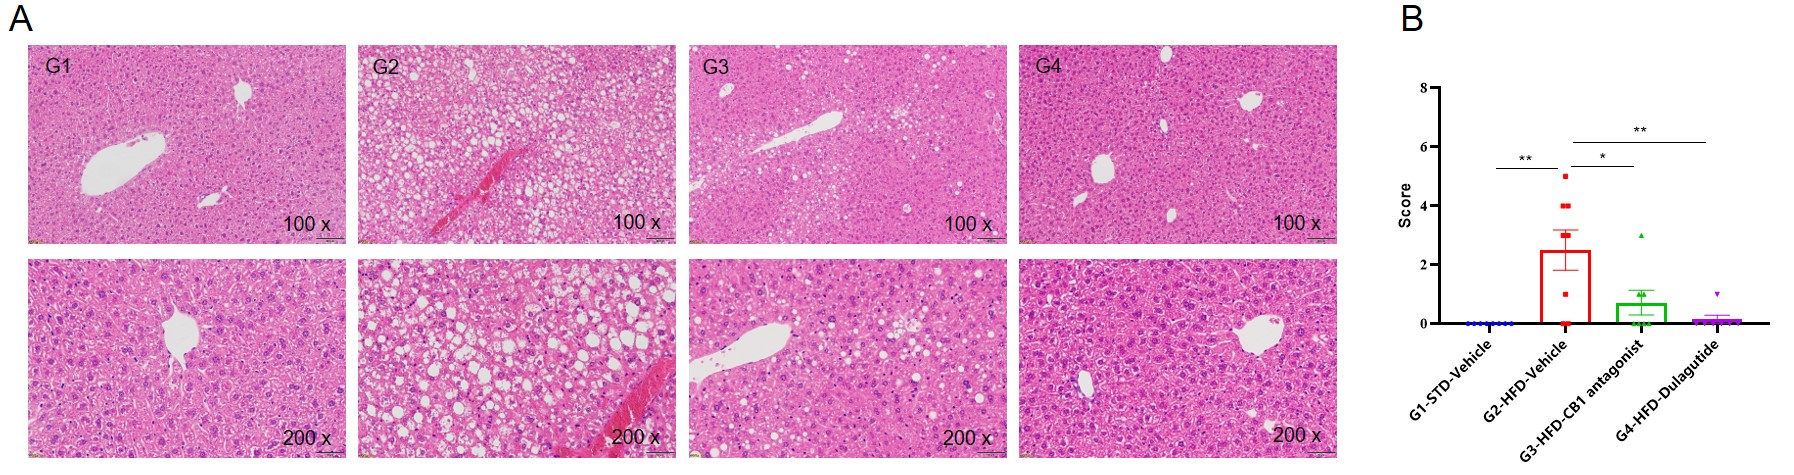
CB1 antagonist reduced liver damage caused by diet induced obesity in male B-hCB1 mice. (A) Representative H&E-stained liver images (representative dataset from n = 7-8 per group). (B) Statistical analysis of scores for hepatocellular steatosis, lobular inflammation and ballooning degeneration of liver cells. Values are expressed as mean ± SD. *p<0.05.
