
Basic Information
-
Gene Targeting Strategy

-
Gene targeting strategy for B-hBTLA mice. The exon 2 of mouse Btla gene that encodes the extracellular domain was replaced by human BTLA exon 2 in B-hBTLA mice.
-
mRNA Expression Analysis
-
mRNA Expression Analysis
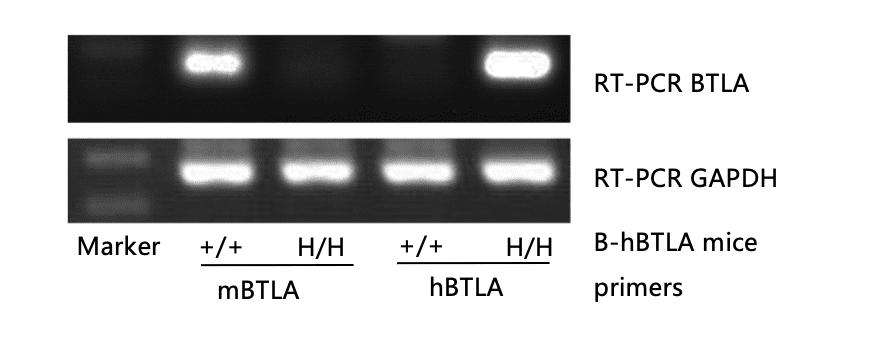
Strain specific analysis of BTLA gene expression in WT and hBTLA mice by RT-PCR. Mouse Btla mRNA was detectable only in splenocytes of wild-type (+/+) mice. Human BTLA mRNA was detectable only in H/H, but not in +/+ mice.
-
Protein Expression Analysis in T Cells
-

Strain specific BTLA expression analysis in homozygous B-hBTLA mice by flow cytometry. Splenocytes were collected from WT and homozygous B-hBTLA (H/H) mice stimulated with anti-CD3ε in vivo, and analyzed by flow cytometry with species-specific anti-BTLA antibody. Mouse BTLA was detectable in WT mice. Human BTLA was exclusively detectable in homozygous B-hBTLA but not WT mice.
-
Analysis of Splenic Leukocyte Subpopulations in B-hBTLA Mice
-
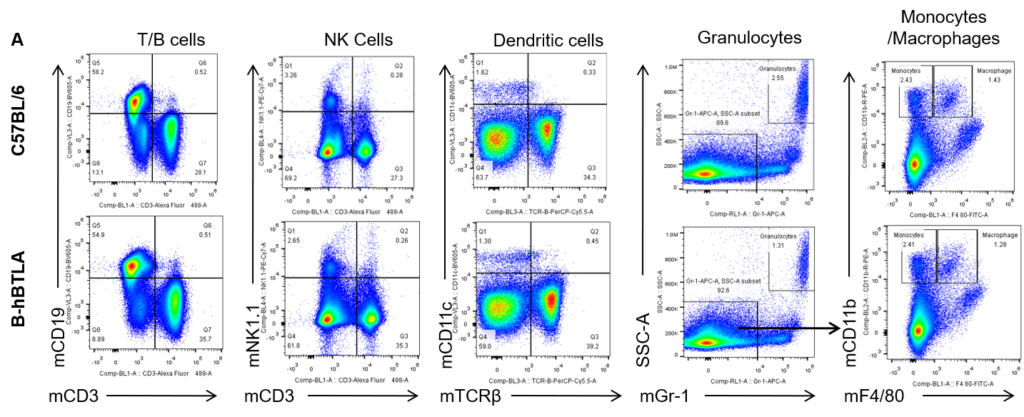
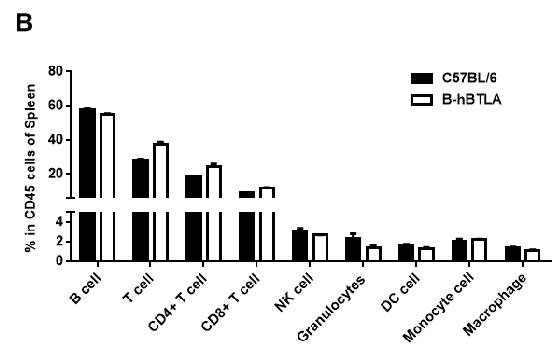
Analysis of splenic leukocyte subpopulations by FACS. Splenocytes were isolated from female C57BL/6 and B-hBTLA mice (n=3, 6 weeks-old) and analyzed by flow cytometry to assess leukocyte subpopulations. (A) Representative FACS plots gated on single live CD45+ cells for further analysis. (B) Results of FACS analysis. Percentages of T, B, NK cells, monocyte/macrophages, and DC were similar in homozygous B-hBTLA mice and C57BL/6 mice, demonstrating that introduction of hBTLA in place of its mouse counterpart does not change the overall development, differentiation, or distribution of these cell types in spleen. Values are expressed as mean ± SEM.
-
Analysis of Splenic T Cell Subpopulations in B-hBTLA Mice
-

Analysis of splenic T cell subpopulations by FACS. Splenocytes were isolated from female C57BL/6 and B-hBTLA mice (n=3, 6 weeks-old) and analyzed by flow cytometry for T cell subsets. (A) Representative FACS plots gated on CD3+ T cells and further analyzed. (B) Results of FACS analysis. Percentages of CD8+, CD4+, and Treg cells were similar in homozygous B-hBTLA and C57BL/6 mice, demonstrating that introduction of hBTLA in place of its mouse counterpart does not change the overall development, differentiation or distribution of these T cell subtypes in spleen. Values are expressed as mean ± SEM.
-
Analysis of Lymph Node Leukocyte Subpopulations in B-hBTLA Mice
-

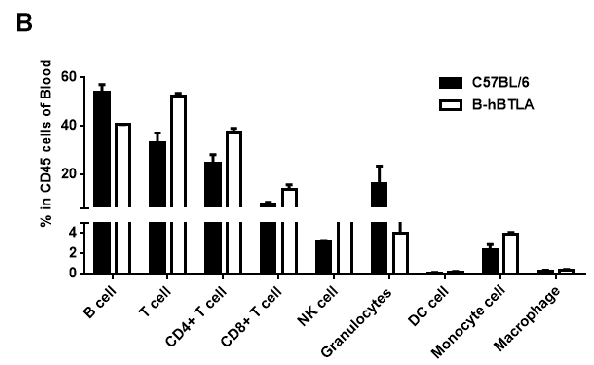
Analysis of lymph node leukocyte subpopulations by FACS. Leukocytes were isolated from female C57BL/6 and B-hBTLA mice (n=3, 6 week-old) Flow cytometry analysis of the leukocytes was performed to assess leukocyte subpopulations. (A) Representative FACS plots gated on single live CD45+ cells for further analysis. (B) Results of FACS analysis. Percentages of T, B and NK cells were similar in homozygous B-hBTLA mice and C57BL/6 mice, demonstrating that introduction of hBTLA in place of its mouse counterpart does not change the overall development, differentiation, or distribution of these cell types in lymph node. Values are expressed as mean ± SEM.
-
Analysis of Lymph Node T Cell Subpopulations in B-hBTLA Mice
-

Analysis of lymph node T cell subpopulations by FACS. Leukocytes were isolated from female C57BL/6 and B-hBTLA mice (n=3, 6 week-old) and analyzed by flow cytometry for T cell subsets. (A) Representative FACS plots gated on CD3+ T cells and further analyzed. (B) Results of FACS analysis. Percentages of CD8+, CD4+, and Treg cells were similar in homozygous B-hBTLA and C57BL/6 mice, demonstrating that introduction of hBTLA in place of its mouse counterpart does not change the overall development, differentiation or distribution of these T cell subtypes in lymph node. Values are expressed as mean ± SEM.
-
T Cells in B-hBTLA Mice Bind Anti-Human BTLA Antibody
-
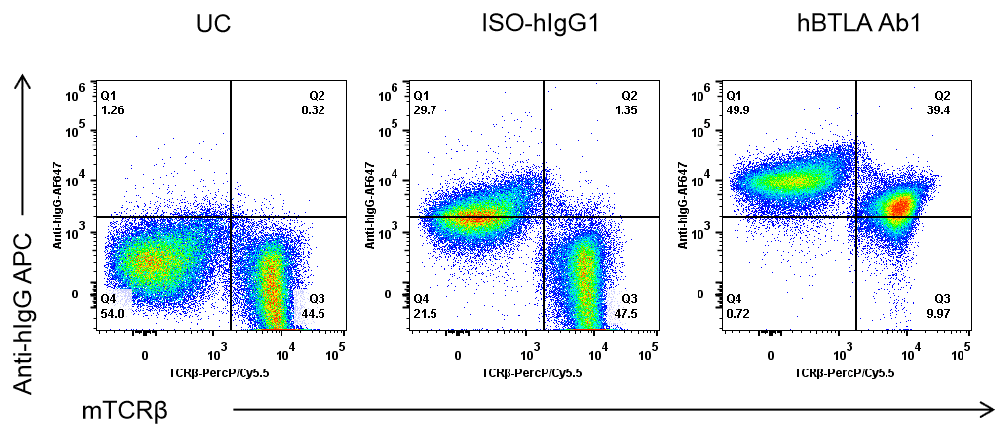
Analysis of splenocytes of B-hBTLA mice by FACS. Splenocytes were isolated from homozygous B-hBTLA mice. Flow cytometry analysis of the splenocytes was performed to assess anti-human BTLA Ab1 binding with T cells. Single live cells were gated for CD45 population and used for further analysis as indicated here. T cell in homozygous B-hBTLA mice binds well with hBTLA Ab1 (in house) vs isotype control.
-
In Vivo Efficacy of Anti-Human BTLA Antibodies
-
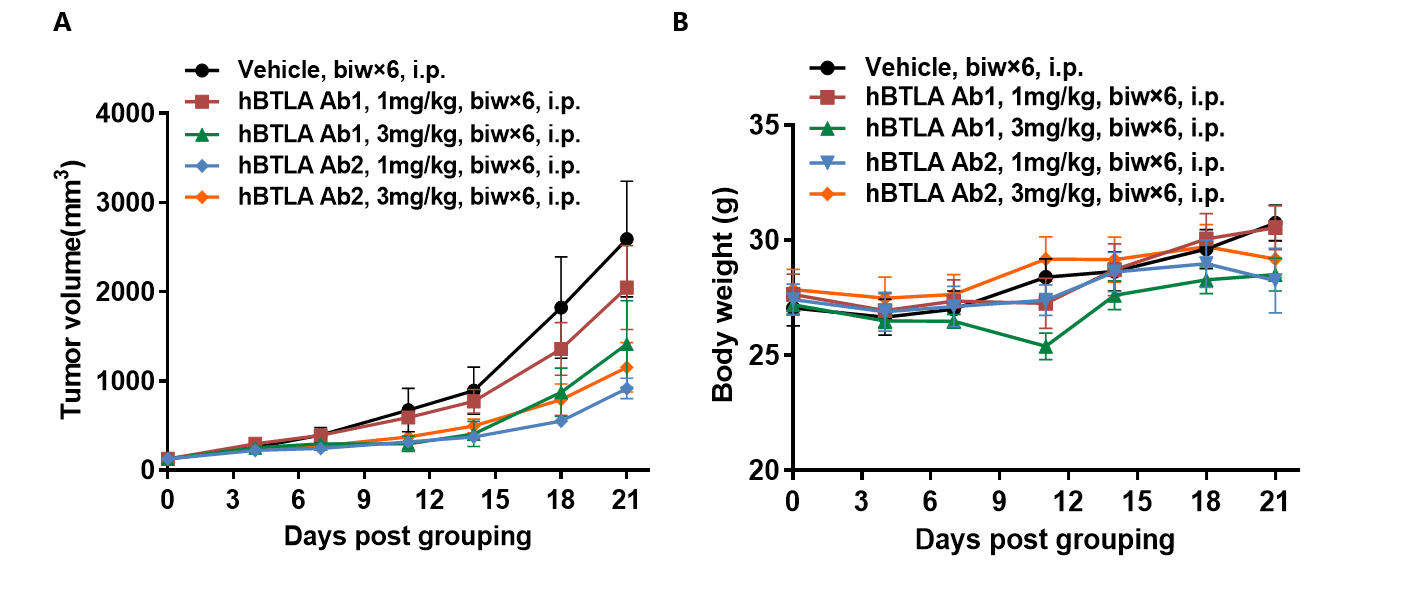
Anti-tumor activity of anti-human BTLA antibodies in B-hBTLA mice. (A) Anti-human BTLA antibodies inhibited MC38 tumor growth in B-hBTLA mice. Murine colon cancer hHVEM MC38 cells were subcutaneously implanted into homozygous B-hBTLA mice (female, 6-7 week-old, n=5). Mice were grouped when tumor volume reached approximately 100 mm3, at which time they were treated with two anti-human BTLA antibodies with doses and schedules indicated in panel A. (B) Body weight changes during treatment. As shown in panel A, anti-human BTLA antibodies were efficacious in controlling tumor growth in B-hBTLA mice, demonstrating that the B-hBTLA mice provide a powerful preclinical model for in vivo evaluation of anti-human BTLA antibodies. Values are expressed as mean ± SEM.
-
In Vivo Efficacy of Anti-Human BTLA Antibodies
-
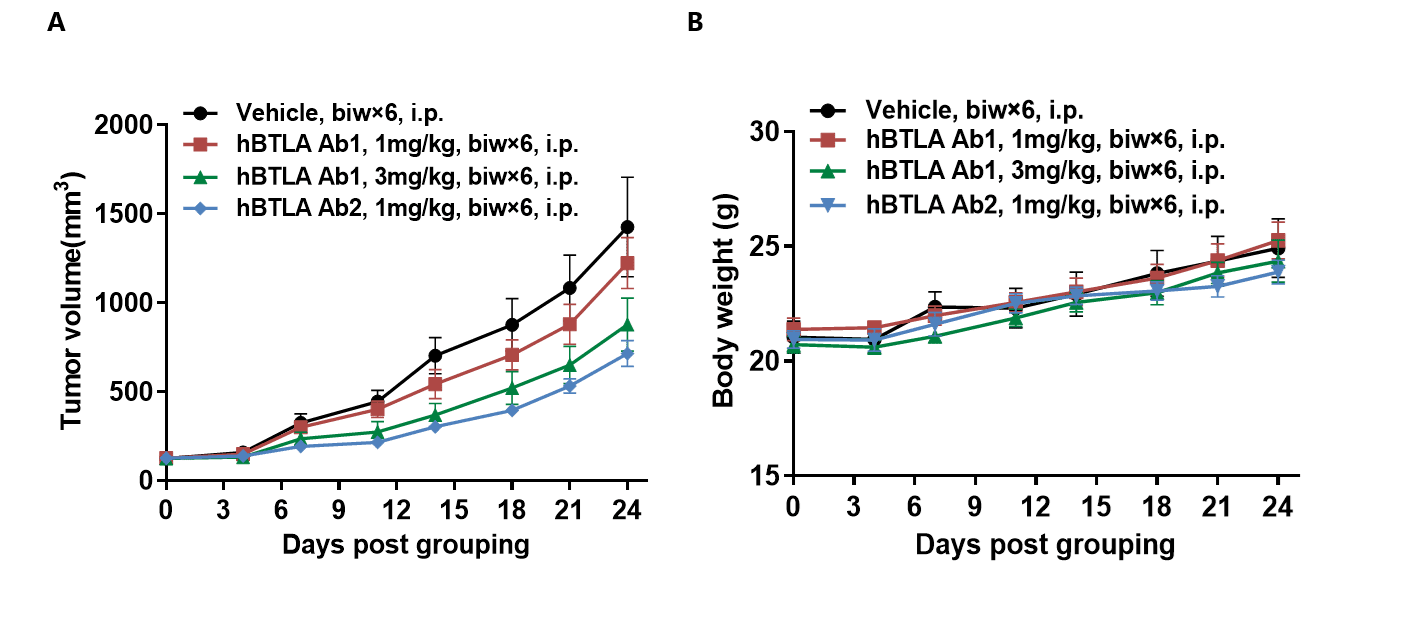
Anti-tumor activity of anti-human BTLA antibodies in B-hBTLA mice. (A) Anti-human BTLA antibodies inhibited MC38 tumor growth in B-hBTLA mice. Murine colon cancer MC38 cells were subcutaneously implanted into homozygous B-hBTLA mice (female, 6-7 week-old, n=5). Mice were grouped when tumor volume reached approximately 100 mm3, at which time they were treated with two anti-human BTLA antibodies with doses and schedules indicated in panel A. (B) Body weight changes during treatment. As shown in panel A, anti-human BTLA antibodies were efficacious in controlling tumor growth in B-hBTLA mice, demonstrating that the B-hBTLA mice provide a powerful preclinical model for in vivo evaluation of anti-human BTLA antibodies. Values are expressed as mean ± SEM.
-
In Vivo Efficacy of Anti-Human BTLA Antibodies
-
 Anti-tumor activity of anti-human BTLA antibodies in B-hBTLA mice. B-hHVEM MC38 cells were inoculated into the right subcutaneous tissue of the humanized female B-hBTLA mice at 1×10⁶ cells/0.1 mL, and when tumors grew to approximately 118 mm3, the mice were randomly grouped, by tumor volume, into 5 groups ( 8 mice per group ). All groups were subjected to administration by intraperitoneal injection twice a week for 7 consecutive times, and the experiment ended 4 days after the last administration. Compared with the body weight of mice in the KLH negative control group , the body weight of the mice in each dosing group had no significant change 21 days after the administration (Fig.12), indicating that the experimental animals have good tolerance to the samples.
Compared with the KLH negative control group, the other dosing groups had the TGITV% of 33.7% , 56.4% and 48.0%, respectively, and P values of 0.175, 0.046 and 0.056, respectively (Fig.11), indicating that the test drug hu18 has a certain inhibitory effect on tumor growth at a dose level of 3 mg/kg. This data comes from the client’s patent US20210246209A1.
-
References
-
1. J Immunol. 2005 Mar 15;174(6):3377-85.
2. Graefes Arch Clin Exp Ophthalmol. 2012 Feb;250(2):289-95. doi: 10.1007/s00417-011-1695-8. Epub 2011 Jul 22.
3. J Leukoc Biol. 2010 Feb;87(2):223-35. doi: 10.1189/jlb.0809590. Epub 2009
Dec 9.
