
Basic Information
-
Targeting strategy

-
Gene targeting strategy for B-hCD3E/hCD20 mice.
The exons 2-6 of mouse Cd3e gene that encode the extracellular domain were replaced by human CD3E exons 2-7 in B-hCD3E/hCD20 mice. The exons 2-7 of mouse Cd20 gene that encode the full-length protein were replaced by human CD20 exons 2-7 in B-hCD3E/hCD20 mice.
-
Protein expression analysis
-
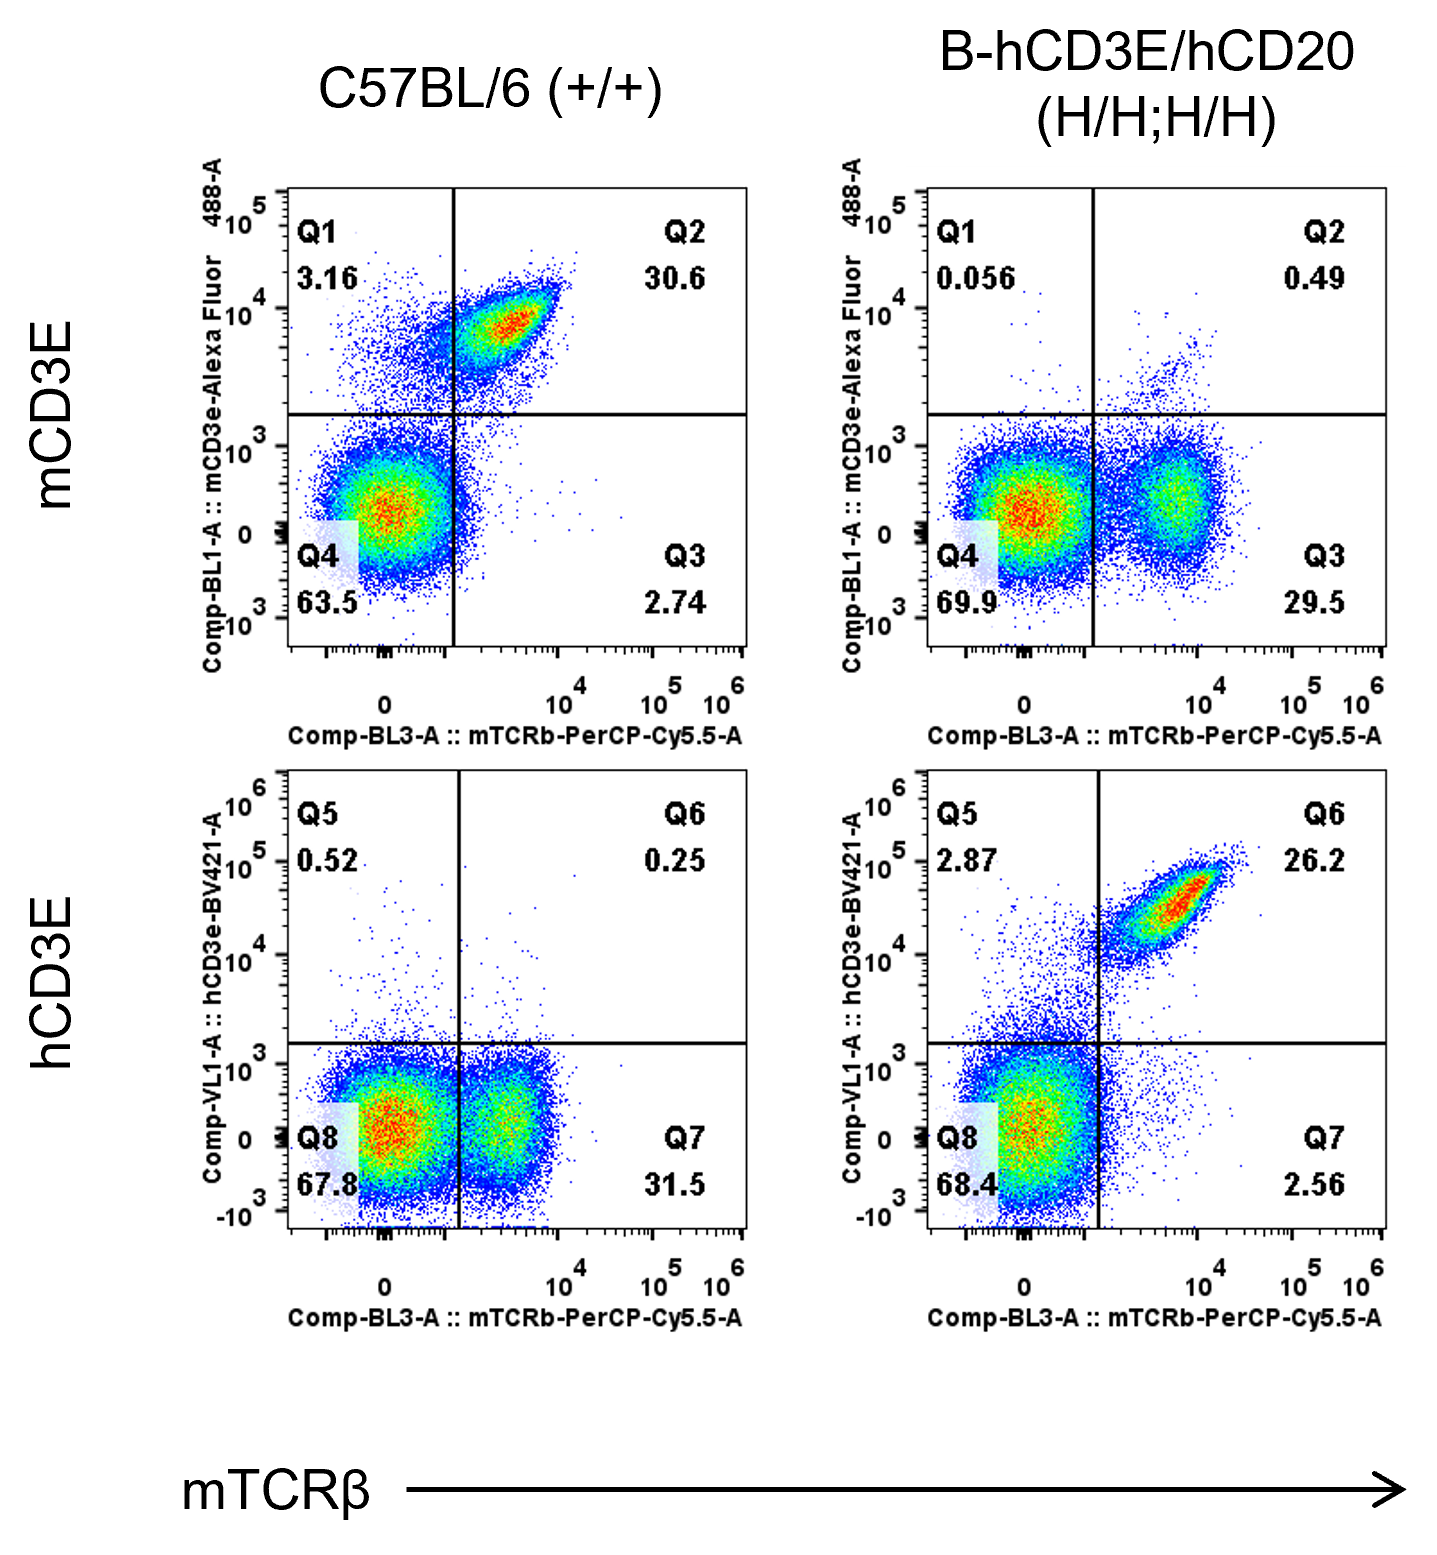
Strain specific CD3E expression analysis in homozygous B-hCD3E/hCD20 mice by flow cytometry.
Splenocytes were collected from wild type (WT) mice (+/+) and homozygous B-hCD3E/hCD20 mice (H/H), and analyzed by flow cytometry with species-specific anti-CD3E antibody. Mouse CD3E was detectable in WT mice (+/+). Human CD3E was exclusively detectable in homozygous B-hCD3E/hCD20 mice (H/H) but not in WT mice (+/+).
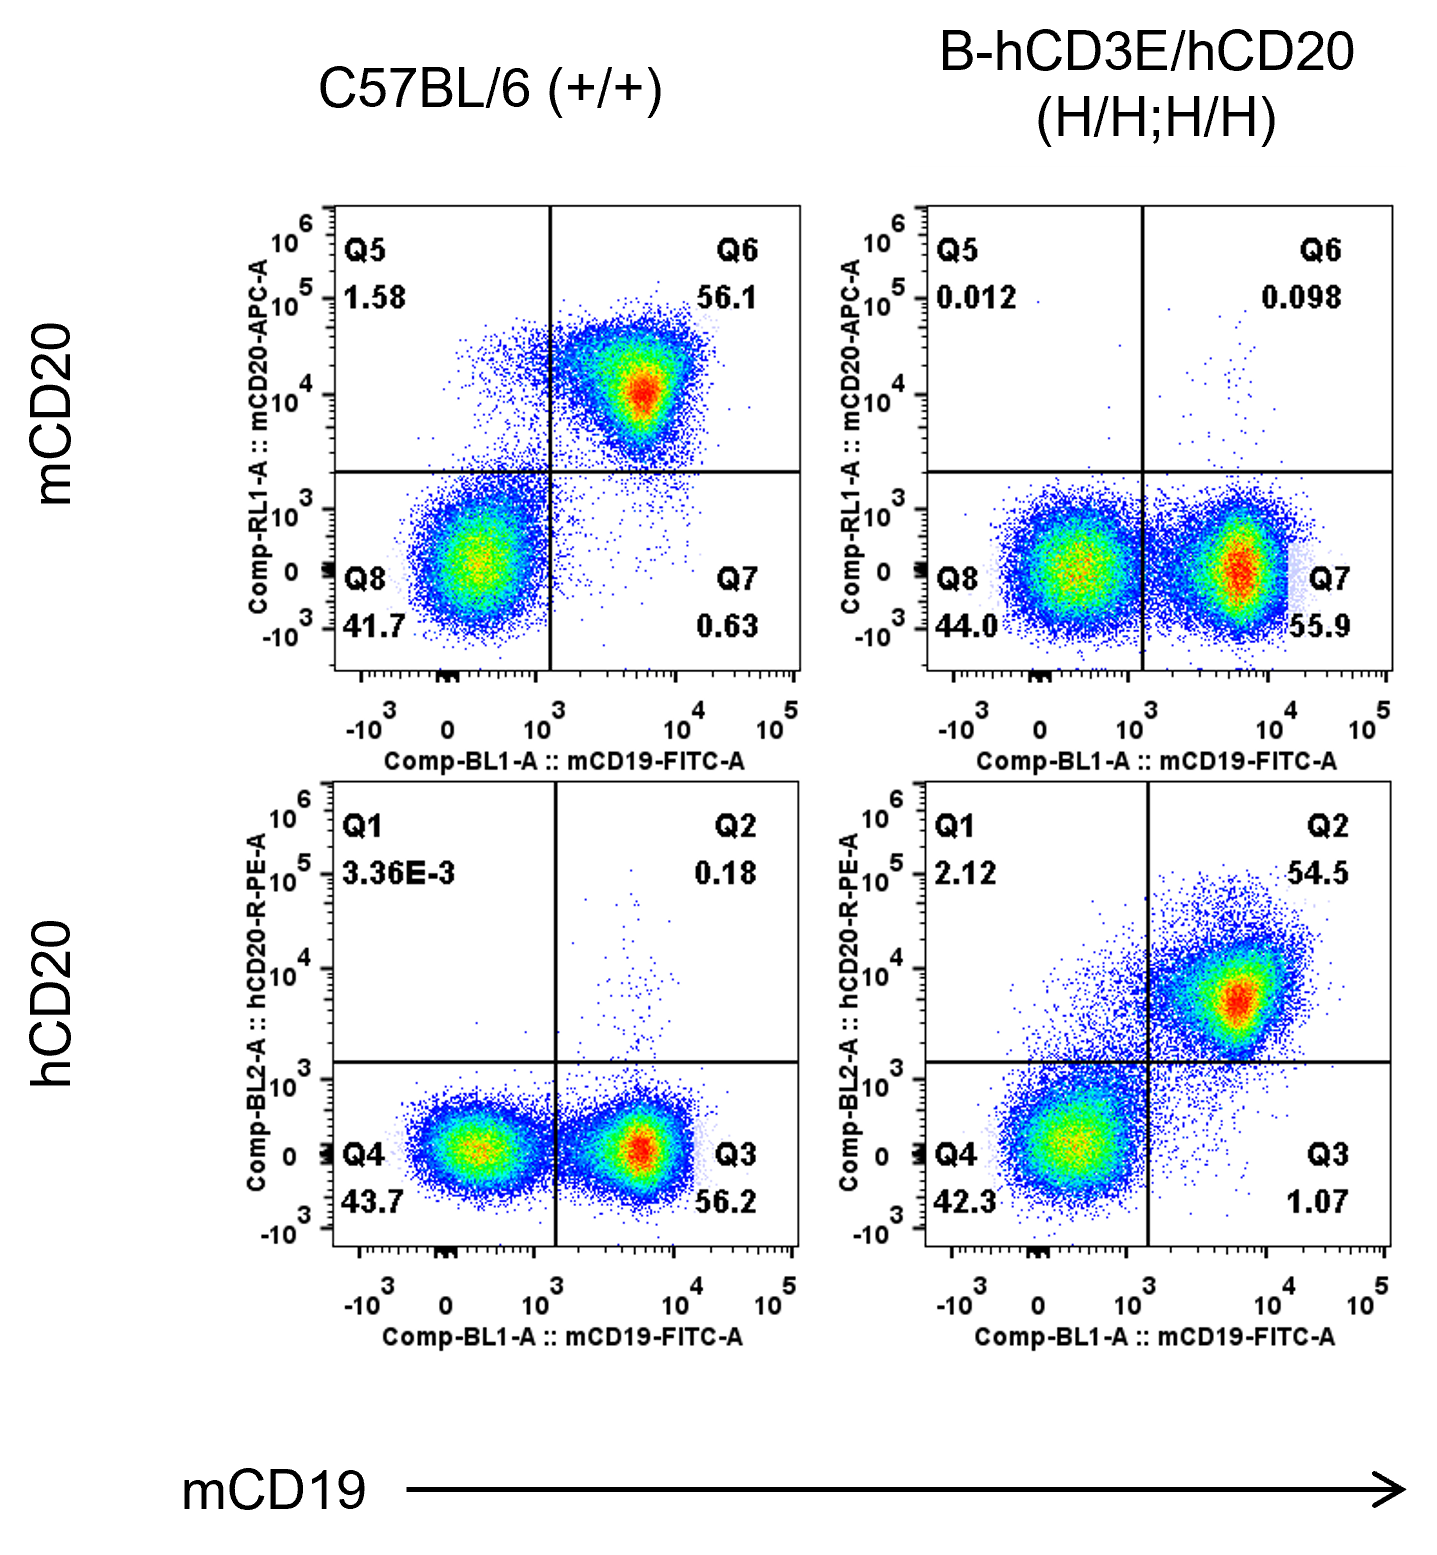
Strain specific hCD20 expression analysis in homozygous B-hCD3E/hCD20 mice by flow cytometry.
Splenocytes were collected from wild type (WT) mice (+/+) and homozygous B-hCD3E/hCD20 mice (H/H), and analyzed by flow cytometry with species-specific anti-CD20 antibody. Mouse CD20 was detectable in WT mice (+/+). Human CD20 was exclusively detectable in homozygous B-hCD3E/hCD20 mice (H/H) but not in WT mice (+/+).
-
Analysis of spleen leukocytes cell subpopulations in B-hCD3E/hCD20 mice
-
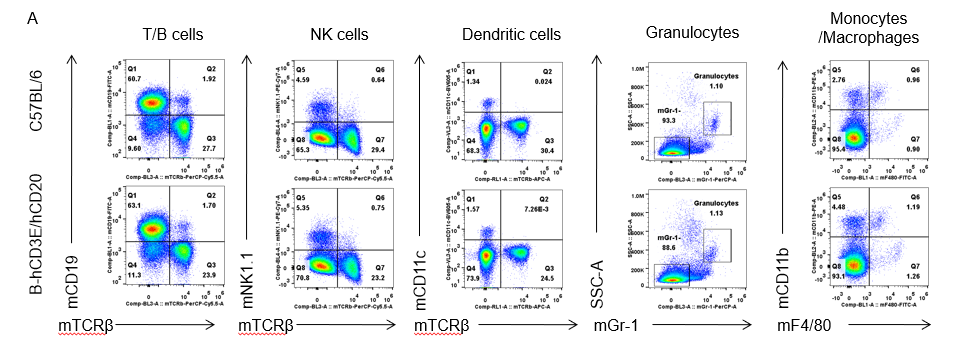
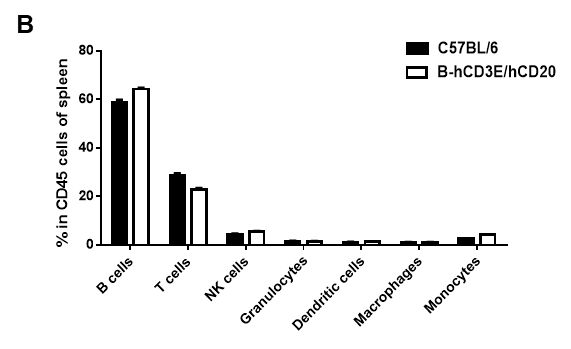
Analysis of spleen leukocyte subpopulations by FACS.
Splenocytes were isolated from female C57BL/6 and B-hCD3E/hCD20 mice (n=3, 6 week-old). Flow cytometry analysis of the splenocytes was performed to assess leukocyte subpopulations. A. Representative FACS plots. Single live cells were gated for CD45 population and used for further analysis as indicated here. B. Results of FACS analysis. Percent of T cells, B cells, NK cells, dendritic cells, granulocytes, monocytes and macrophages in homozygous B-hCD3E/hCD20 mice were similar to those in the C57BL/6 mice, demonstrating that introduction of hCD3E/hCD20 in place of its mouse counterpart does not change the overall development, differentiation or distribution of these cell types in spleen.
-
Analysis of spleen T cell subpopulations in B-hCD3E/hCD20 mice
-
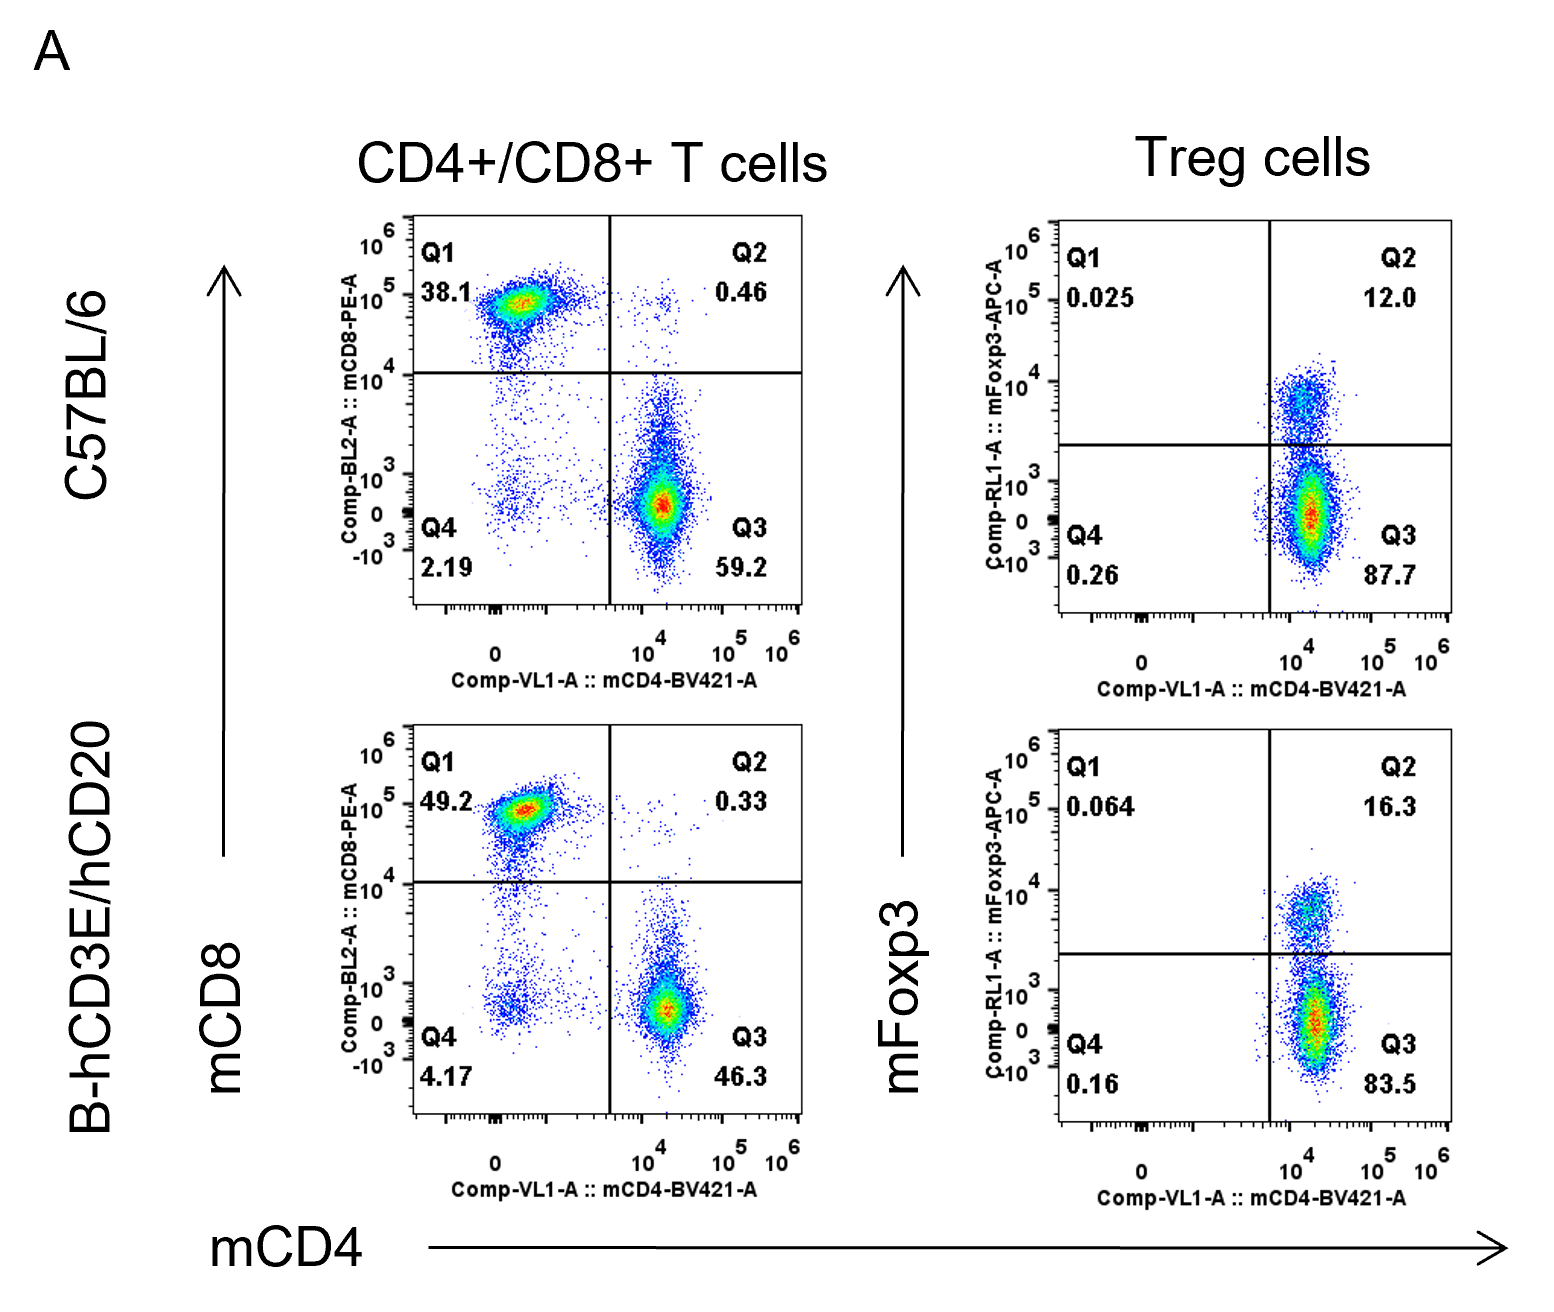
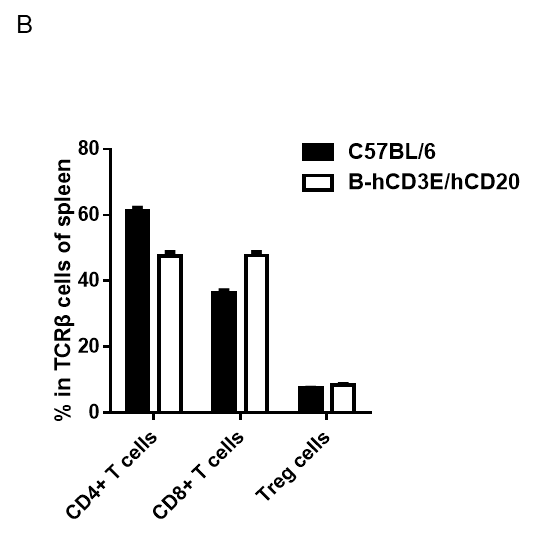
Analysis of spleen T cell subpopulations by FACS.
Splenocytes were isolated from female C57BL/6 and B-hCD3E/hCD20 mice (n=3, 6 week-old). Flow cytometry analysis of the splenocytes was performed to assess leukocyte subpopulations. A. Representative FACS plots. Single live CD45+ cells were gated for CD3 T cell population and used for further analysis as indicated here. B. Results of FACS analysis. Percent of CD8+ T cells, CD4+ T cells, and Treg cells in homozygous B-hCD3E/hCD20 mice were similar to those in the C57BL/6 mice, demonstrating that introduction of hCD3E/hCD20 in place of its mouse counterpart does not change the overall development, differentiation or distribution of these T cell sub types in spleen. Values are expressed as mean ± SEM.
-
Analysis of lymph node leukocytes cell subpopulations in B-hCD3E/hCD20 mice
-
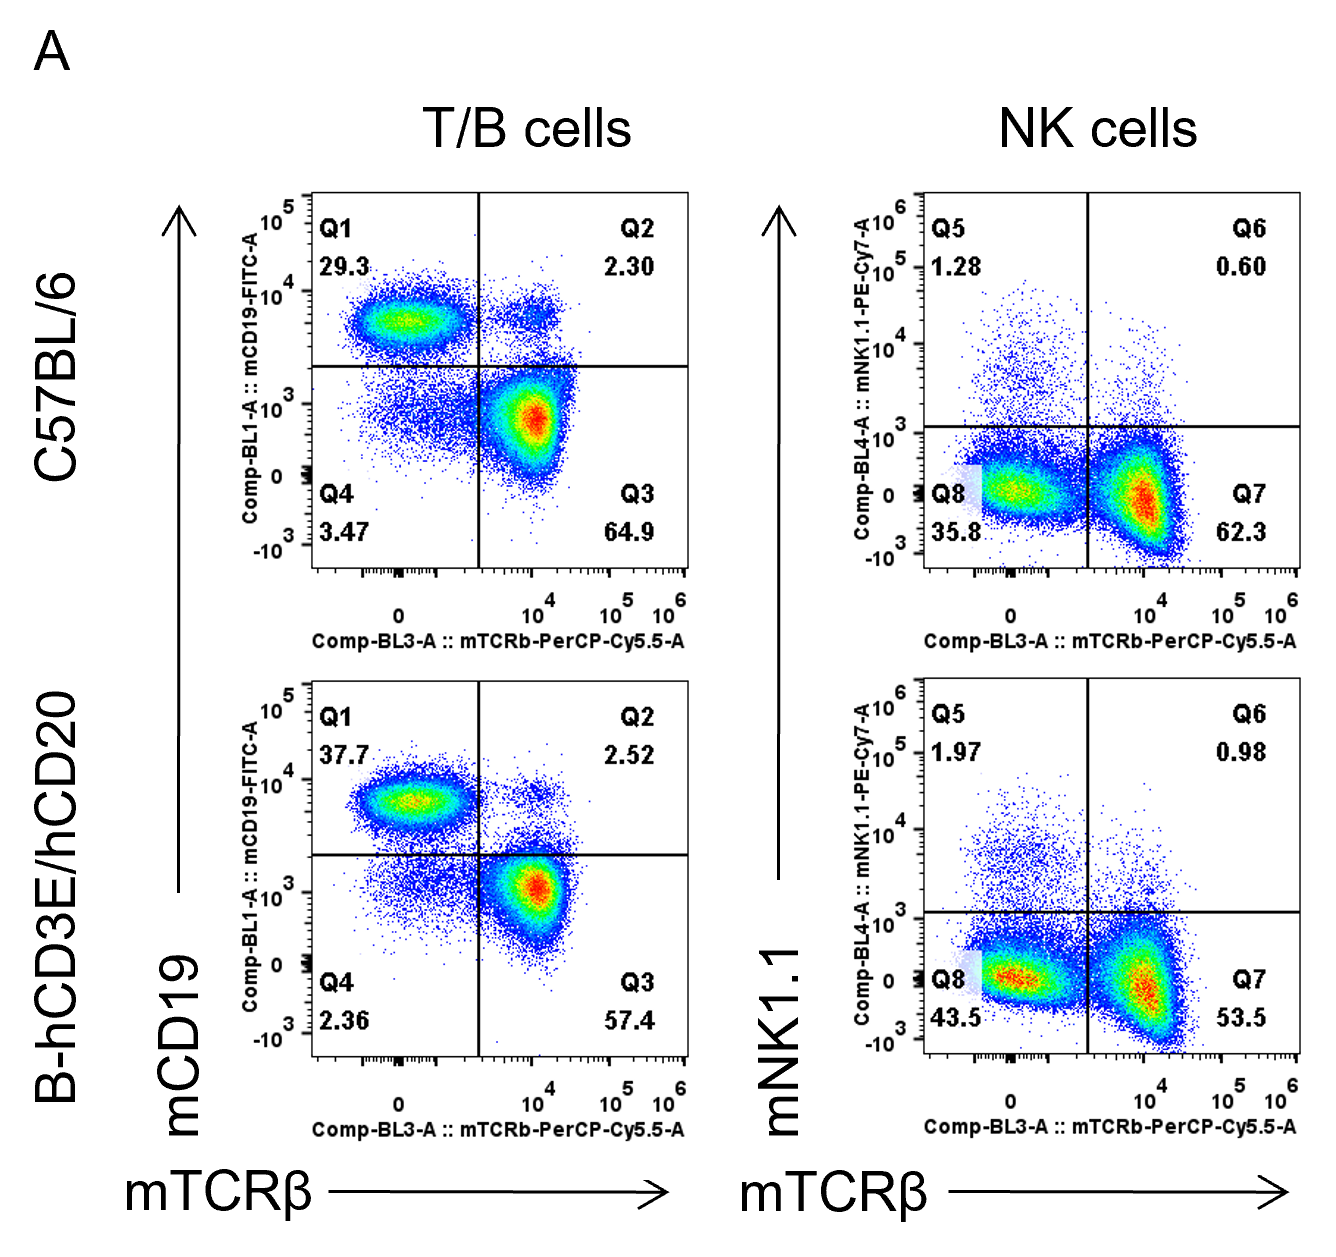
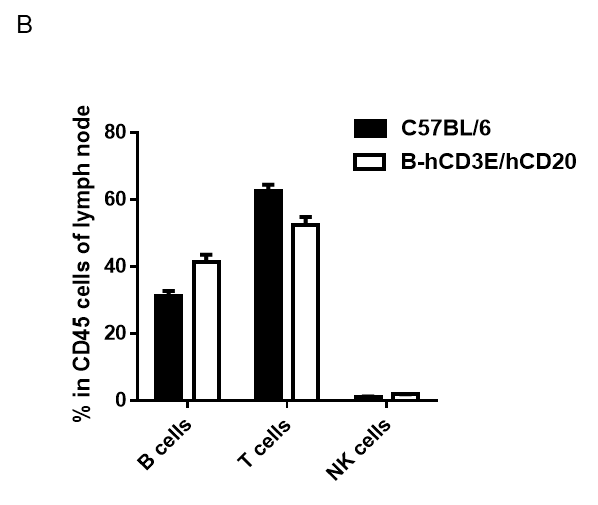
Analysis of lymph node leukocyte subpopulations by FACS.
Leukocytes were isolated from female C57BL/6 and B-hCD3E/hCD20 mice (n=3, 6 week-old). Flow cytometry analysis of the leukocytes was performed to assess leukocyte subpopulations. A. Representative FACS plots. Single live cells were gated for CD45 population and used for further analysis as indicated here. B. Results of FACS analysis. Percent of T cells, B cells, NK cells in homozygous B-hCD3E/hCD20 mice were similar to those in the C57BL/6 mice, demonstrating that introduction of hCD3E/hCD20 in place of its mouse counterpart does not change the overall development, differentiation or distribution of these cell types in lymph node
-
Analysis of lymph node T cell subpopulations in B-hCD3E/hCD20 mice
-
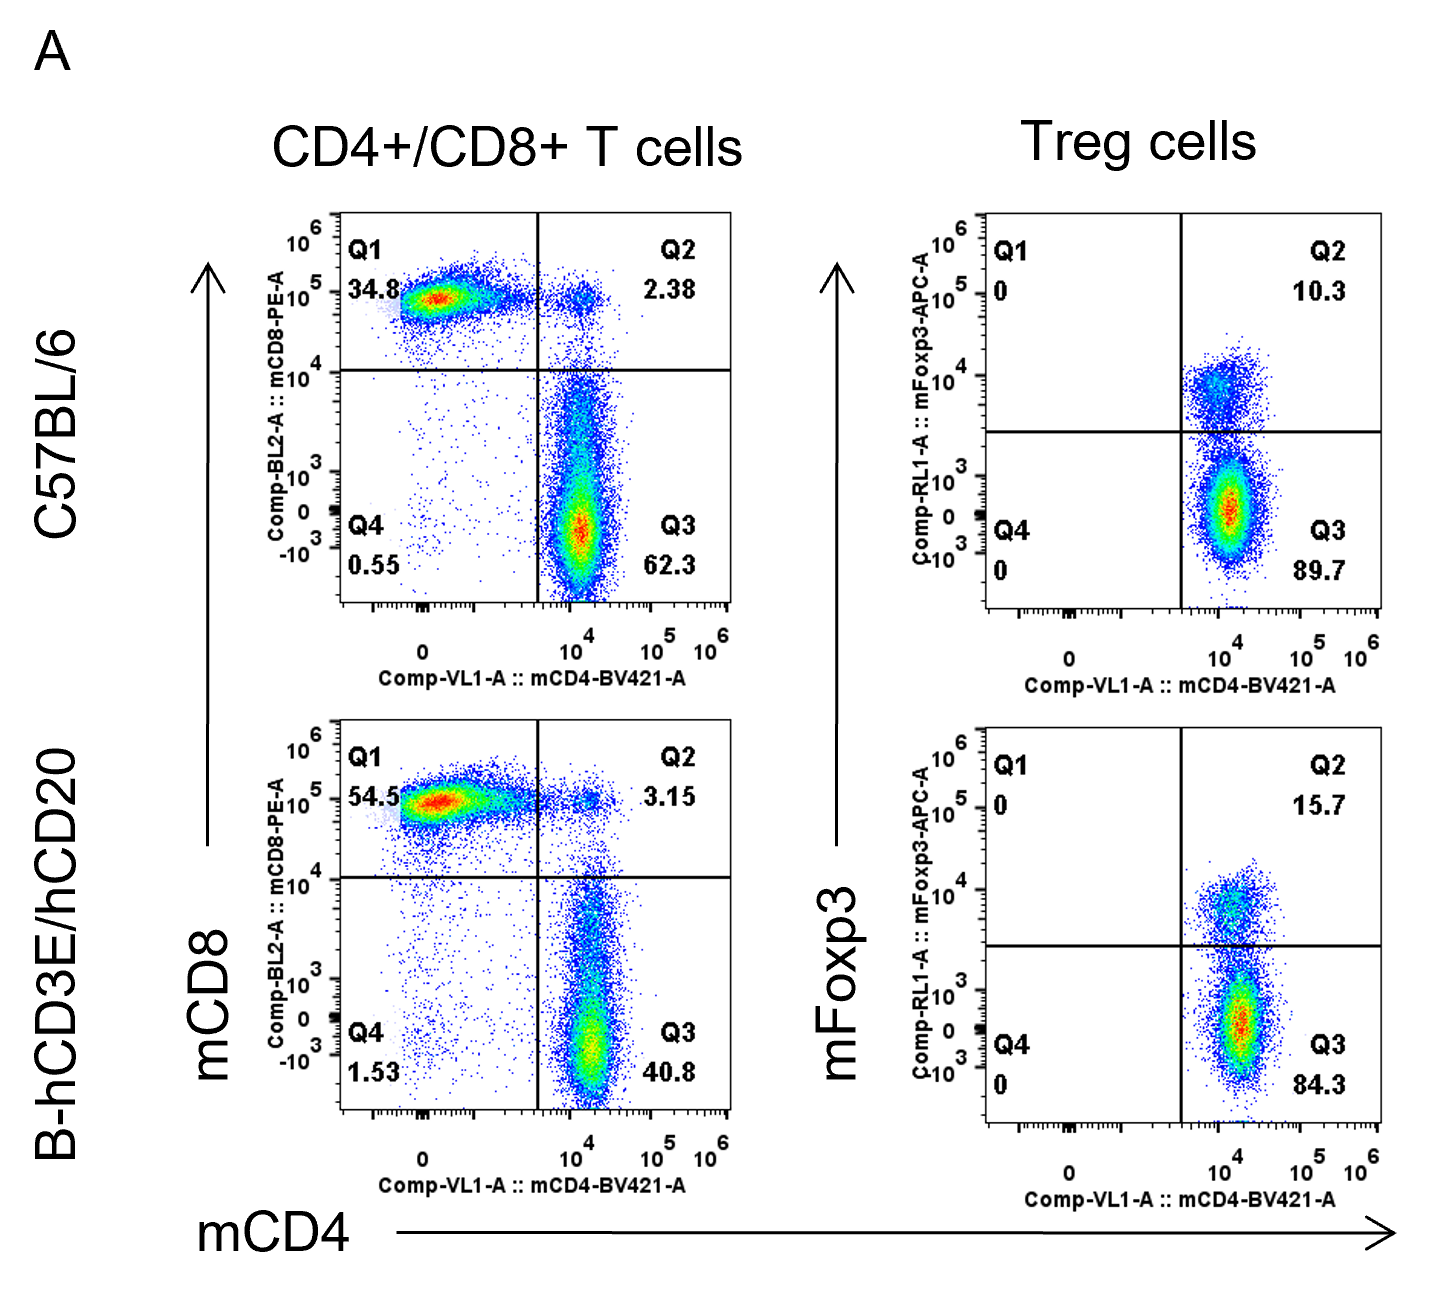
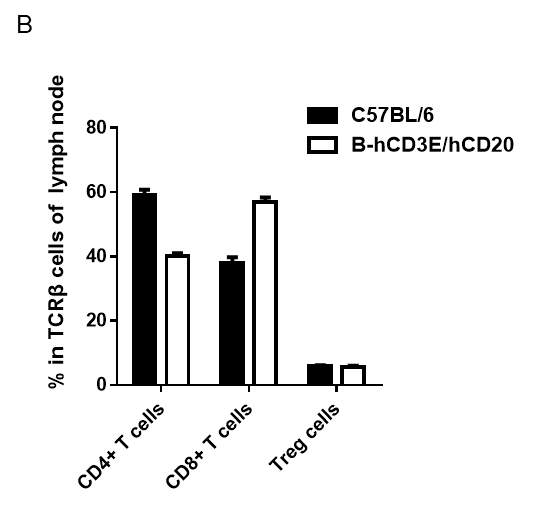
Analysis of lymph node T cell subpopulations by FACS.
Leukocytes were isolated from female C57BL/6 and B-hCD3E/hCD20 mice (n=3, 6 week-old). Flow cytometry analysis of the leukocytes was performed to assess leukocyte subpopulations. A. Representative FACS plots. Single live CD45+ cells were gated for CD3 T cell population and used for further analysis as indicated here. B. Results of FACS analysis. Percent of CD8+ T cells, CD4+ T cells, and Treg cells in homozygous B-hCD3E/hCD20 mice were similar to those in the C57BL/6 mice, demonstrating that introduction of hCD3E/hCD20 in place of its mouse counterpart does not change the overall development, differentiation or distribution of these T cell sub types in lymph node. Values are expressed as mean ± SEM.
-
Analysis of blood leukocytes cell subpopulations in B-hCD3E/hCD20 mice
-
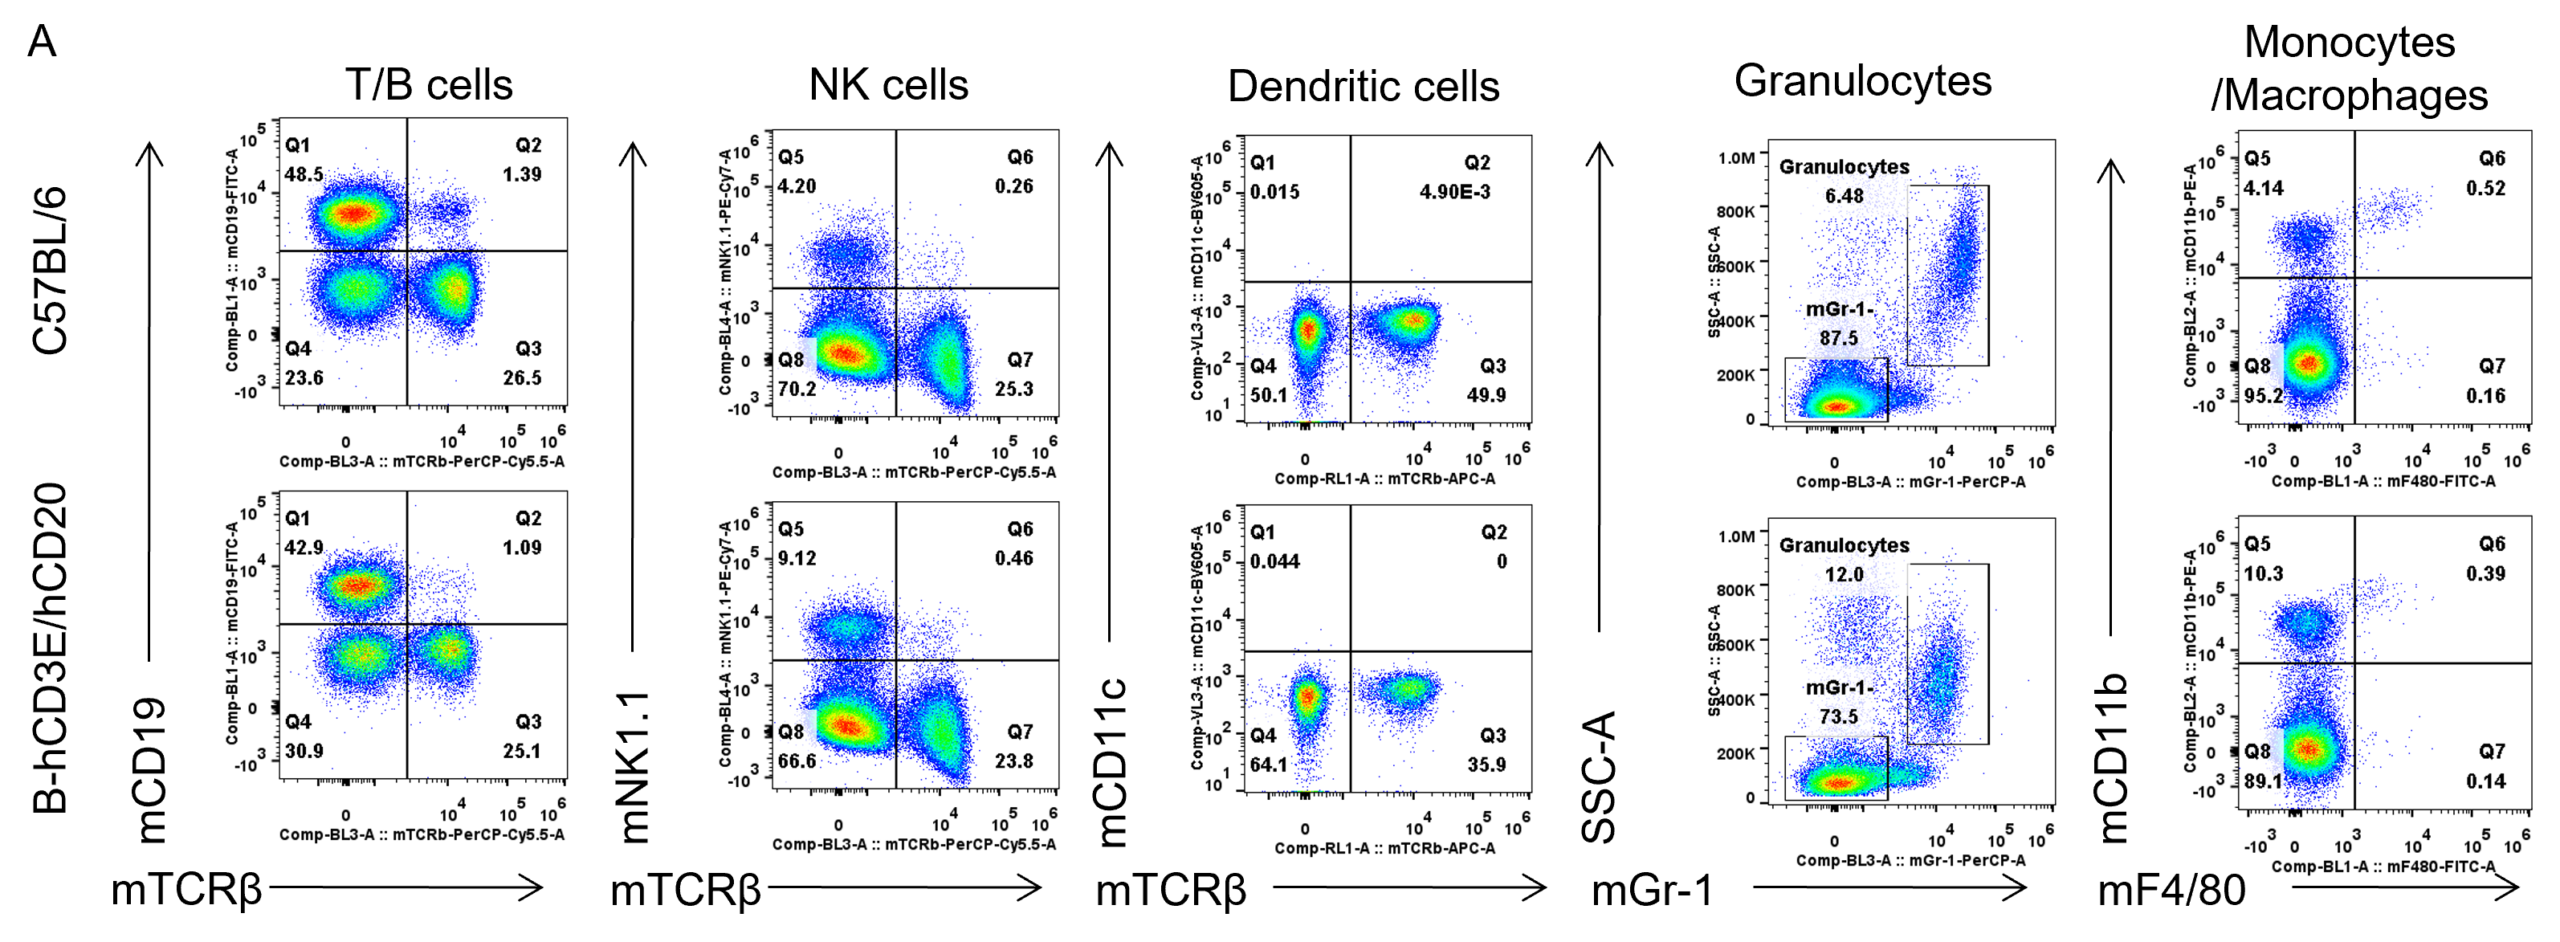
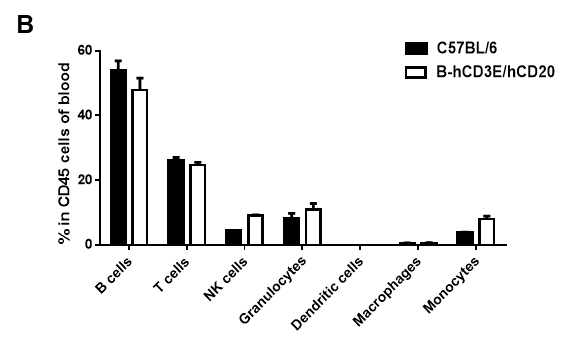
Analysis of blood leukocyte subpopulations by FACS.
Blood cells were isolated from female C57BL/6 and B-hCD3E/hCD20 mice (n=3, 6 week-old). Flow cytometry analysis of the splenocytes was performed to assess leukocyte subpopulations. A. Representative FACS plots. Single live cells were gated for CD45 population and used for further analysis as indicated here. B. Results of FACS analysis. Percent of T cells, B cells, NK cells, dendritic cells, granulocytes, monocytes and macrophages in homozygous B-hCD3E/hCD20 mice were similar to those in the C57BL/6 mice, demonstrating that introduction of hCD3E/hCD20 in place of its mouse counterpart does not change the overall development, differentiation or distribution of these cell types in blood.
-
Analysis of blood T cell subpopulations in B-hCD3E/hCD20 mice
-
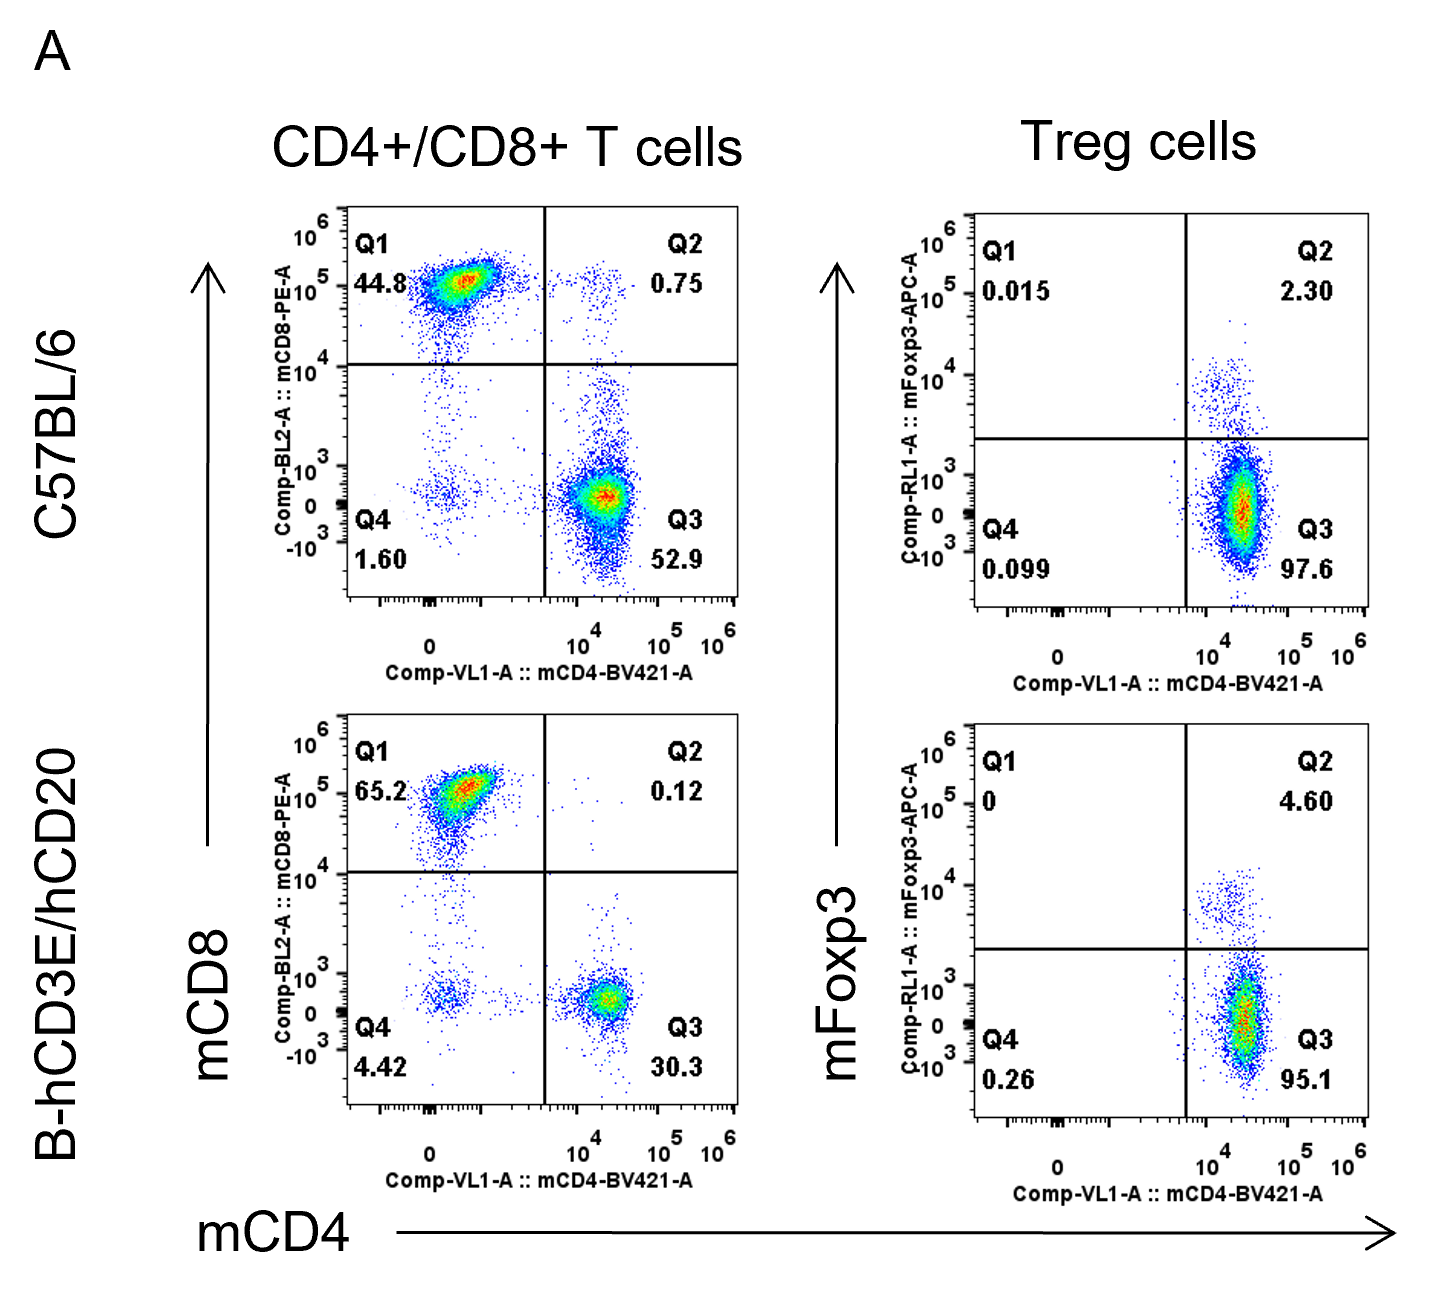
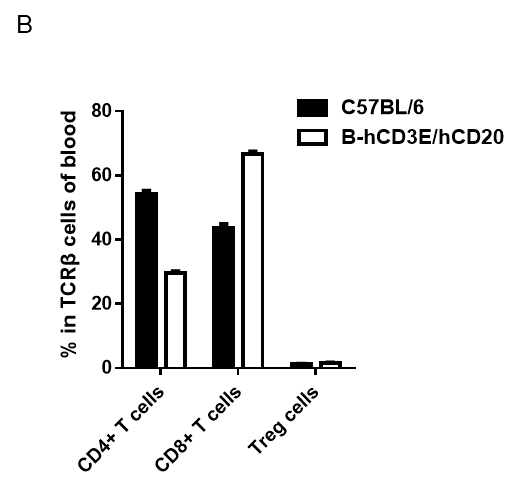
Analysis of blood T cell subpopulations by FACS.
Blood cells were isolated from female C57BL/6 and B-hCD3E/hCD20 mice (n=3, 6 week-old). Flow cytometry analysis of the leukocytes was performed to assess leukocyte subpopulations. A. Representative FACS plots. Single live CD45+ cells were gated for CD3 T cell population and used for further analysis as indicated here. B. Results of FACS analysis. Percent of CD8+ T cells, CD4+ T cells, and Treg cells in homozygous B-hCD3E/hCD20 mice were similar to those in the C57BL/6 mice, demonstrating that introduction of hCD3E/hCD20 in place of its mouse counterpart does not change the overall development, differentiation or distribution of these T cell sub types in blood. Values are expressed as mean ± SEM.
-
Analysis of thymus T cell subpopulations in B-hCD3E/hCD20 mice
-
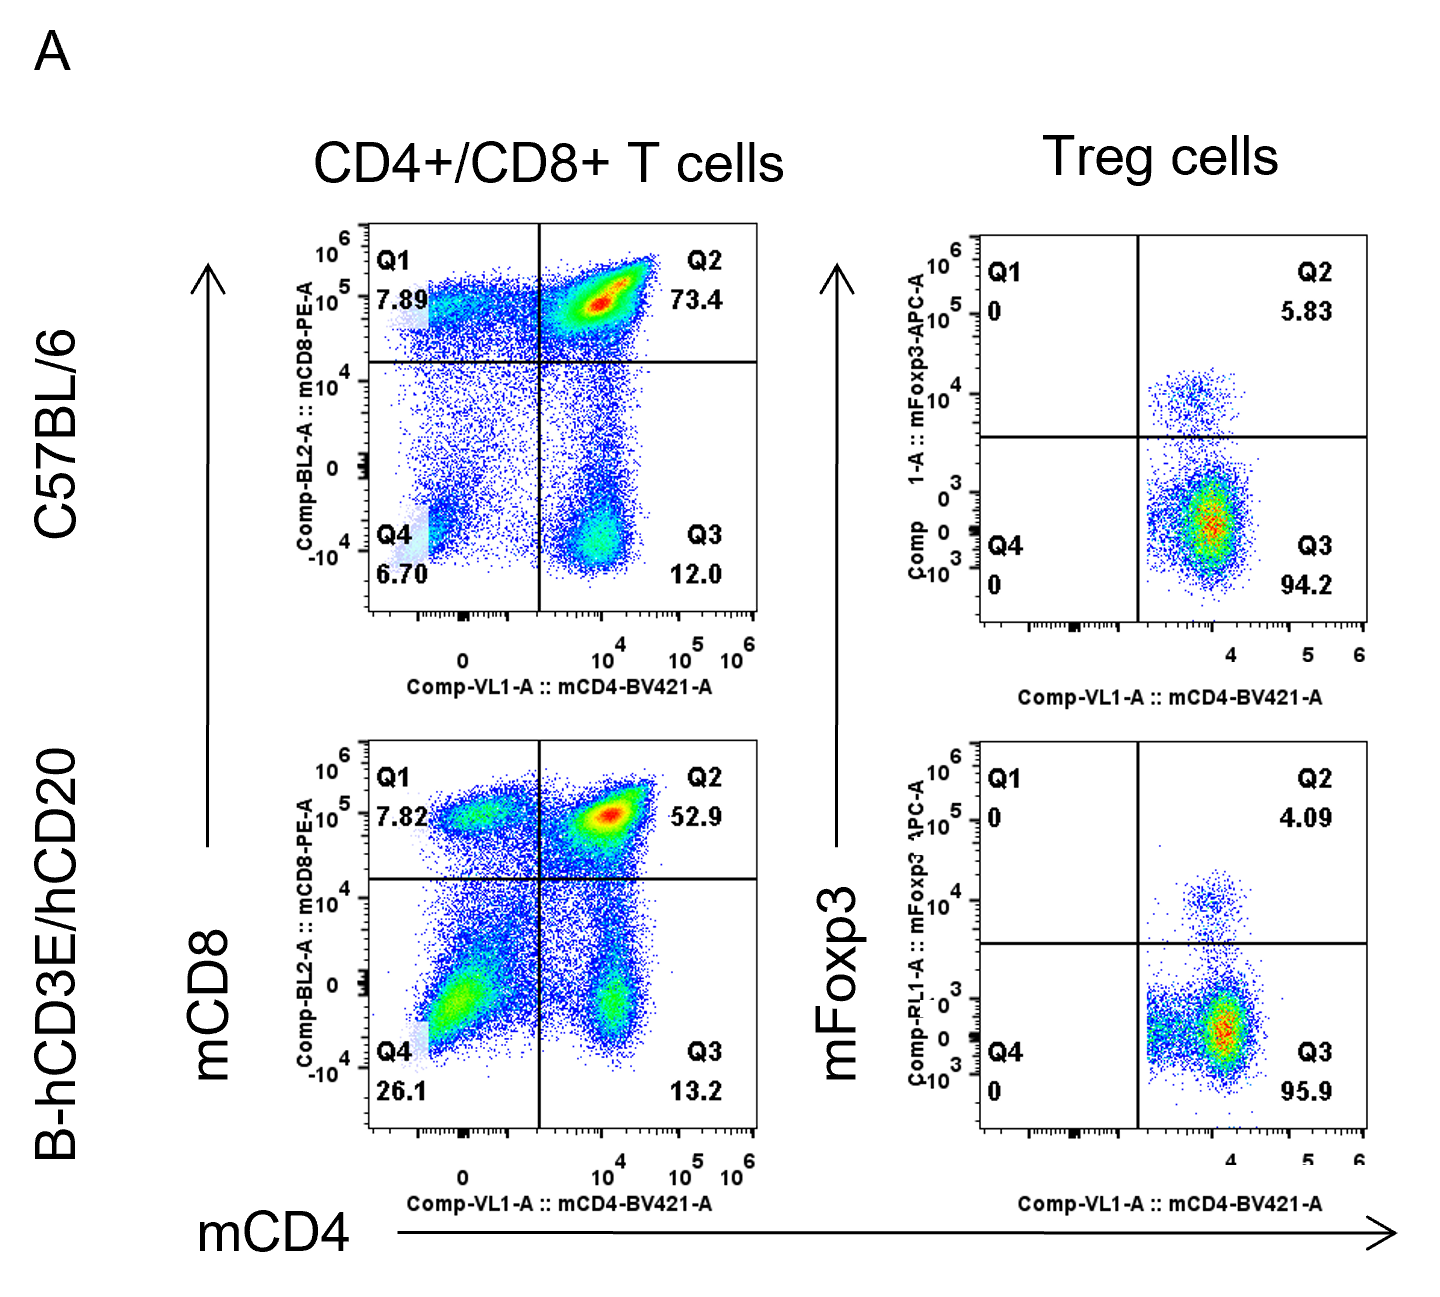
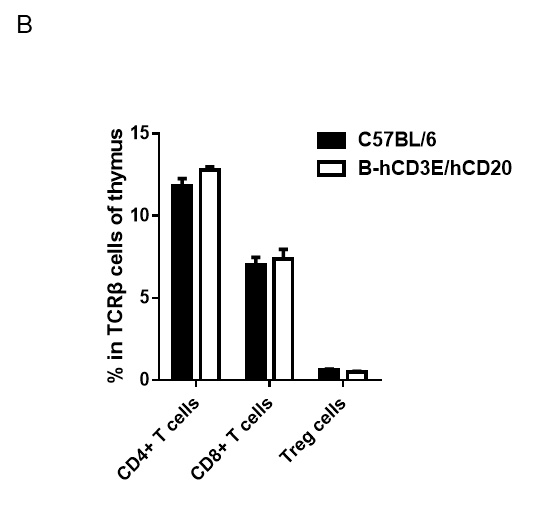
Analysis of thymus T cell subpopulations by FACS.
Thymocytes were isolated from female C57BL/6 and B-hCD3E/hCD20 mice (n=3, 6 week-old). Flow cytometry analysis of the thymocytes was performed to assess leukocyte subpopulations. A. Representative FACS plots. Single live CD45+ cells were gated for CD3 T cell population and used for further analysis as indicated here. B. Results of FACS analysis. Percent of CD8+ T cells, CD4+ T cells, and Treg cells in homozygous B-hCD3E/hCD20 mice were similar to those in the C57BL/6 mice, demonstrating that introduction of hCD3E/hCD20 in place of its mouse counterpart does not change the overall development, differentiation or distribution of these T cell sub types in thymus. Values are expressed as mean ± SEM. DN: double negative. DP: double positive.
