
Basic Information
-
Targeting Strategy

-
Gene targeting strategy for B-hPD-1/h4-1BB mice. The exons 2-7 of mouse 4-1BB gene that encode the extracellular domain were replaced by human 4-1BB exons 2-7 in B-hPD-1/h4-1BB mice. The exon 2 of mouse PD-1 gene that encode the IgV domain were replaced by human PD-1 exon 2 in B-hPD-1/h4-1BB mice.
-
Details
-
Phenotype
mRNA Expression Analysis
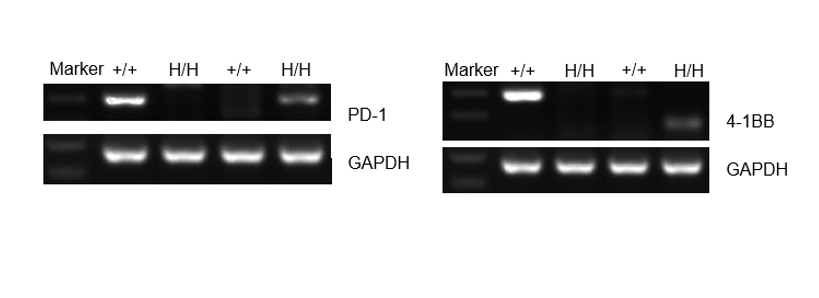
Strain specific analysis of 4-1BB and PD-1 gene expression in B-hPD-1/h4-1BB mice by RT-PCR. Mouse 4-1BB and PD-1 mRNA was detectable in splenocytes of wild-type (+/+) mice. Human 4-1BB and PD-1 mRNA was detectable only in H/H but not in +/+ mice.
Protein Expression Analysis
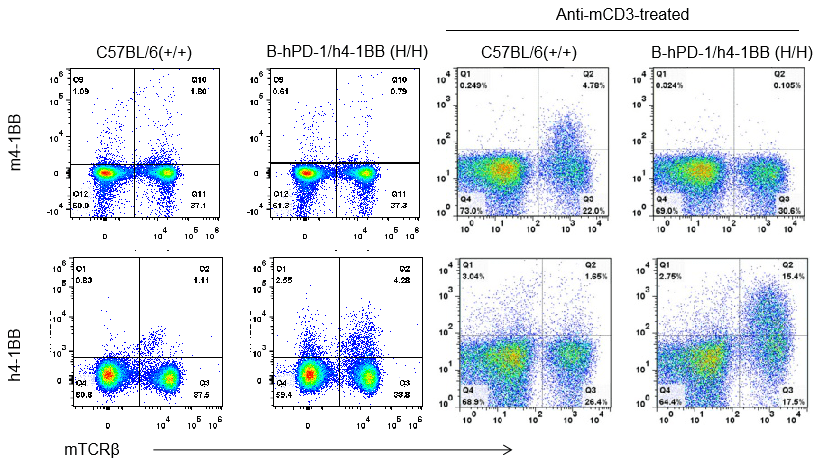
Strain specific 4-1BB expression analysis in homozygous B-hPD-1/h4-1BB mice by flow cytometry. Splenocytes were collected from WT and homozygous B-hPD-1/h4-1BB (H/H) mice stimulated with or without anti-CD3ε in vivo, and analyzed by flow cytometry with species-specific anti-4-1BB antibody. Mouse 4-1BB was detectable in WT mice. Human 4-1BB was exclusively detectable in homozygous B-hPD-1/h4-1BB but not WT mice.
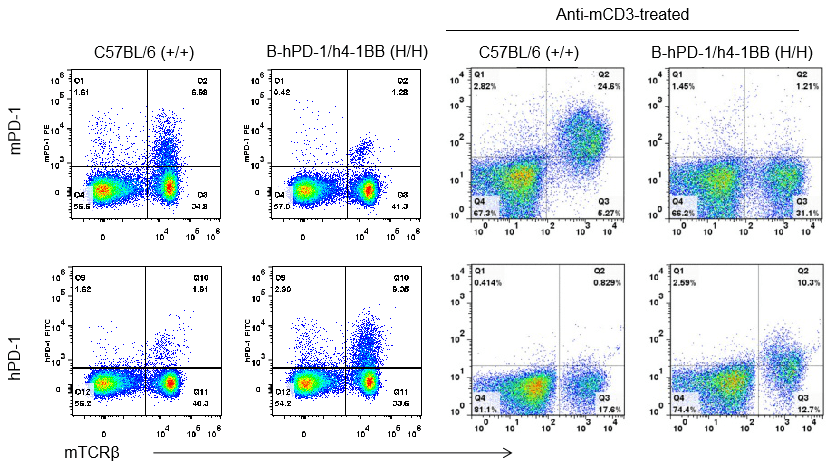
Strain specific PD-1 expression analysis in homozygous B-hPD-1/h4-1BB mice by flow cytometry. Splenocytes were collected from WT and homozygous B-hPD-1/h4-1BB (H/H) mice stimulated with or without anti-CD3ε in vivo, and analyzed by flow cytometry with species-specific anti-PD-1 antibody. Mouse PD-1was detectable in WT mice. Human PD-1 was exclusively detectable in homozygous B-hPD-1/h4-1BB but not WT mice.
Analysis of spleen leukocytes cell subpopulations in B-hPD-1/h4-1BB mice
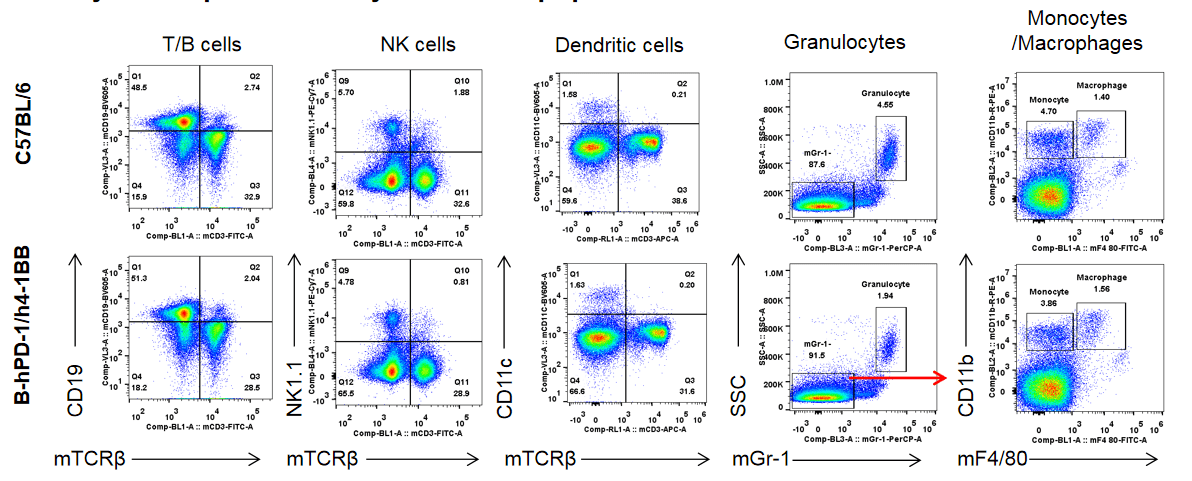
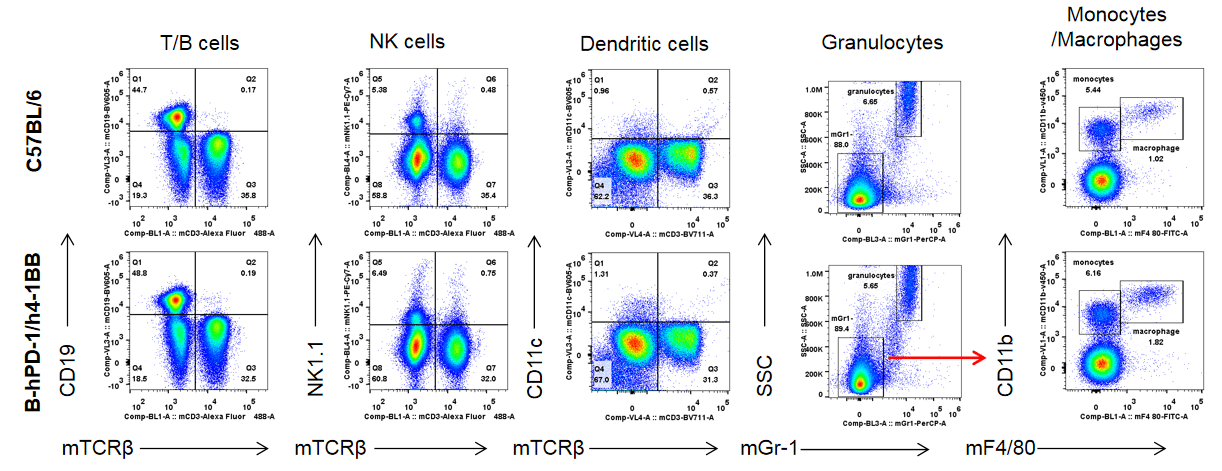
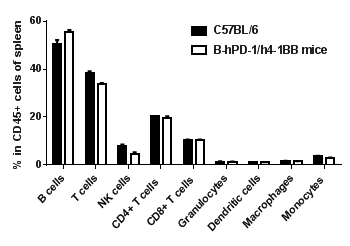 Analysis of spleen leukocyte subpopulations by FACS.Splenocytes were isolated from female C57BL/6 and B-hPD-1/h4-1BB mice (n=3, 9- week-old). Flow cytometry analysis of the splenocytes was performed to assess leukocyte subpopulations. A. Representative FACS plots. Single live cells were gated for CD45 population and used for further analysis as indicated here. B. Results of FACS analysis. Percent of T, B, NK, Monocyte, DC and macrophage cells in homozygous B-hPD-1/h4-1BB mice were similar to those in the C57BL/6 mice, demonstrating that introduction of hPD-1 and h4-1BB in place of its mouse counterpart does not change the overall development, differentiation or distribution of these cell types in spleen.
Analysis of spleen T cell subpopulations in B-hPD-1/h4-1BB mice
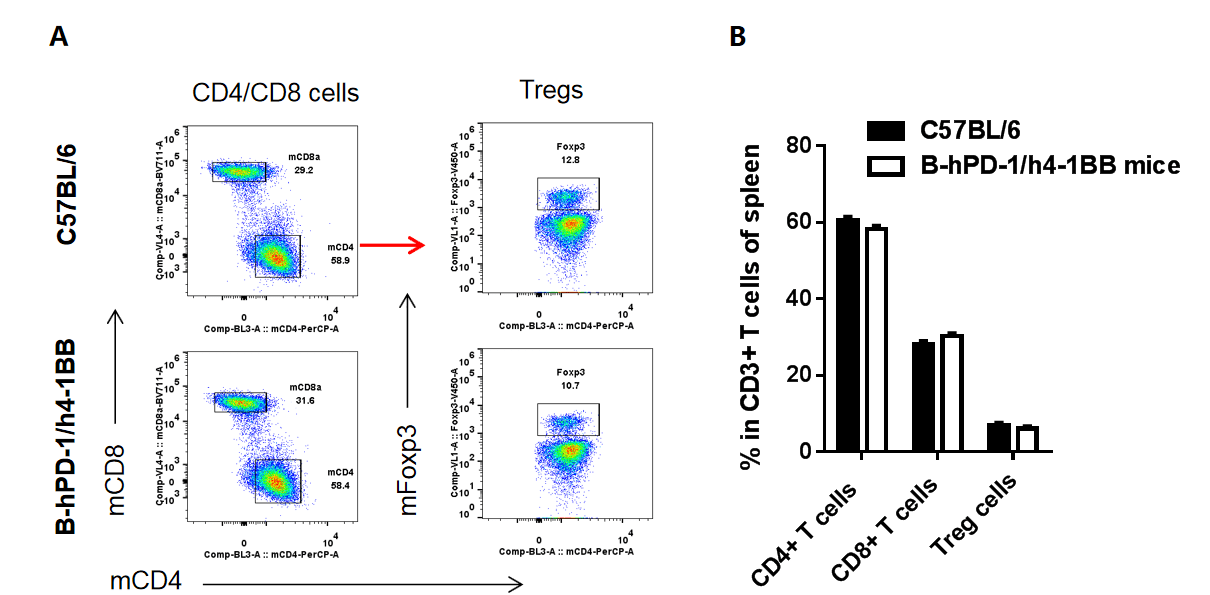
Analysis of spleen T cell subpopulations by FACS.Splenocytes were isolated from female C57BL/6 and B-hPD-1/h4-1BB mice (n=3, 9-week-old). Flow cytometry analysis of the splenocytes was performed to assess leukocyte subpopulations. A. Representative FACS plots. Single live CD45+ cells were gated for CD3 T cell population and used for further analysis as indicated here. B. Results of FACS analysis. Percent of CD8, CD4, and Treg cells in homozygous B-hPD-1/h4-1BB mice were similar to those in the C57BL/6 mice, demonstrating that introduction of hPD-1 and h4-1BB in place of its mouse counterpart does not change the overall development, differentiation or distribution of these T cell sub types in spleen. Values are expressed as mean ± SEM.
Analysis of blood cell subpopulations in B-hPD-1/h4-1BB mice
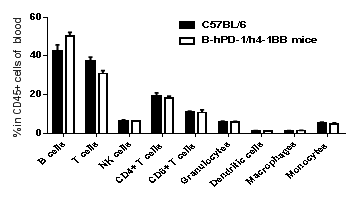 Analysis of blood leukocyte subpopulations by FACS.Blood cells were isolated from female C57BL/6 and B-hPD-1/h4-1BB mice (n=3, 9-week-old). Flow cytometry analysis of the blood cells was performed to assess leukocyte subpopulations. A. Representative FACS plots. Single live cells were gated for CD45 population and used for further analysis as indicated here. B. Results of FACS analysis. Percent of T, B, NK, Monocyte, DC and macrophage cells in homozygous B-hPD-1/h4-1BB mice were similar to those in the C57BL/6 mice, demonstrating that introduction of hPD-1 and h4-1BB in place of its mouse counterpart does not change the overall development, differentiation or distribution of these cell types in blood.
Analysis of blood T cell subpopulations in B-hPD-1/h4-1BB mice
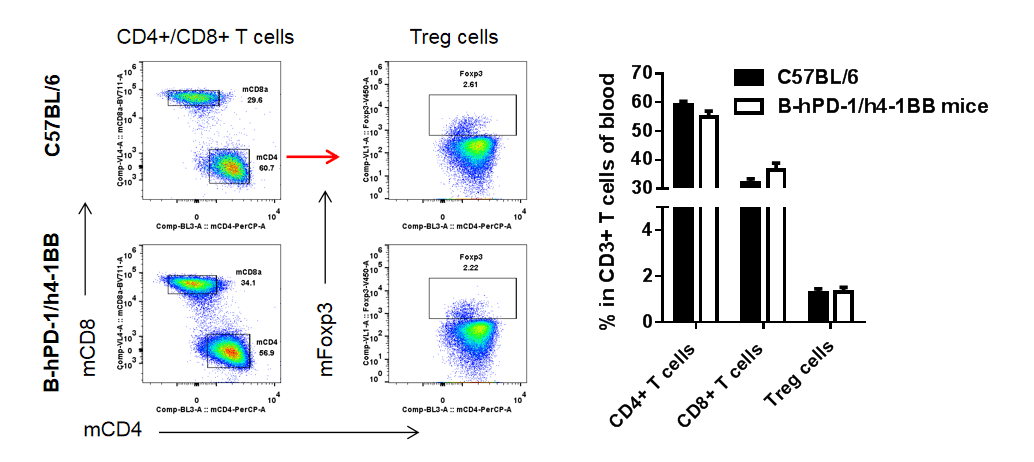 Analysis of blood T cell subpopulations by FACS.Blood cells were isolated from female C57BL/6 and B-hPD-1/h4-1BB mice (n=3, 9-week-old). Flow cytometry analysis of the blood cells was performed to assess blood cell subpopulations. A. Representative FACS plots. Single live CD45+ cells were gated for CD3 T cell population and used for further analysis as indicated here. B. Results of FACS analysis. Percent of CD8, CD4, and Treg cells in homozygous B-hPD-1/h4-1BB mice were similar to those in the C57BL/6 mice, demonstrating that introduction of hPD-1 and h4-1BB in place of its mouse counterpart does not change the overall development, differentiation or distribution of these T cell sub types in blood. Values are expressed as mean ± SEM.
Blood routine test in B-hPD-1/h4-1BB mice
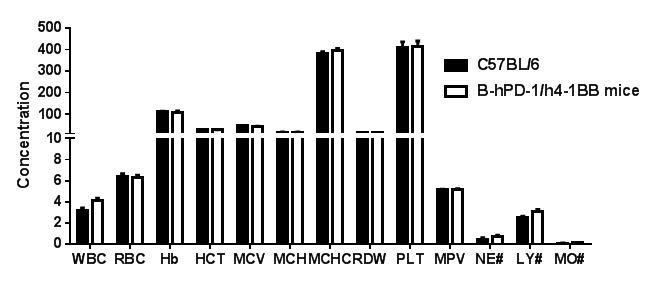 Complete blood count (CBC),Blood from female C57BL/6 and B-hPD-1/h4-1BB mice (n=3, 9-week-old) was analyzed with CBC. There was no differences among any measurement between C57BL/6 and B-hPD-1/h4-1BB mice, indicating that introduction of hPD-1 and h4-1BB in place of its mouse counterpart does not change blood cell composition and morphology. Values are expressed as mean ± SEM.
Blood chemistry of B-hPD-1/h4-1BB mice
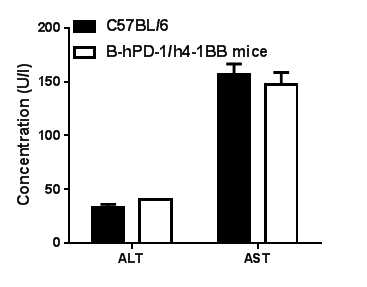 Blood chemistry tests of B-hPD-1/h4-1BB mice. Serum from the C57BL/6 and B-hPD-1/h4-1BB mice (n=3, 9-week-old) was analyzed for levels of ALT (alanine aminotransferase) and AST (aspartate aminotransferase). There was no differences on either measurement between C57BL/6 and B-hPD-1/h4-1BB mice, indicating that introduction of hPD-1 and h4-1BB in place of its mouse counterpart does not change ALT and AST levels or health of liver. Values are expressed as mean ± SEM.
In vivo efficacy of combination of anti-human PD-1 antibody and anti-human 4-1BB antibody
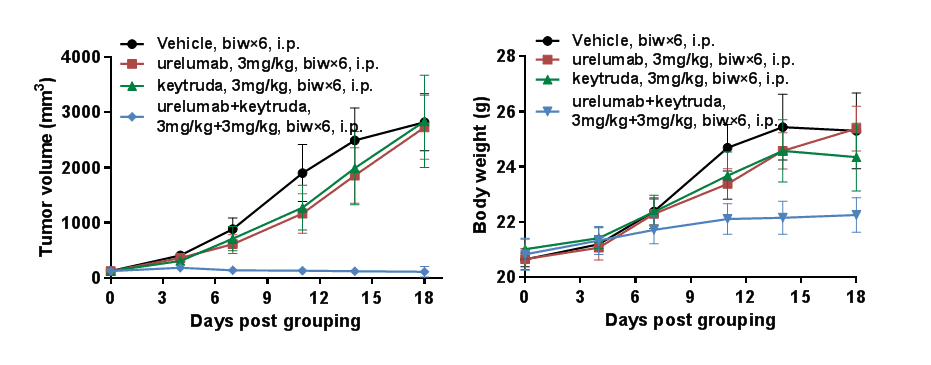
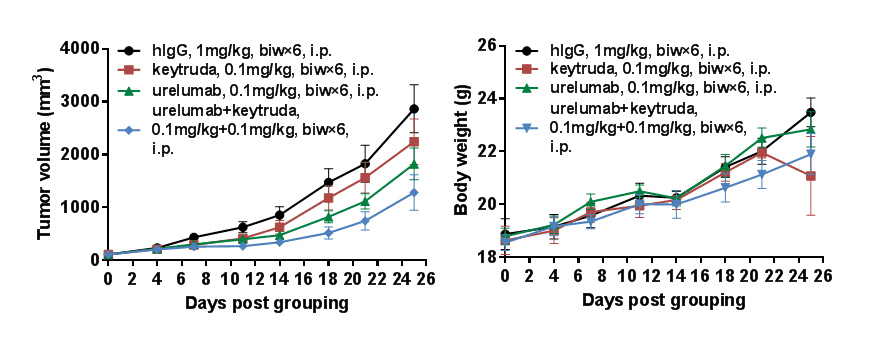 Antitumor activity of combination of anti-human PD-1 antibody and anti-human 4-1BB in B-hPD-1/h4-1BB mice. (A) combination of anti-human PD-1 antibody and anti-human 4-1BB antibody inhibited MC38 tumor growth in B-hPD-1/h4-1BB mice. Murine colon cancer MC38 cells were subcutaneously implanted into homozygous B-hPD-1/h4-1BB mice (female, 6-week-old, n=5). Mice were grouped when tumor volume reached approximately 100 mm3, at which time they were treated with anti-human PD-1 antibody and anti-human 4-1BB antibody with doses and schedules indicated in panel. (B) Body weight changes during treatment. As shown in panel A, combination of anti-human PD-1 antibody and anti-human 4-1BB antibody were efficacious in controlling tumor growth in B-hPD-1/h4-1BB mice, demonstrating that the B-hPD-1/h4-1BB mice provide a powerful preclinical model for in vivo evaluation of combination of anti-human PD-1 antibody and anti-human 4-1BB antibody. Values are expressed as mean ± SEM.
In vivo efficacy of combination of anti-human PD-1 antibody and anti-human 4-1BB antibody
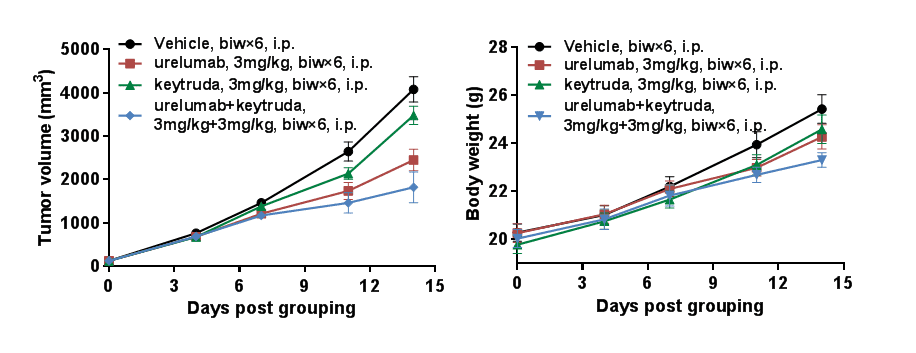
 Antitumor activity of combination of anti-human PD-1 antibody and anti-human 4-1BB in B-hPD-1/h4-1BB mice. (A) combination of anti-human PD-1 antibody and anti-human 4-1BB antibody inhibited B16F10-hPD-L1 tumor growth in B-hPD-1/h4-1BB mice. Murine colon cancer B16F10-hPD-L1 cells were subcutaneously implanted into homozygous B-hPD-1/h4-1BB mice (female, 6-week-old, n=6). Mice were grouped when tumor volume reached approximately 100 mm3, at which time they were treated with anti-human PD-1 antibody and anti-human 4-1BB antibody with doses and schedules indicated in panel. (B) Body weight changes during treatment. As shown in panel A, combination of anti-human PD-1 antibody and anti-human 4-1BB antibody were efficacious in controlling tumor growth in B-hPD-1/h4-1BB mice, demonstrating that the B-hPD-1/h4-1BB mice provide a powerful preclinical model for in vivo evaluation of combination of anti-human PD-1 antibody and anti-human 4-1BB antibody. Values are expressed as mean ± SEM.
In vivo efficacy of combination of anti-human PD-1 antibody and anti-human 4-1BB antibody
 Antitumor activity of combination of anti-human PD-1 antibody and anti-human 4-1BB in B-hPD-1/h4-1BB mice. (A) combination of anti-human PD-1 antibody and anti-human 4-1BB antibody inhibited EL4 tumor growth in B-hPD-1/h4-1BB mice. Murine colon cancer EL4 cells were subcutaneously implanted into homozygous B-hPD-1/h4-1BB mice (female, 6-week-old, n=6). Mice were grouped when tumor volume reached approximately 100 mm3, at which time they were treated with anti-human PD-1 antibody and anti-human 4-1BB antibody with doses and schedules indicated in panel. (B) Body weight changes during treatment. As shown in panel A, combination of anti-human PD-1 antibody and anti-human 4-1BB antibody were efficacious in controlling tumor growth in B-hPD-1/h4-1BB mice, demonstrating that the B-hPD-1/h4-1BB mice provide a powerful preclinical model for in vivo evaluation of combination of anti-human PD-1 antibody and anti-human 4-1BB antibody. Values are expressed as mean ± SEM.
In vivo efficacy of combination of anti-human PD-1 antibody and anti-human 4-1BB antibody
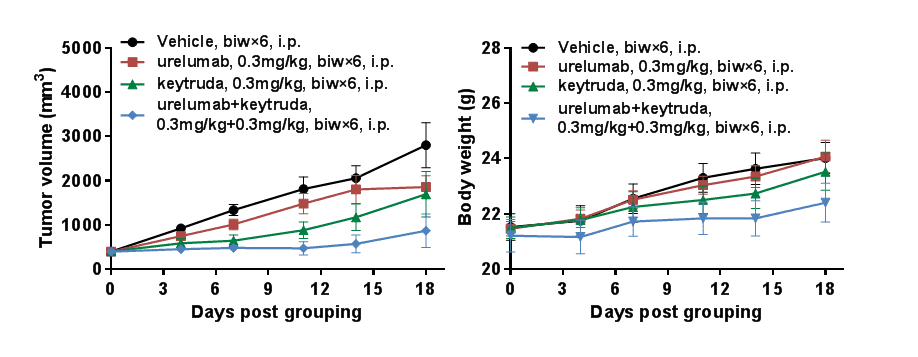 Antitumor activity of combination of anti-human PD-1 antibody and anti-human 4-1BB in B-hPD-1/h4-1BB mice. (A) combination of anti-human PD-1 antibody and anti-human 4-1BB antibody inhibited MC38-hPD-L1 tumor growth in B-hPD-1/h4-1BB mice. Murine colon cancer MC38-hPD-L1 cells were subcutaneously implanted into homozygous B-hPD-1/h4-1BB mice (female, 6-week-old, n=8). Mice were grouped when tumor volume reached approximately 100 mm3, at which time they were treated with anti-human PD-1 antibody and anti-human 4-1BB antibody with doses and schedules indicated in panel. (B) Body weight changes during treatment. As shown in panel A, combination of anti-human PD-1 antibody and anti-human 4-1BB antibody were efficacious in controlling tumor growth in B-hPD-1/h4-1BB mice, demonstrating that the B-hPD-1/h4-1BB mice provide a powerful preclinical model for in vivo evaluation of combination of anti-human PD-1 antibody and anti-human 4-1BB antibody. Values are expressed as mean ± SEM.
 -
References
-
- Clin Transl Immunology. 2014 Aug 1;3(8): e22. doi: 10.1038/cti.2014.18. eCollection 2014 Aug.
- J Immunol. 2002 Jun 1;168(11):5483-90.
- Nat Commun. 2017 Feb 6; 8: 14369. doi: 10.1038/ncomms14369.
- EMBO J. 1992 Nov;11(11): 3887-95.
- J Exp Med. 2000 Oct 2;192(7): 1027-34.
- Science. 2001 Jan 12;291(5502): 319-22.
