
Basic Information
-
Target Strategy

-
Exon 2 of mouse Pdcd1 (which encodes the IgV domain) was replaced by human PDCD1 exon 2 in B-hPD-1/hPD-L1/hGITR mice. Exon 3 of mouse Cd274 (which encodes the IgV domain) was replaced by human CD274 exon 3 in B-hPD-L1/hPD-L1/hGITR mice. Exons 1-4 of mouse Tnfrsf18 (which encodes the extracellular domain) was replaced by human TNFRSF18 exons 1-4 in B-hPD-1/hPD-L1/hGITR mice.
-
Protein expression analysis
-
PD-1 expression analysis
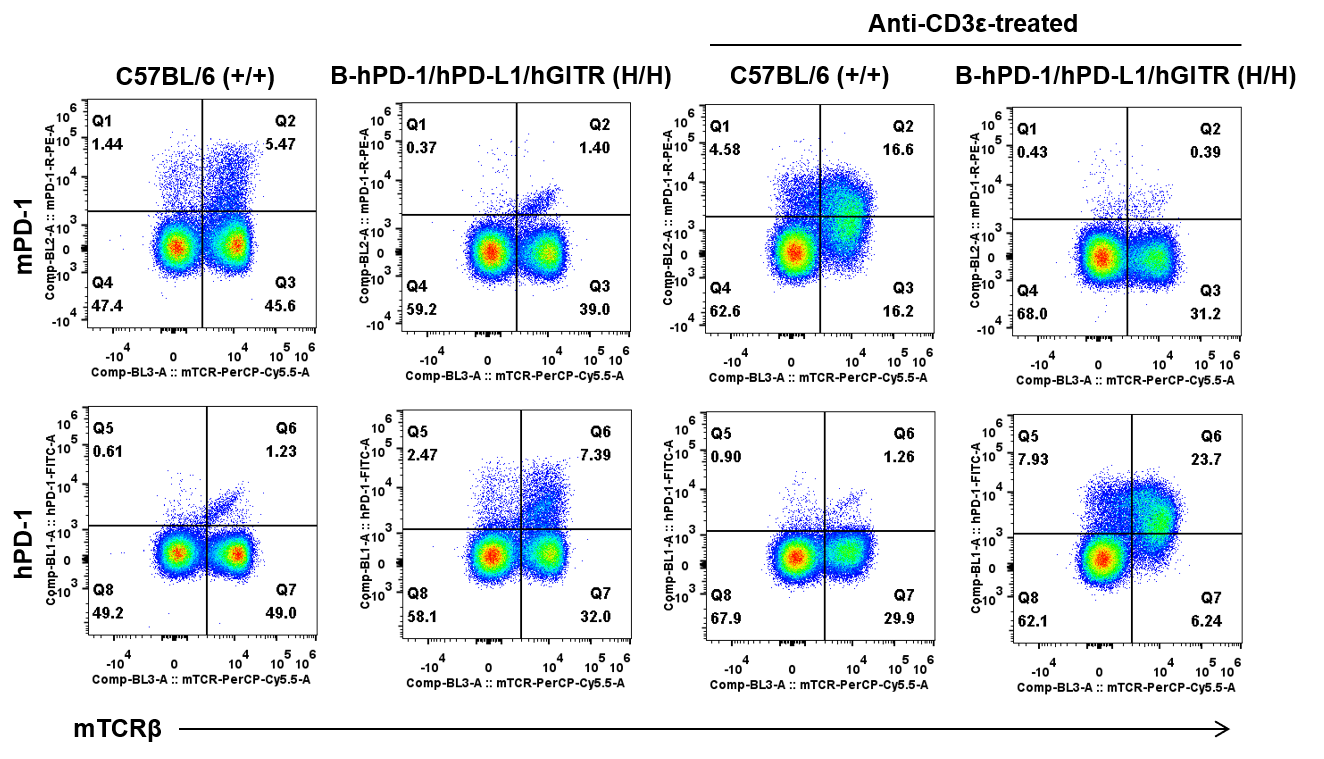
Splenocytes were collected from wild-type mice (+/+) and homozygous B-hPD-1/hPD-L1/hGITR mice (H/H) stimulated with anti-CD3ε in vivo, and analyzed by flow cytometry with species-specific anti-PD-1 antibody. Mouse PD-1 was detectable in WT mice but not in homozygous B-hPD-1/hPD-L1/hGITR mice. Human PD-1 was exclusively detectable in homozygous B-hPD-1/hPD-L1/hGITR mice but not in WT mice.
PD-L1 expression analysis
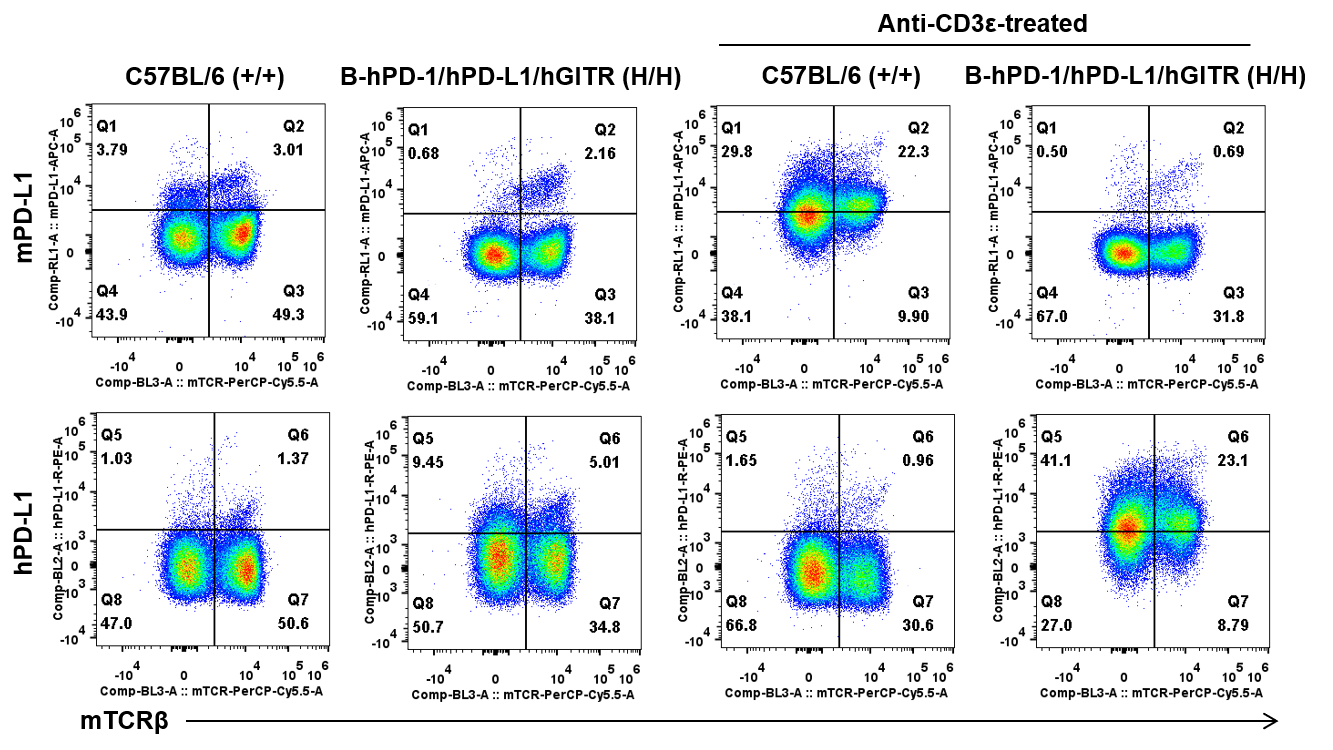
Splenocytes were collected from wild-type mice (+/+) and homozygous B-hPD-1/hPD-L1/hGITR mice (H/H) stimulated with anti-CD3ε in vivo, and analyzed by flow cytometry with species-specific anti-PD-L1 antibody. Mouse PD-L1 was detectable in WT mice but not in homozygous B-hPD-1/hPD-L1/hGITR mice. Human PD-L1 was exclusively detectable in homozygous B-hPD-1/hPD-L1/hGITR mice but not in WT mice.
GITR expression analysis
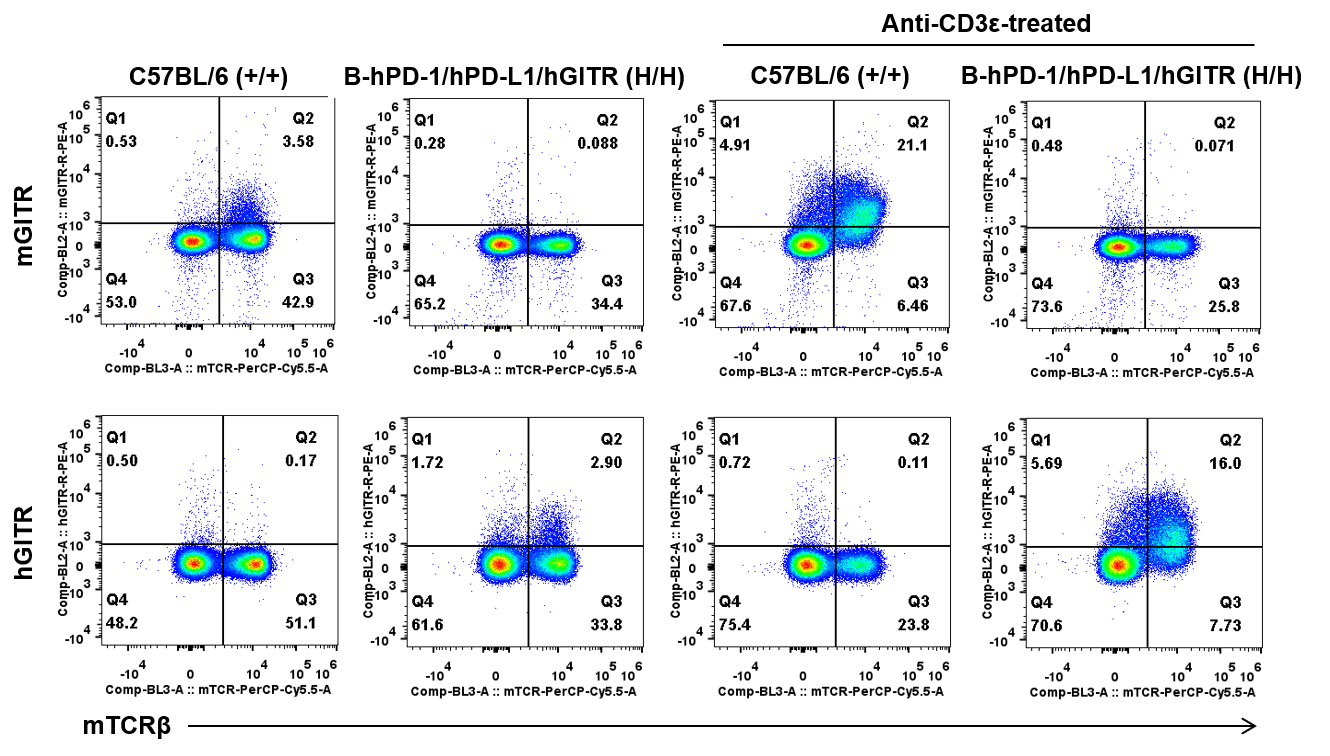
Splenocytes were collected from wild-type mice (+/+) and homozygous B-hPD-1/hPD-L1/hGITR mice (H/H) stimulated with anti-CD3ε in vivo, and analyzed by flow cytometry with species-specific anti-GITR antibody. Mouse GITR was detectable in WT mice but not in homozygous B-hPD-1/hPD-L1/hGITR mice. Human GITR was exclusively detectable in homozygous B-hPD-1/hPD-L1/hGITR mice but not in WT mice.
-
Immune cell profile
-
Analysis of leukocytes subpopulation in B-hPD-1/hPD-L1/hGITR mice
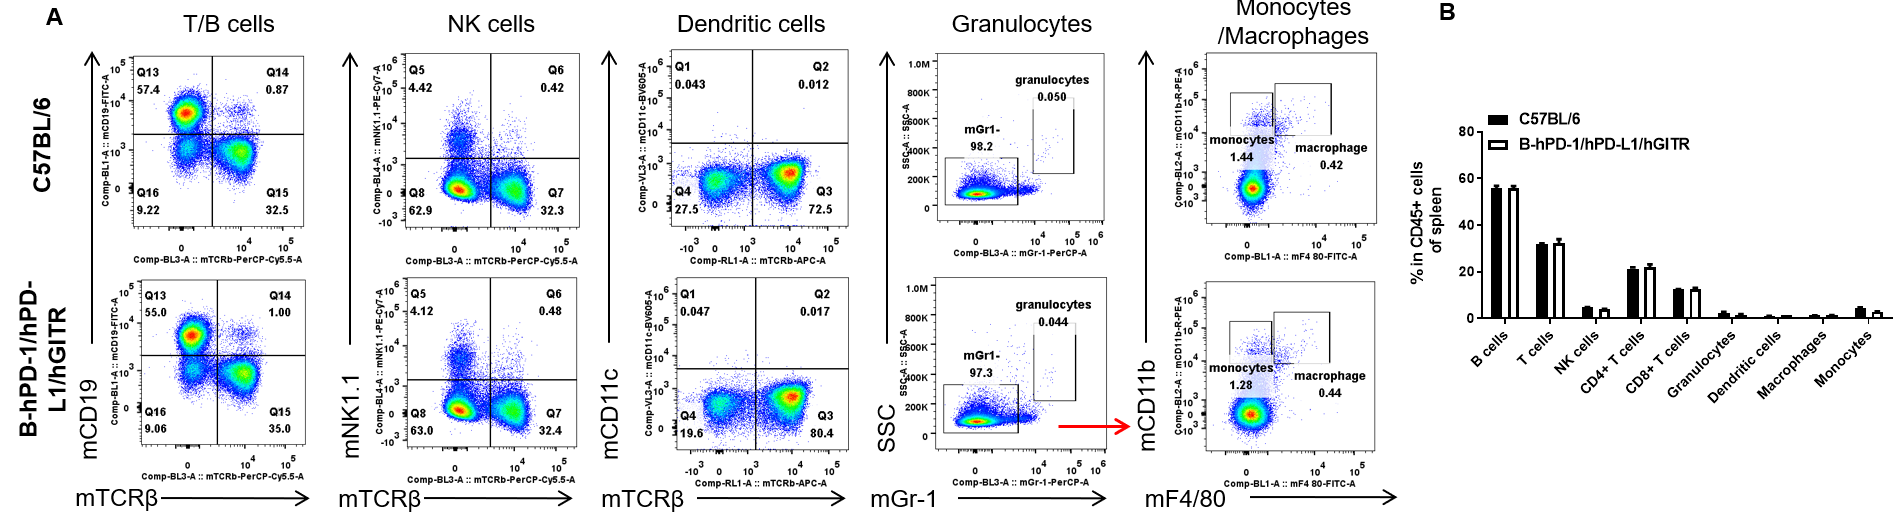
Analysis of spleen leukocyte subpopulations by FACS. Splenocytes were isolated from female C57BL/6 and B-hPD-1/hPD-L1/hGITR mice (n=3, 6-week-old). Flow cytometry analysis of the splenocytes were performed to assess leukocyte subpopulations. A. Representative FACS plots. Single live cells were gated for the CD45+ population and used for further analysis as indicated here. B. Results of FACS analysis. Percent of T cells, B cells, NK cells, dendritic cells, granulocytes, monocytes and macrophages in homozygous B-hPD-1/hPD-L1/hGITR mice were similar to those in the C57BL/6 mice, demonstrating that PD-1/PD-L1/GITR humanized does not change the overall development, differentiation or distribution of these cell types in spleen. Values are expressed as mean ± SEM.
Analysis of spleen T cell subpopulations in B-hPD-1/hPD-L1/hGITR mice
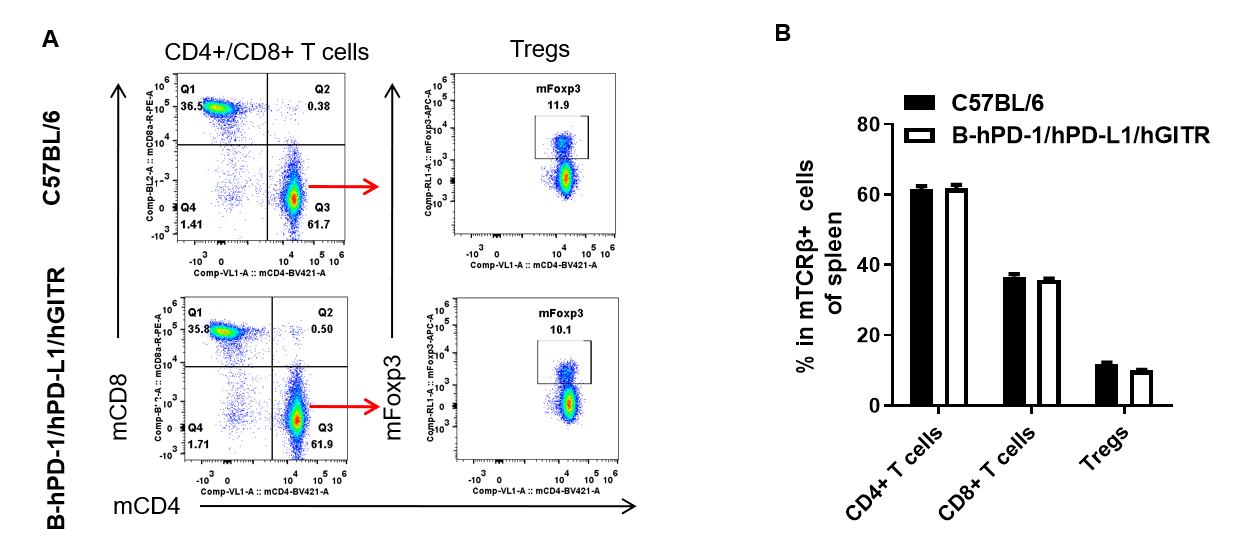
Analysis of spleen T cell subpopulations by FACS. Splenocytes were isolated from female C57BL/6 and B-hPD-1/hPD-L1/hGITR mice (n=3, 6-week-old). Flow cytometry analysis of the splenocytes ere performed to assess leukocyte subpopulations. A. Representative FACS plots. Single live CD45+ cells were gated for CD3+ T cell population and used for further analysis as indicated here. B. Results of FACS analysis. The percent of CD8+ T cells, CD4+ T cells and Tregs in homozygous B-hPD-1/hPD-L1/hGITR mice were similar to those in the C57BL/6 mice, demonstrating that introduction of hPD-1/hPD-L1/hGITR in place of its mouse counterpart does not change the overall development, differentiation or distribution of these T cell subtypes in spleen. Values are expressed as mean ± SEM.
Analysis of leukocytes subpopulation in B-hPD-1/hPD-L1/hGITR mice
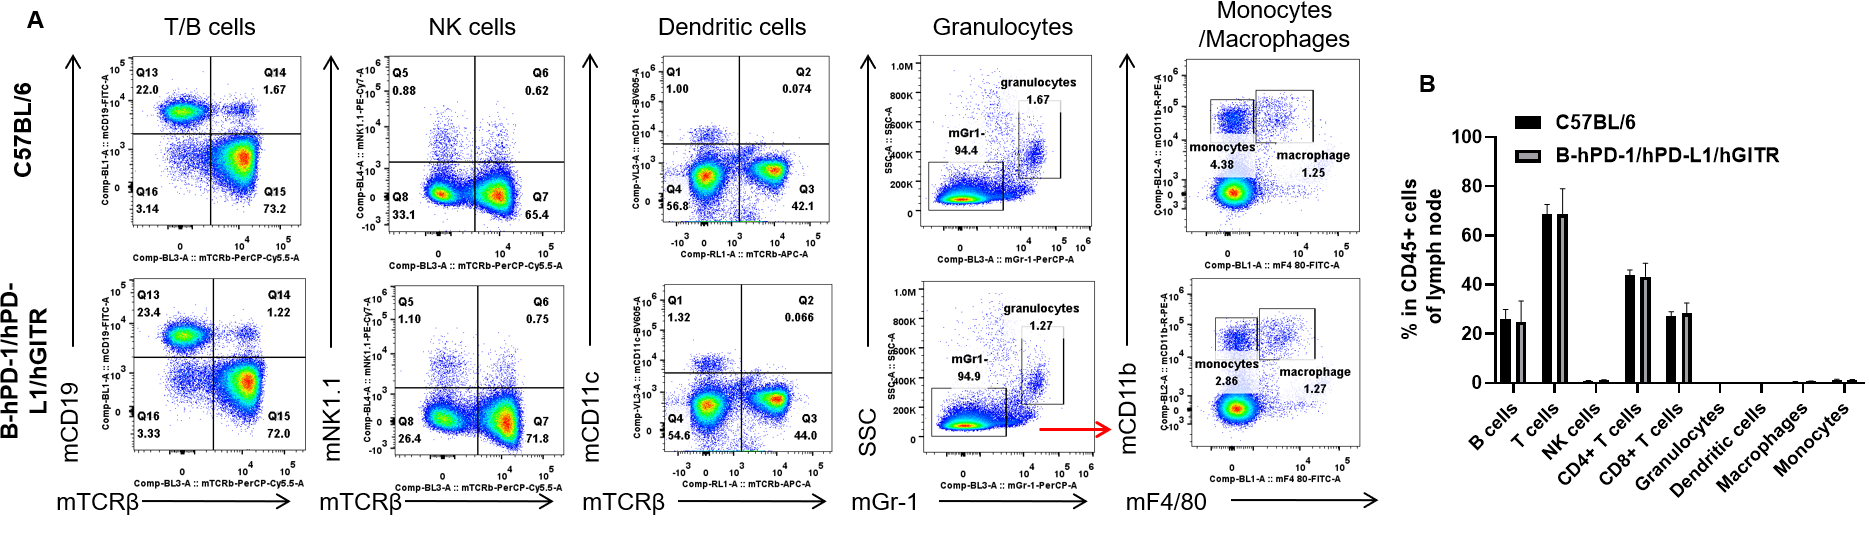
Analysis of lymph node leukocyte subpopulations by FACS. Lymph node was isolated from female C57BL/6 and B-hPD-1/hPD-L1/hGITR mice (n=3, 6-week-old). Flow cytometry analysis of the lymph node cells were performed to assess leukocyte subpopulations. A. Representative FACS plots. Single live cells were gated for the CD45+ population and used for further analysis as indicated here. B. Results of FACS analysis. Percent of T cells, B cells, NK cells, dendritic cells, granulocytes, monocytes and macrophages in homozygous B-hPD-1/hPD-L1/hGITR mice were similar to those in the C57BL/6 mice, demonstrating that PD-1/PD-L1/GITR humanized does not change the overall development, differentiation or distribution of these cell types in lymph node. Values are expressed as mean ± SEM.
Analysis of lymph node T cell subpopulations in B-hPD-1/hPD-L1/hGITR mice
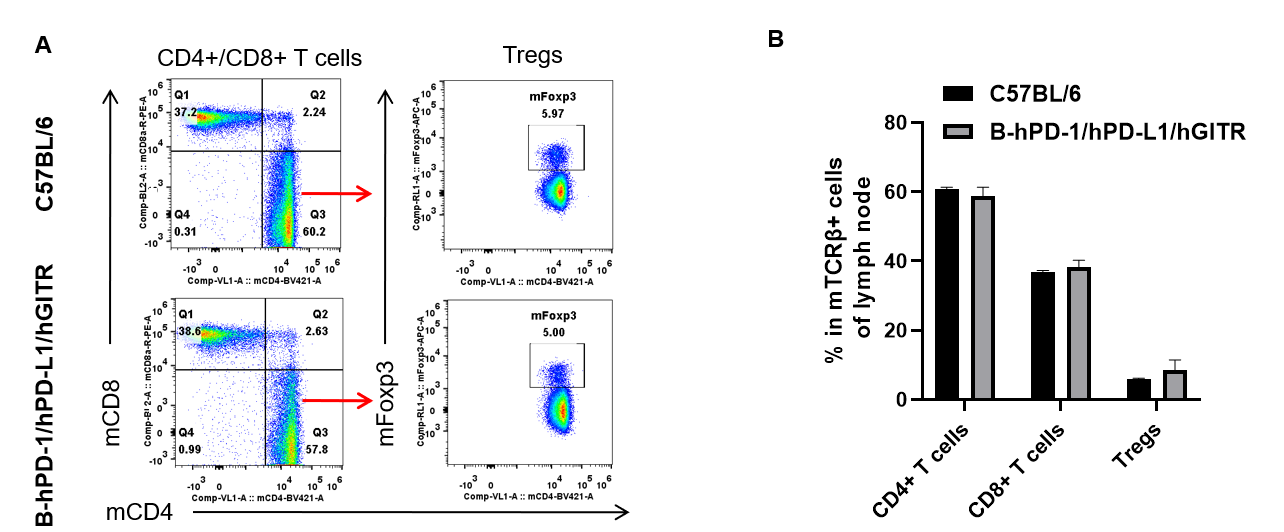
Analysis of lymph node T cell subpopulations by FACS. Splenocytes were isolated from female C57BL/6 and B-hPD-1/hPD-L1/hGITR mice (n=3, 6-week-old). Flow cytometry analysis of the lymph node cells were performed to assess leukocyte subpopulations. A. Representative FACS plots. Single live CD45+ cells were gated for CD3+ T cell population and used for further analysis as indicated here. B. Results of FACS analysis. The percent of CD8+ T cells, CD4+ T cells, and Tregs in homozygous B-hPD-1/hPD-L1/hGITR mice were similar to those in the C57BL/6 mice, demonstrating that introduction of hPD-1/hPD-L1/hGITR in place of its mouse counterpart does not change the overall development, differentiation or distribution of these T cell subtypes in lymph node. Values are expressed as mean ± SEM.
Analysis of leukocytes subpopulation in B-hPD-1/hPD-L1/hGITR mice
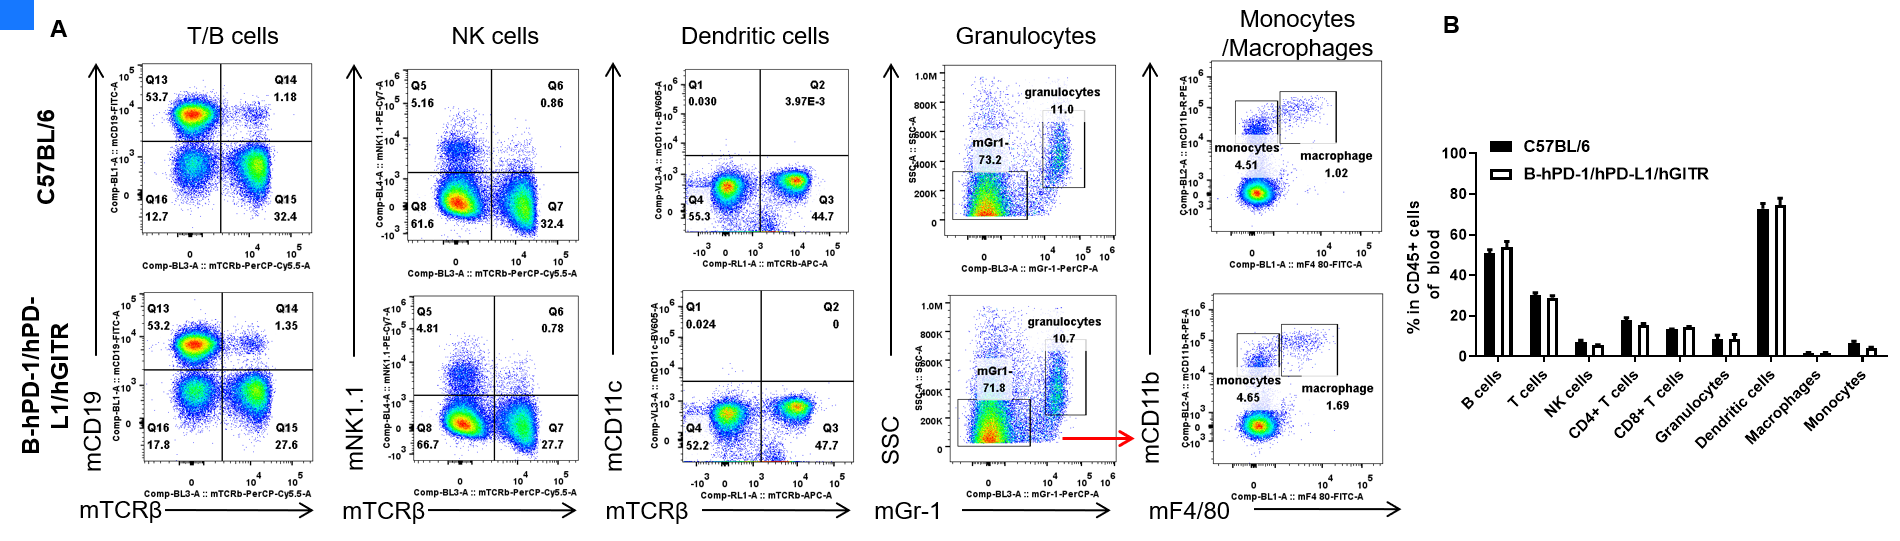
Analysis of blood leukocyte subpopulations by FACS. Blood cells were isolated from female C57BL/6 and B-hPD-1/hPD-L1/hGITR mice (n=3, 6-week-old). Flow cytometry analysis of the blood cells were performed to assess leukocyte subpopulations. A. Representative FACS plots. Single live cells were gated for the CD45+ population and used for further analysis as indicated here. B. Results of FACS analysis. Percent of T cells, B cells, NK cells, dendritic cells, granulocytes, monocytes and macrophages in homozygous B-hPD-1/hPD-L1/hGITR mice were similar to those in the C57BL/6 mice, demonstrating that PD-1/PD-L1/GITR humanized does not change the overall development, differentiation or distribution of these cell types in blood. Values are expressed as mean ± SEM.
Analysis of blood T cell subpopulations in B-hPD-1/hPD-L1/hGITR mice
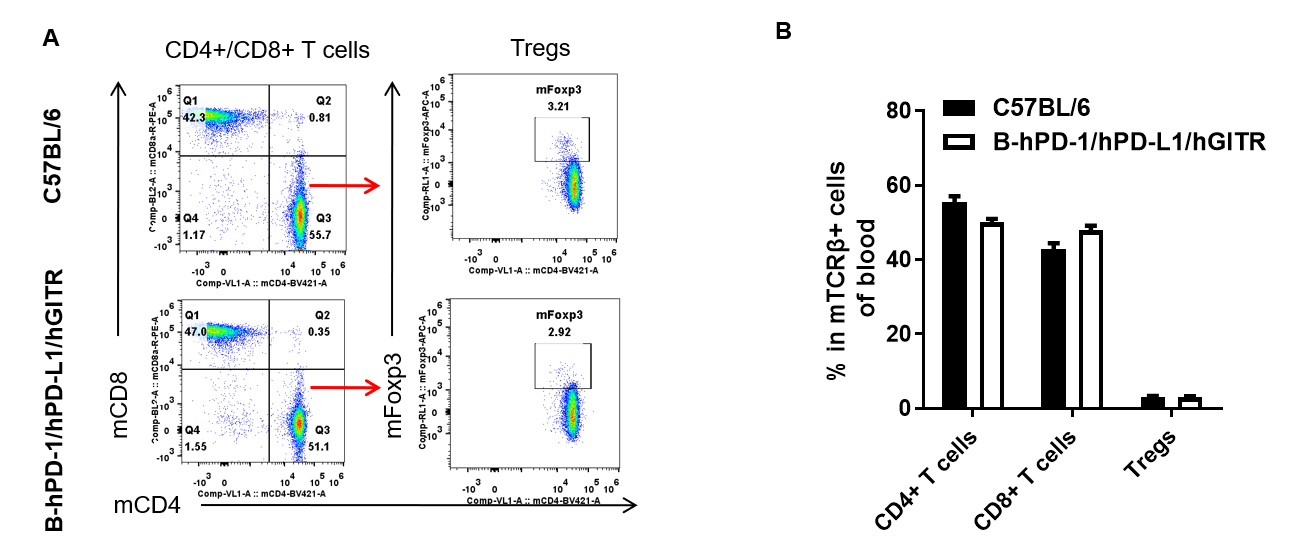
Analysis of blood T cell subpopulations by FACS. Splenocytes were isolated from female C57BL/6 and B-hPD-1/hPD-L1/hGITR mice (n=3, 6-week-old). Flow cytometry analysis of the blood cells were performed to assess leukocyte subpopulations. A. Representative FACS plots. Single live CD45+ cells were gated for CD3+ T cell population and used for further analysis as indicated here. B. Results of FACS analysis. The percent of CD8+ T cells, CD4+ T cells, and Tregs in homozygous B-hPD-1/hPD-L1/hGITR mice were similar to those in the C57BL/6 mice, demonstrating that introduction of hPD-1/hPD-L1/hGITR in place of its mouse counterpart does not change the overall development, differentiation or distribution of these T cell subtypes in blood. Values are expressed as mean ± SEM.
-
Combination therapy
-
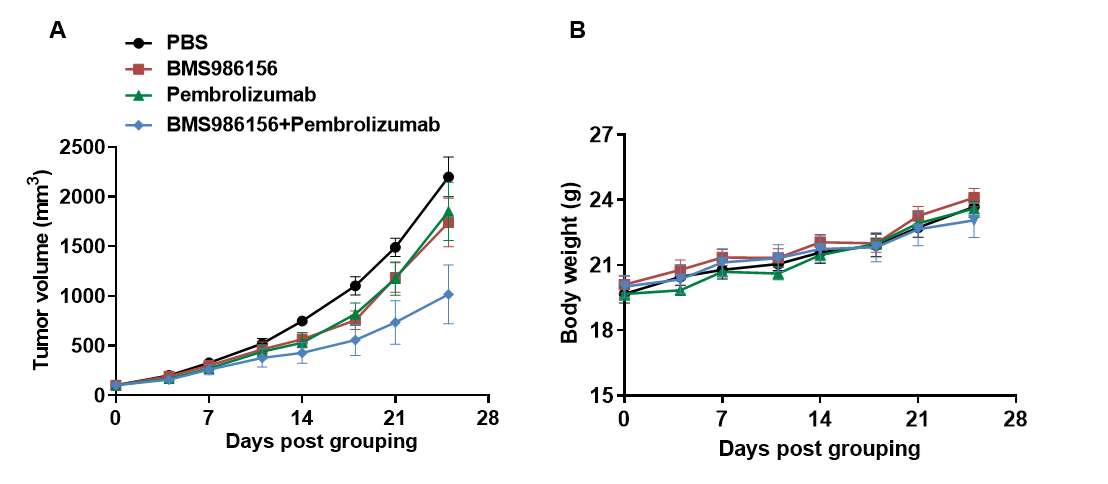
Antitumor activity of anti-human PD-1 antibody combined with anti-human GITR antibody in B-hPD-1/hPD-L1/hGITR mice. (A) Anti-human PD-1 antibody combined with anti-human GITR antibody inhibited MC38 tumor growth in B-hPD-1/hPD-L1/hGITR mice. All antibodies used in the experiment were prepared in-house. Murine colon cancer MC38 cells were subcutaneously implanted into homozygous B-hPD-1/hPD-L1/hGITR mice (female, 6-7 weeks old, n=5). Mice were grouped when tumor volume reached approximately 100 mm3, at which time they were treated with human PD-1 and human GITR antibodies (in house) indicated in the panel. (B) Body weight changes during treatment. As shown in panel A, the antibodies were efficacious in controlling tumor growth in B-hPD-1/hPD-L1/hGITR mice, demonstrating that the B-hPD-1/hPD-L1/hGITR mice provide a powerful preclinical model for in vivo evaluation of PD-1 and GITR antibodies. Values are expressed as mean ± SEM.
