
Basic Information
PD-1 (Programmed death-1); CD274 (CD274 antigen); TIM3 (T-cell immunoglobulin and mucin domains-containing protein 3)
-
Details

-
Protein expression analysis
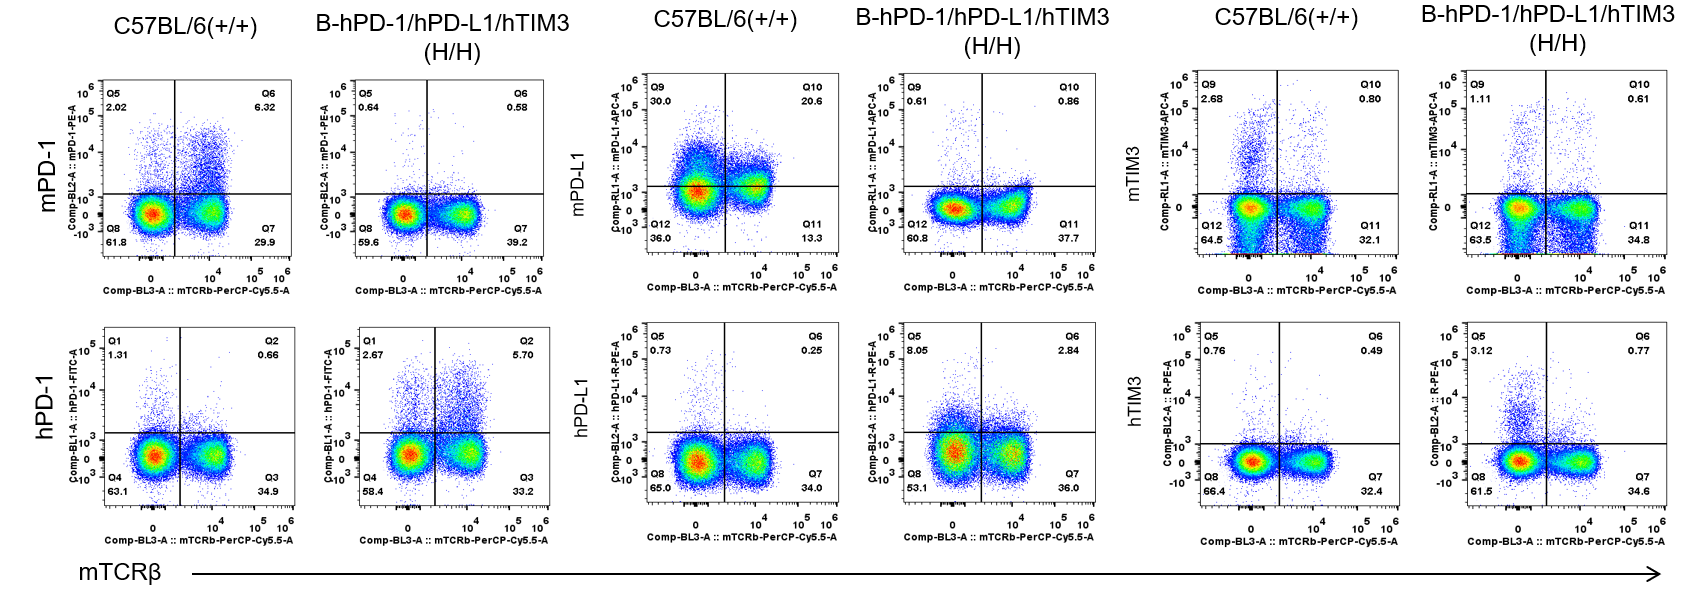
Strain specific PD-1, PD-L1 and TIM3 expression analysis in homozygous B-hPD-1/hPD-L1/hTIM3 mice by flow cytometry. Splenocytes were collected from WT and homozygous B-hPD-1/hPD-L1/hTIM3 (H/H) mice, and analyzed by flow cytometry with species-specific anti-PD-1, anti-PD-L1 and anti-TIM3 antibody. Mouse PD-1, PD-L1 and TIM3 were detectable in WT mice. Human PD-1, PD-L1 and TIM3 were exclusively detectable in homozygous B-hPD-1/hPD-L1/hTIM3 but not WT mice.
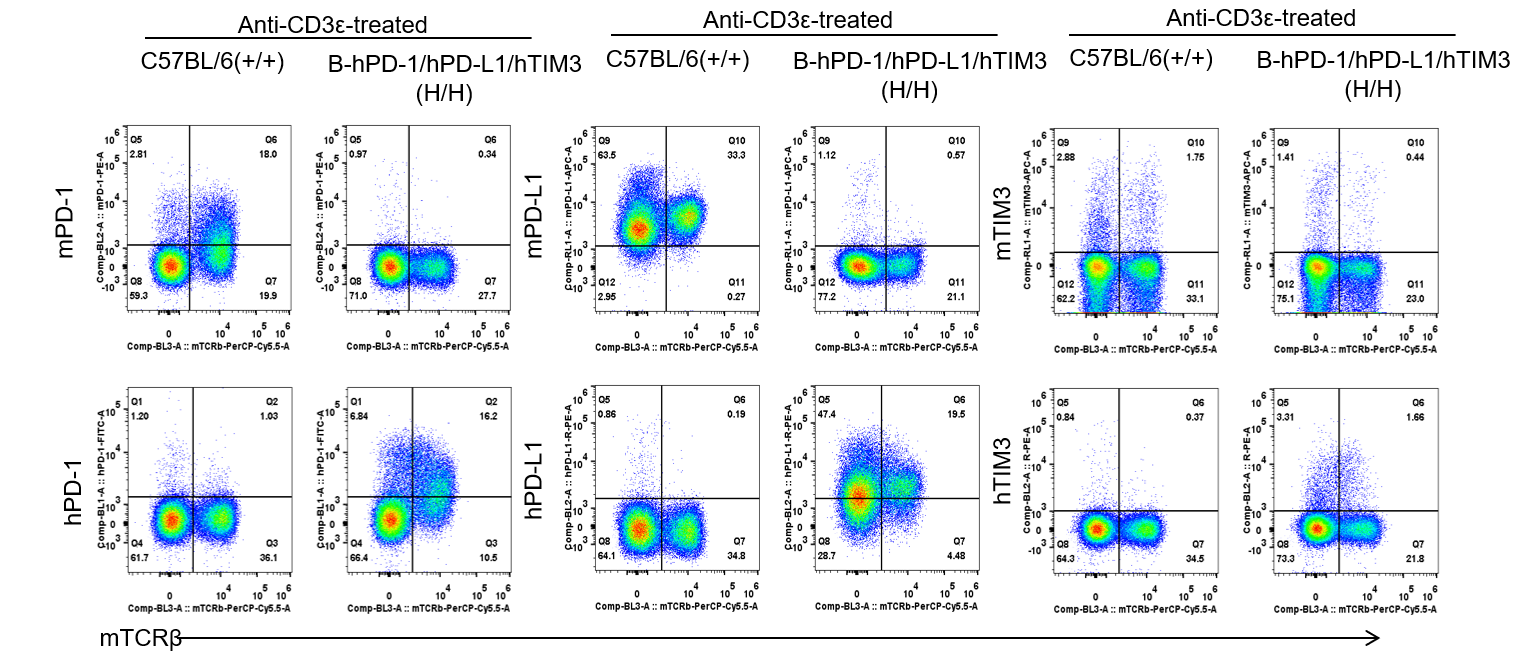
Strain specific PD-1, PD-L1 and TIM3 expression analysis in homozygous B-hPD-1/hPD-L1/hTIM3 mice by flow cytometry. Splenocytes were collected from WT and homozygous B-hPD-1/hPD-L1/hTIM3 (H/H) mice stimulated with anti-CD3ε in vivo, and analyzed by flow cytometry with species-specific anti-PD-1, anti-PD-L1 and anti-TIM3 antibody. Mouse PD-1, PD-L1 and TIM3 were detectable in WT mice. Human PD-1, PD-L1 and TIM3 were exclusively detectable in homozygous B-hPD-1/hPD-L1/hTIM3 but not WT mice.
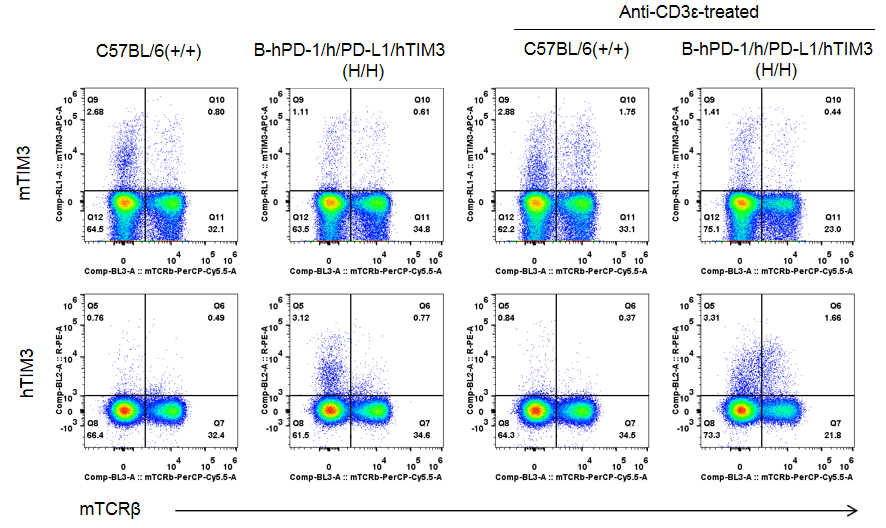
Strain specific TIM3 expression analysis in homozygous B-hPD-1/hPD-L1/hTIM3 mice by flow cytometry. Splenocytes were collected from WT and homozygous B-hPD-1/hPD-L1/hTIM3 (H/H) mice after stimulation with anti-CD3ε in vivo and without stimulation, and analyzed by flow cytometry with species-specific anti-TIM3 antibody. Mouse TIM3 was detectable in WT mice. Human TIM3 was exclusively detectable in homozygous B-hPD-1/hPD-L1/hTIM3 but not WT mice. After anti-CD3ε stimulation, hTIM3 protein expression was significantly increased.
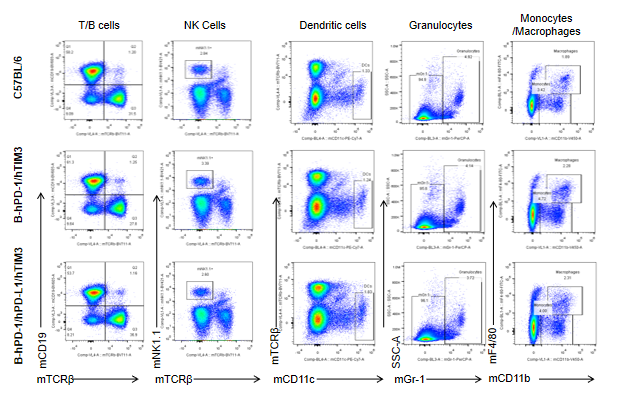
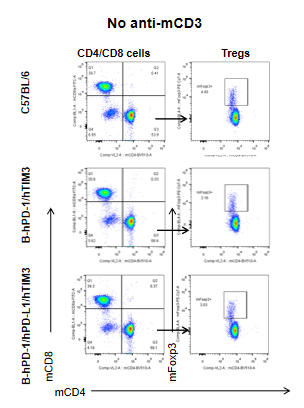
Analysis of Blood leukocytes cell subpopulations –No anti-mCD3
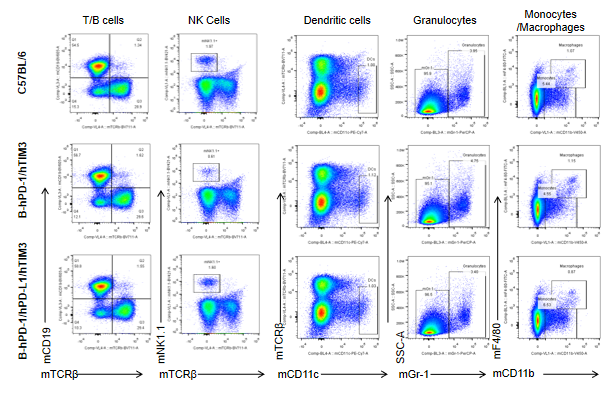
Analysis of Spleen leukocytes cell subpopulations –No anti-mCD3
Analysis of Spleen leukocytes cell subpopulations – anti-mCD3
Analysis of lymph node leukocytes cell subpopulations
Analysis of blood,spleen and lymph node leukocytes cell subpopulations
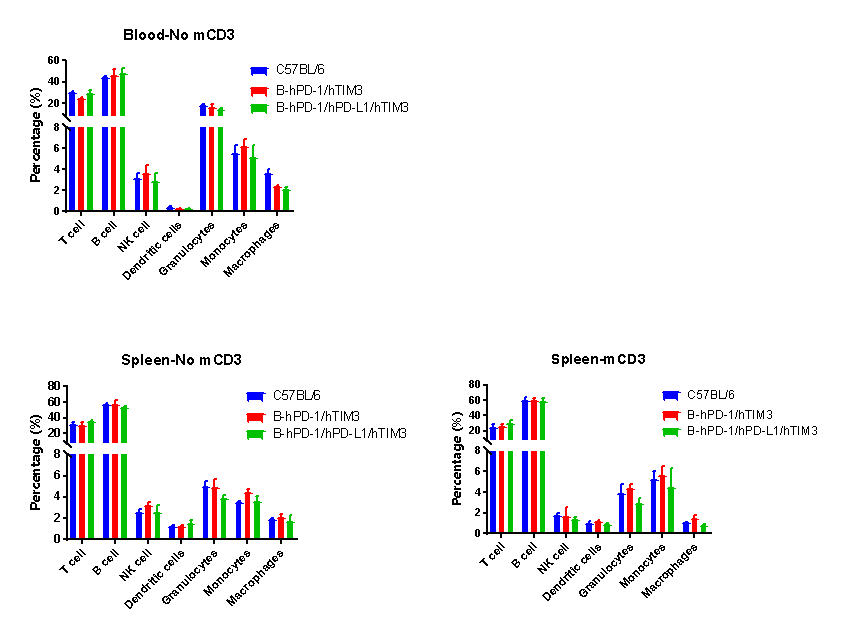
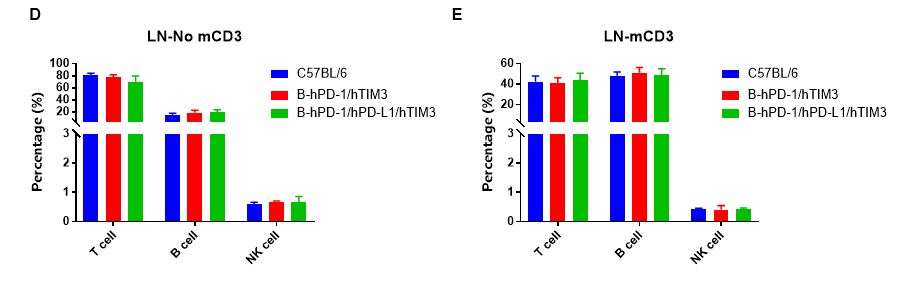
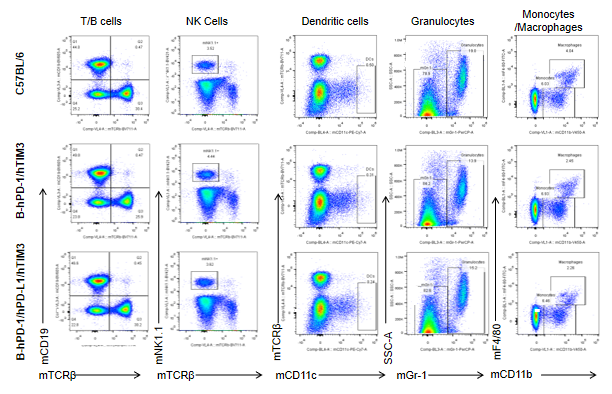
Analysis of blood,spleen and lymph node leukocytes cell subpopulations by FACS Blood, spleen and lymph node leukocytes cell were isolated from female mice in the panel(n=3, 6 week-old). Flow cytometry analysis was performed to assess leukocyte subpopulations. Percent of T, B, NK, Granulocytes, Monocyte, DC and macrophage cells in homozygous B-hPD-1/hTIM3、 B-hPD-1/hPD-L1/hTIM3 mice were similar to those in the C57BL/6 mice both at rest and in stimulated with anti-CD3ε in vivo, demonstrating that the humanized mouse does not change the overall development, differentiation or distribution of these cell types in blood,spleen and lymph node.
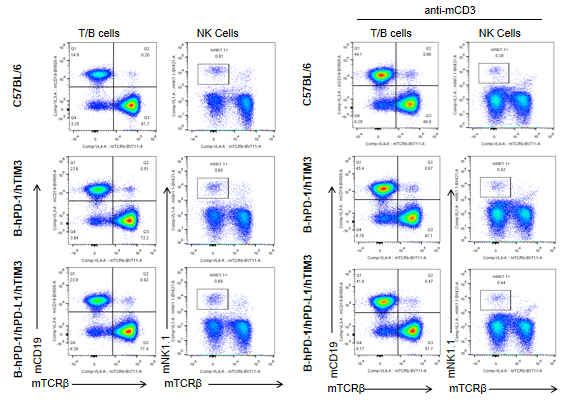
Analysis of blood T cell subpopulations
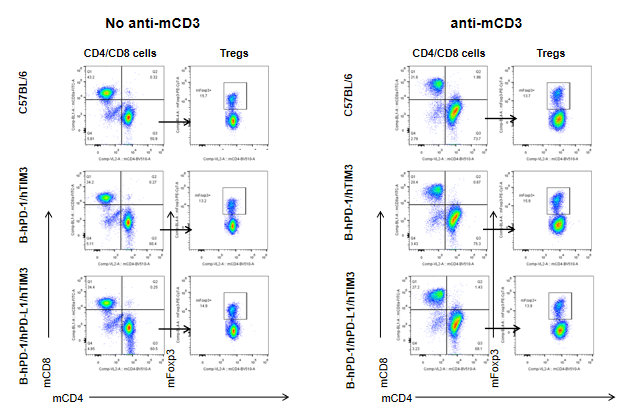
Analysis of spleen T cell subpopulations
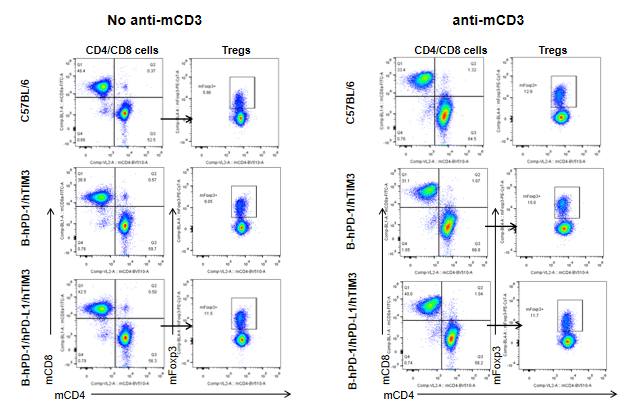
Analysis of lymph node T cell subpopulations
Analysis of blood,spleen and lymph node T cell subpopulations
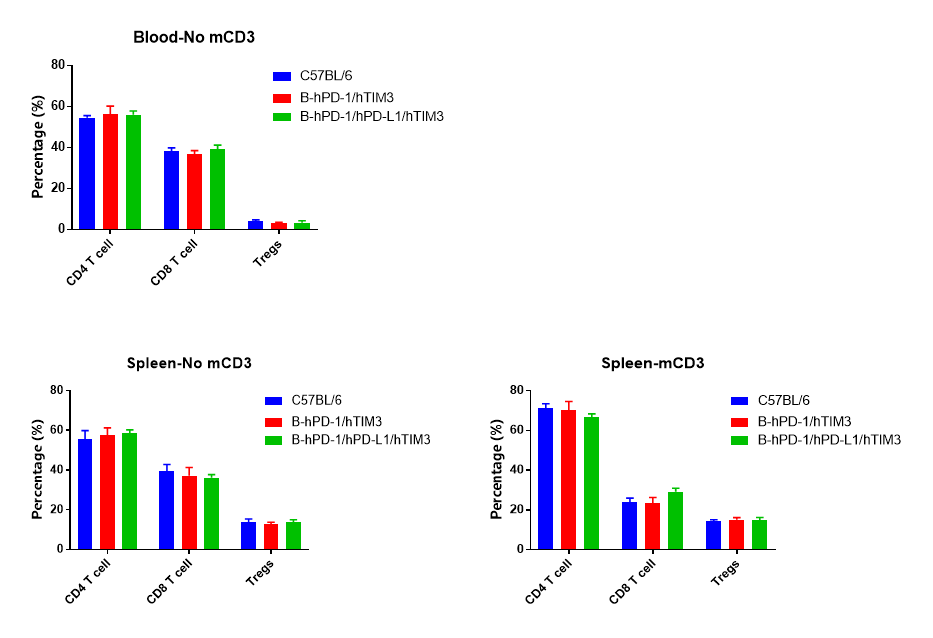
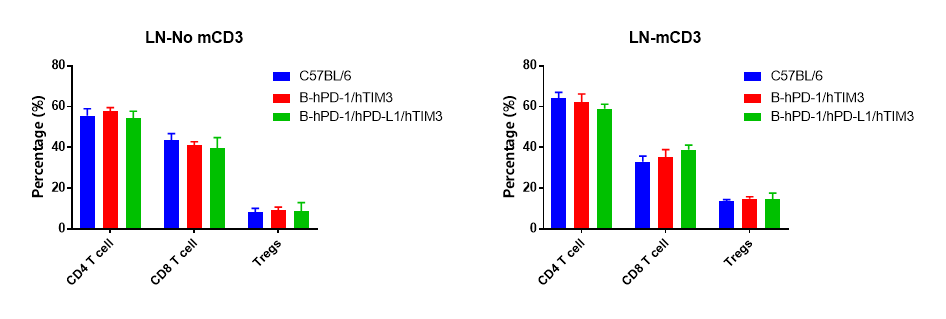
Analysis of blood,spleen and lymph node T cell subpopulations by FACS Blood, spleen and lymph node leukocytes cell were isolated from female mice in the panel(n=3, 6 week-old). Flow cytometry analysis was performed to assess leukocyte subpopulations. Percent of CD4+T, CD8+T and Treg cells in homozygous B-hPD-1/hTIM3、B-hPD-1/hPD-L1/hTIM3 mice were similar to those in the C57BL/6 mice both at rest and in stimulated with anti-CD3ε in vivo, demonstrating that the humanized mouse does not change the overall development, differentiation or distribution of these cell types in blood, spleen and lymph node.
-
Combination therapy of anti-human PD-L1 antibody and anti-human TIM3 antibody
-
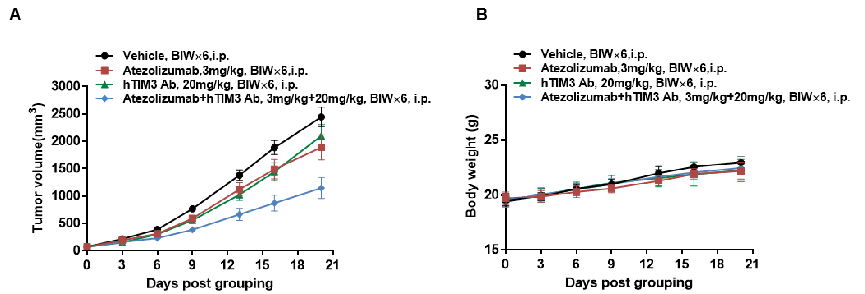
Antitumor activity of anti-human PD-L1 antibody Atezolizumab (in house) combined with anti-human TIM3 antibody hTIM3 Ab (provided by a client) in B-hPD-1/hPD-L1/hTIM3 mice. (A) Anti-human PD-L1 antibody combined with anti-human TIM3 antibody inhibited B-CAG-hPD-L1 MC38 tumor growth in B-hPD-1/hPD-L1/hTIM3 mice. Murine colon cancer B-CAG-hPD-L1 MC38 cells were subcutaneously implanted into homozygous B-hPD-1/hPD-L1/hTIM3 mice (female, 7-8 week-old, n=6). Mice were grouped when tumor volume reached approximately 100 mm3, at which time they were treated with atezolizumab (in house) and anti-human TIM3 antibody with doses and schedules indicated in panel A. (B) Body weight changes during treatment. As shown in panel A, combination of anti-human PD-L1 antibody and anti-human TIM3 antibody shows more inhibitory effects than individual groups, demonstrating that the B-hPD-1/hPD-L1/hTIM3 mice provide a powerful preclinical model for in vivo evaluating combination therapy efficacy of hPD-L1 antibodies and hTIM3 antibodies. Values are expressed as mean ± SEM.
-
Combination therapy of anti-human PD-1 antibody and anti-human TIM3 antibody
-
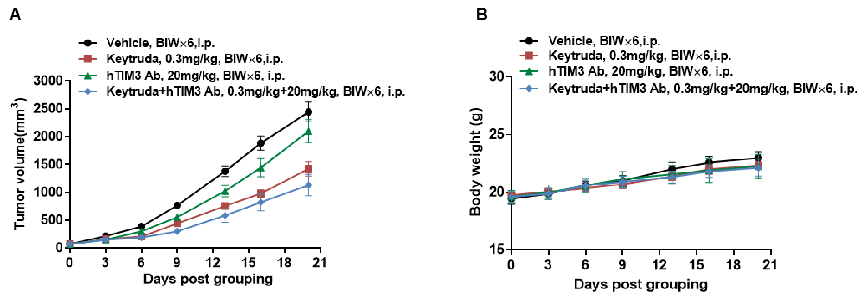
Antitumor activity of anti-human PD-1 Keytruda (in house) combined with anti-human TIM3 antibody hTIM3 Ab (provided by a client) in B-hPD-1/hPD-L1/hTIM3 mice. (A) Anti-human PD-1 antibody combined with anti-human TIM3 antibody inhibited B-CAG-hPD-L1 MC38 tumor growth in B-hPD-1/hPD-L1/hTIM3 mice. Murine colon cancer B-CAG-hPD-L1 MC38 cells were subcutaneously implanted into homozygous B-hPD-1/hPD-L1/hTIM3 mice (female, 7-8 week-old, n=6). Mice were grouped when tumor volume reached approximately 100 mm3, at which time they were treated with Keytruda (in house) and anti-human TIM3 antibody with doses and schedules indicated in panel A. (B) Body weight changes during treatment. As shown in panel A, combination of anti-human PD-1 antibody and anti-human TIM3 antibody shows more inhibitory effects than individual groups, demonstrating that the B-hPD-1/hPD-L1/hTIM3 mice provide a powerful preclinical model for in vivo evaluating combination therapy efficacy of hPD-1 antibodies and hTIM3 antibodies. Values are expressed as mean ± SEM.
