
Basic Information
C57BL/6-Pdcd1tm1(PDCD1)Bcgen Cd274tm1(CD274)Bcgen ,Tg(RP11-634C1)1/Bcgen
-
Targeting strategy

-
Gene targeting strategy for B-hPD-1/hPD-L1, Tg(hLILRB2/hLILRB3) mice. The exon 2 of mouse Pd-1 gene that encodes the IgV domain was replaced by human PD-1 exon 2 in B-hPD-1/hPD-L1, Tg(hLILRB2/hLILRB3) mice. The exon 3 of mouse Pd-l1 gene that encodes the IgV domain was replaced by human PD-L1 exon 3 in B-hPD-1/hPD-L1, Tg(hLILRB2/hLILRB3) mice. Bacterial artificial chromosome (BAC) clones for both the human LILRB2 and LILRB3 genes were integrated into the genome of B-hPD-1/hPD-L1, Tg(hLILRB2/hLILRB3) mice randomly.
-
Analysis of spleen leukocytes
-
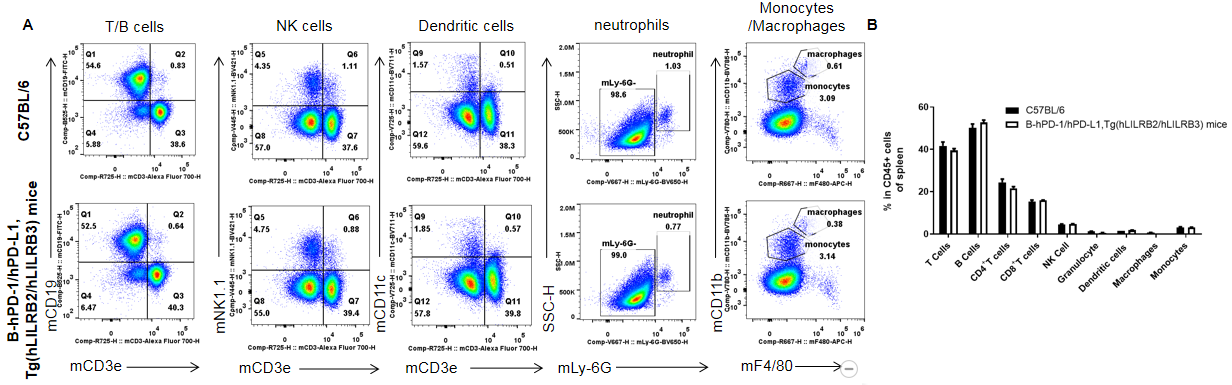
Analysis of spleen leukocyte subpopulations. Splenocytes were isolated from wild-type C57BL/6 and B-hPD-1/hPD-L1, Tg(hLILRB2/hLILRB3) mice (female, n=3, 7-week-old) and analyzed by flow cytometry to assess spleen leukocyte subpopulations. (A) Representative flow cytometry plots. Single live cells were gated on CD45+ cells and used for further analysis as indicated. (B) Percent of T cells, B cells, NK cells, dendritic cells, neutrophils, monocytes and macrophages in B-hPD-1/hPD-L1, Tg(hLILRB2/hLILRB3) mice were similar to those in wild-type mice. Values are expressed as mean ± SEM.
-
Analysis of spleen T cells
-
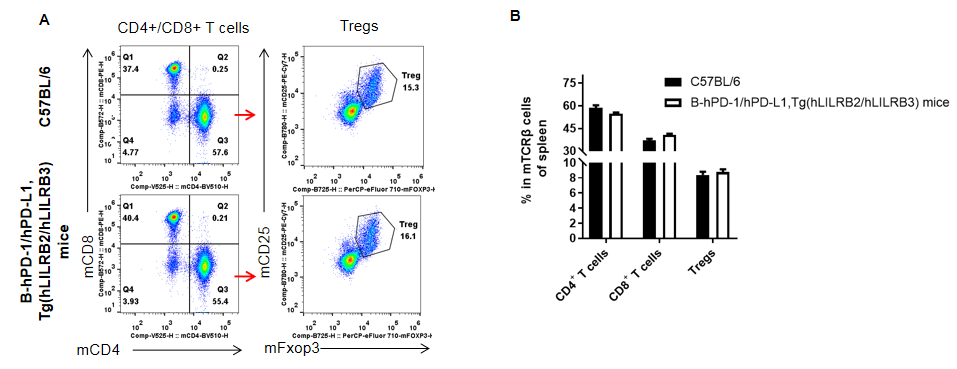
Analysis of spleen T cell subpopulations. Splenocytes were isolated from wild-type C57BL/6 and B-hPD-1/hPD-L1, Tg(hLILRB2/hLILRB3) mice (female, n=3, 7-week-old) and analyzed by flow cytometry to assess T cell subpopulations. (A) Representative flow cytometry plots. Single live CD45+ cells were gated on TCRβ+ T cells and used for further analysis as indicated. (B) Percent of CD8+ T cells, CD4+ T cells, and Tregs in B-hPD-1/hPD-L1, Tg(hLILRB2/hLILRB3) mice were similar to those in wild-type mice. Values are expressed as mean ± SEM.
-
Analysis of lymph node leukocytes
-
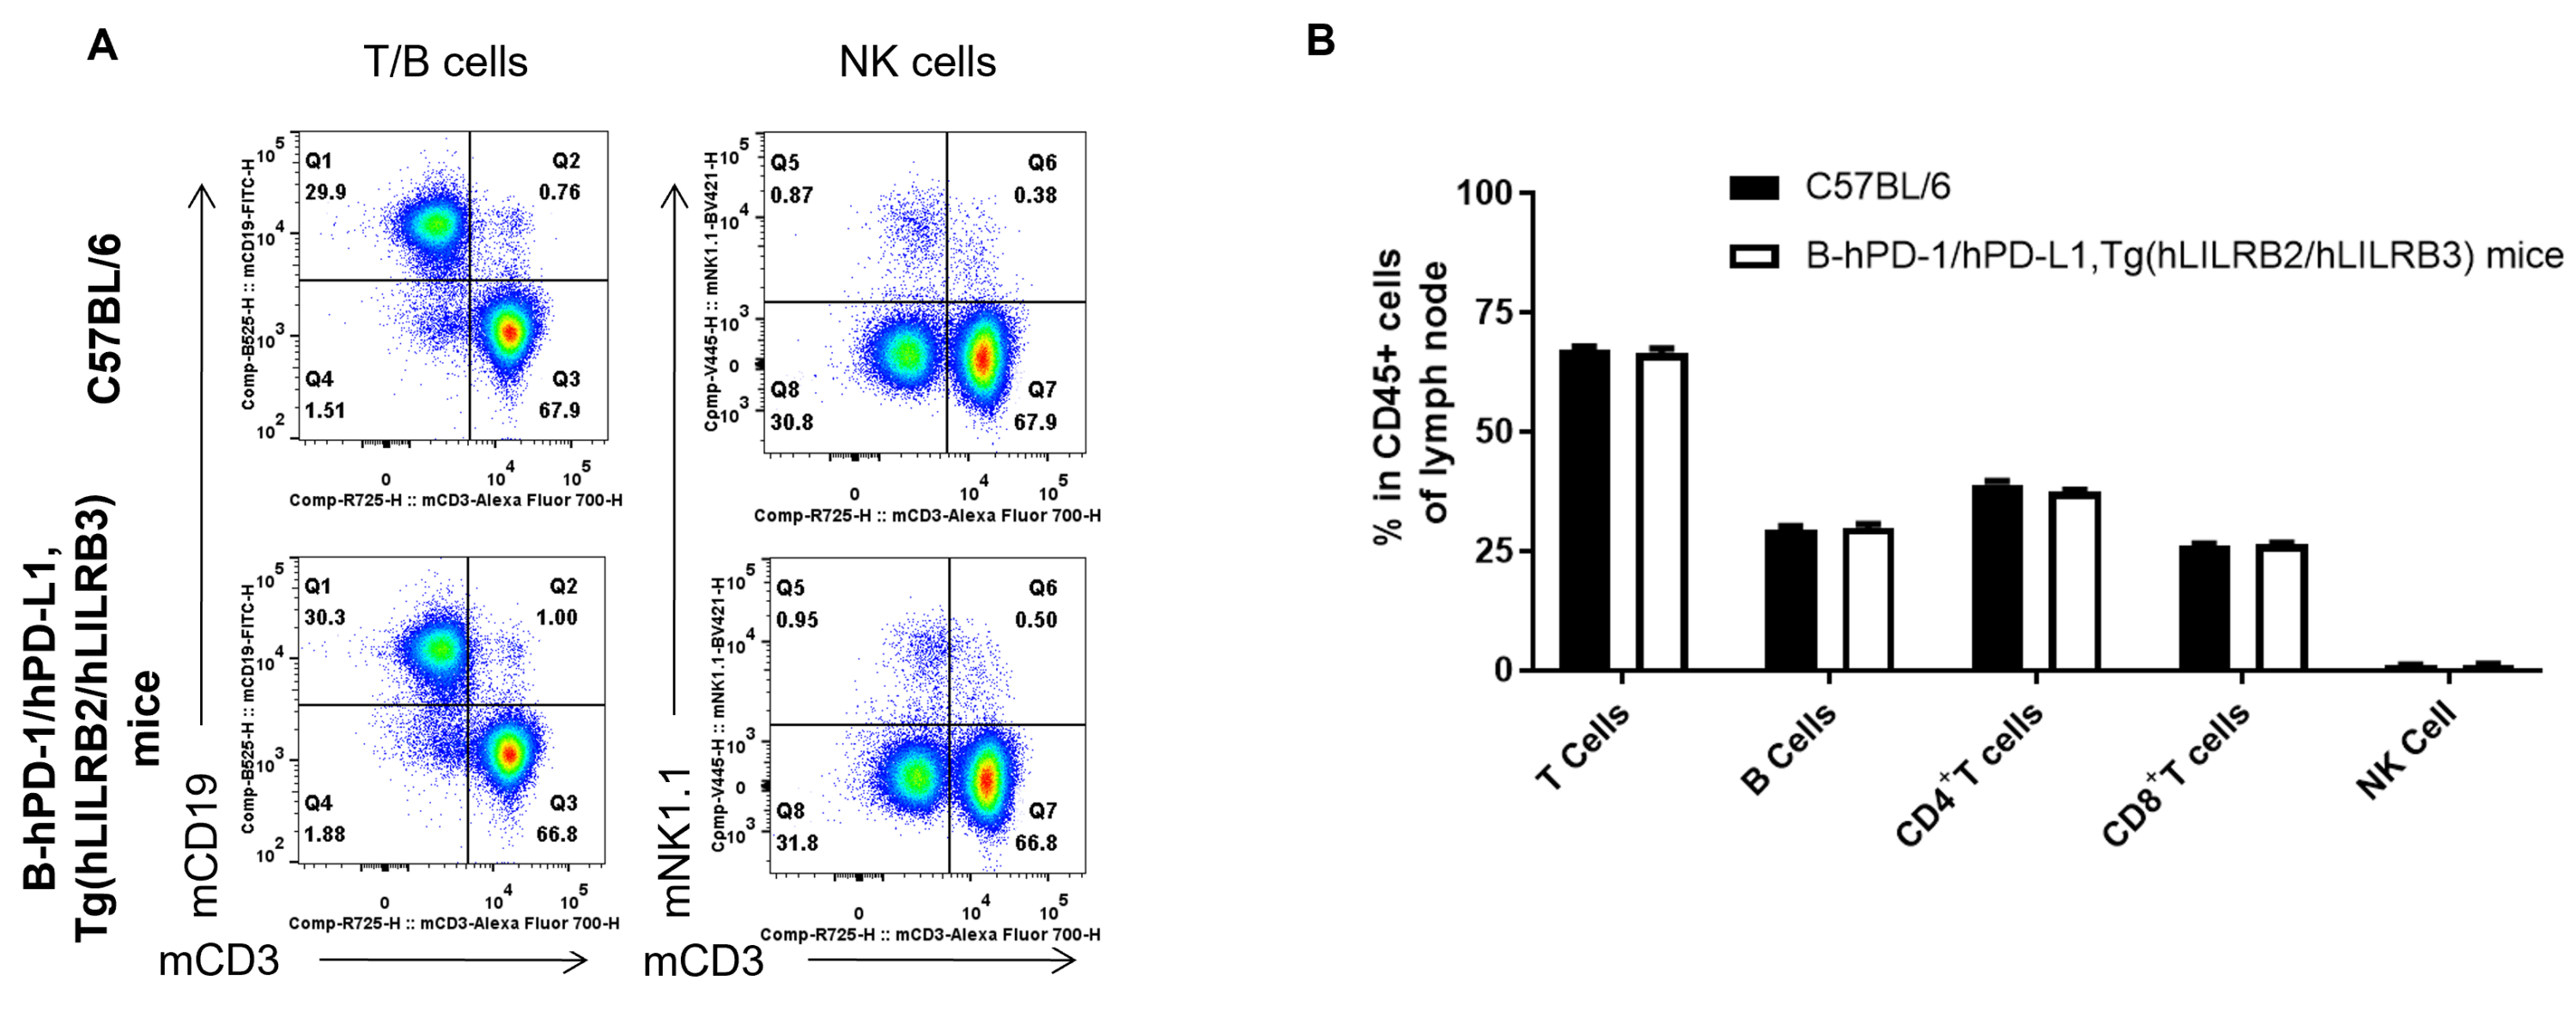
Analysis of lymph node leukocyte subpopulations by FACS. Leukocytes were isolated from female C57BL/6 and B-hPD-1/hPD-L1, Tg(hLILRB2/hLILRB3) mice(n=3, 7-week-old). Flow cytometry analysis of the leukocytes was performed to assess leukocyte subpopulations. A. Representative FACS plots. Single live cells were gated for CD45+ population and used for further analysis as indicated here. B. Results of FACS analysis. The percent of T cells, B cells and NK cells in B-hPD-1/hPD-L1, Tg(hLILRB2/hLILRB3) mice were similar to those in the C57BL/6 mice. Values are expressed as mean ± SEM.
-
Analysis of lymph node T cells
-
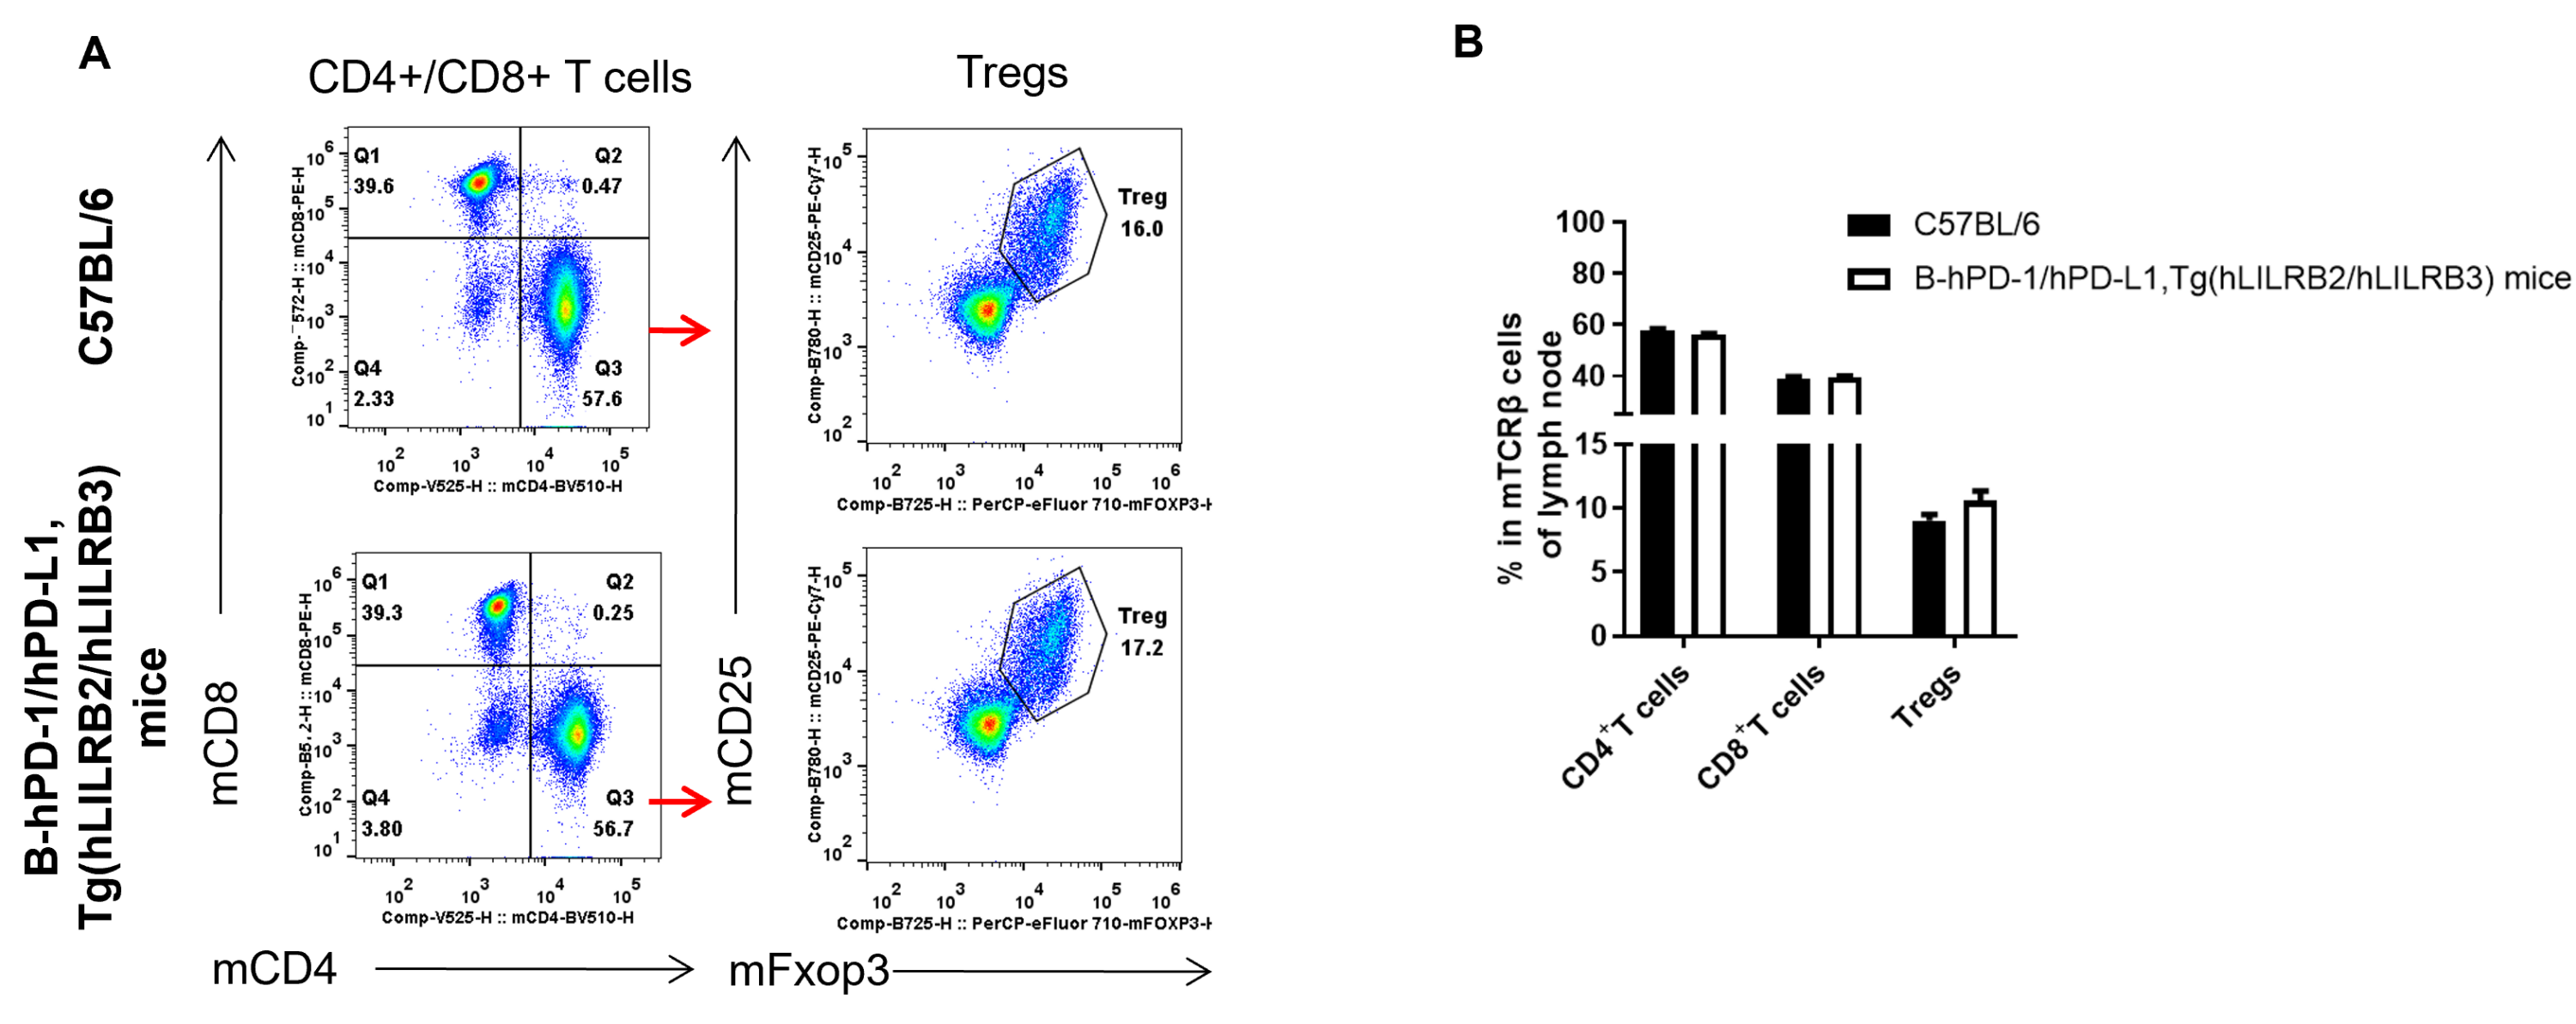
Analysis of lymph node T cell subpopulations by FACS. Leukocytes were isolated from female C57BL/6 and B-hPD-1/hPD-L1, Tg(hLILRB2/hLILRB3) mice(n=3, 7-week-old). Flow cytometry analysis of the leukocytes was performed to assess leukocyte subpopulations. A. Representative FACS plots. Single live CD45+ cells were gated for TCRβ+ T cell population and used for further analysis as indicated here. B. Results of FACS analysis. The percent of CD8+ T cells, CD4+ T cells, and Tregs in B-hPD-1/hPD-L1, Tg(hLILRB2/hLILRB3) mice were similar to those in the C57BL/6 mice. Values are expressed as mean ± SEM.
-
Analysis of blood leukocytes
-
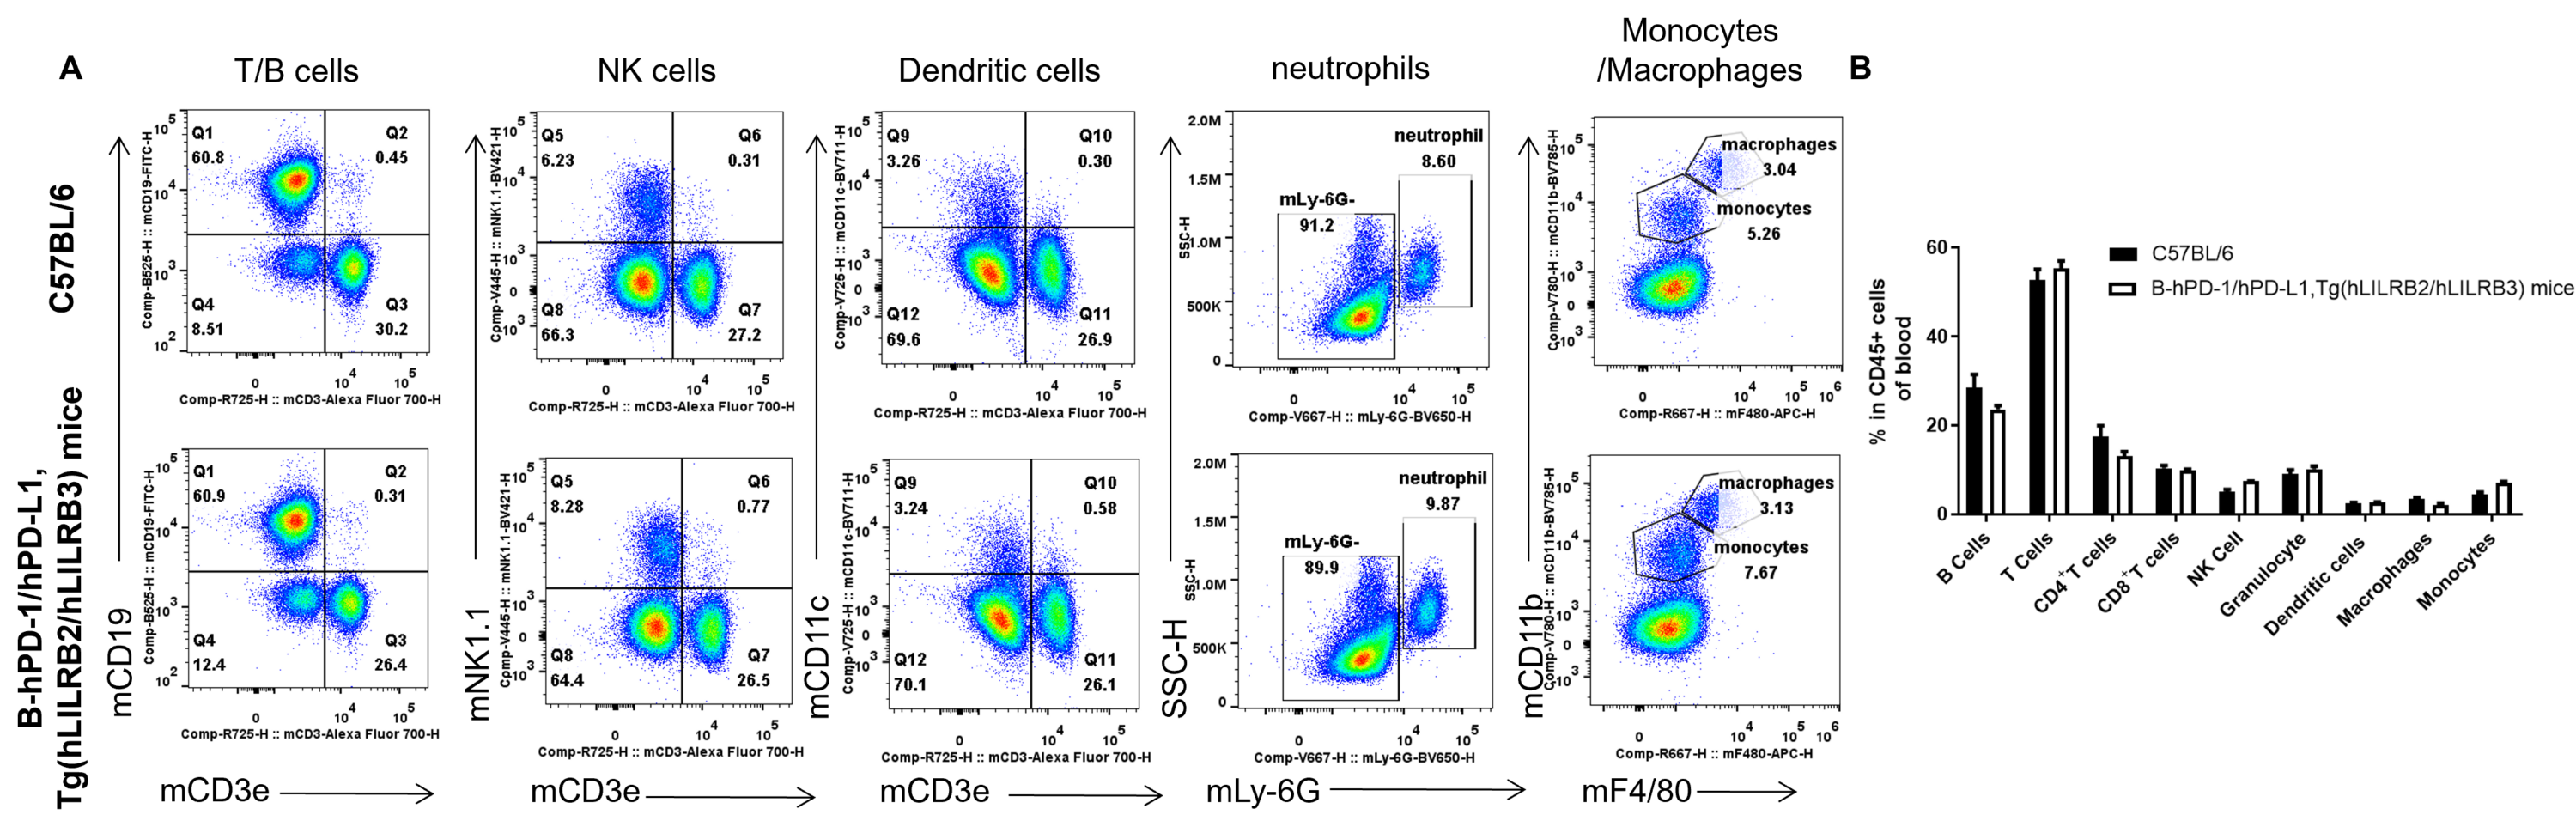
Analysis of blood leukocyte subpopulations by FACS. Leukocytes were isolated from female C57BL/6 and B-hPD-1/hPD-L1, Tg(hLILRB2/hLILRB3) mice(n=3, 7-week-old). Flow cytometry analysis of the blood was performed to assess leukocyte subpopulations. A. Representative FACS plots. Single live cells were gated for the CD45+ population and used for further analysis as indicated here. B. Results of FACS analysis. Percent of T cells, B cells, NK cells, dendritic cells, neutrophils, monocytes and macrophages in B-hPD-1/hPD-L1, Tg(hLILRB2/hLILRB3) mice were similar to those in the C57BL/6 mice. Values are expressed as mean ± SEM.
-
Analysis of blood T cells
-
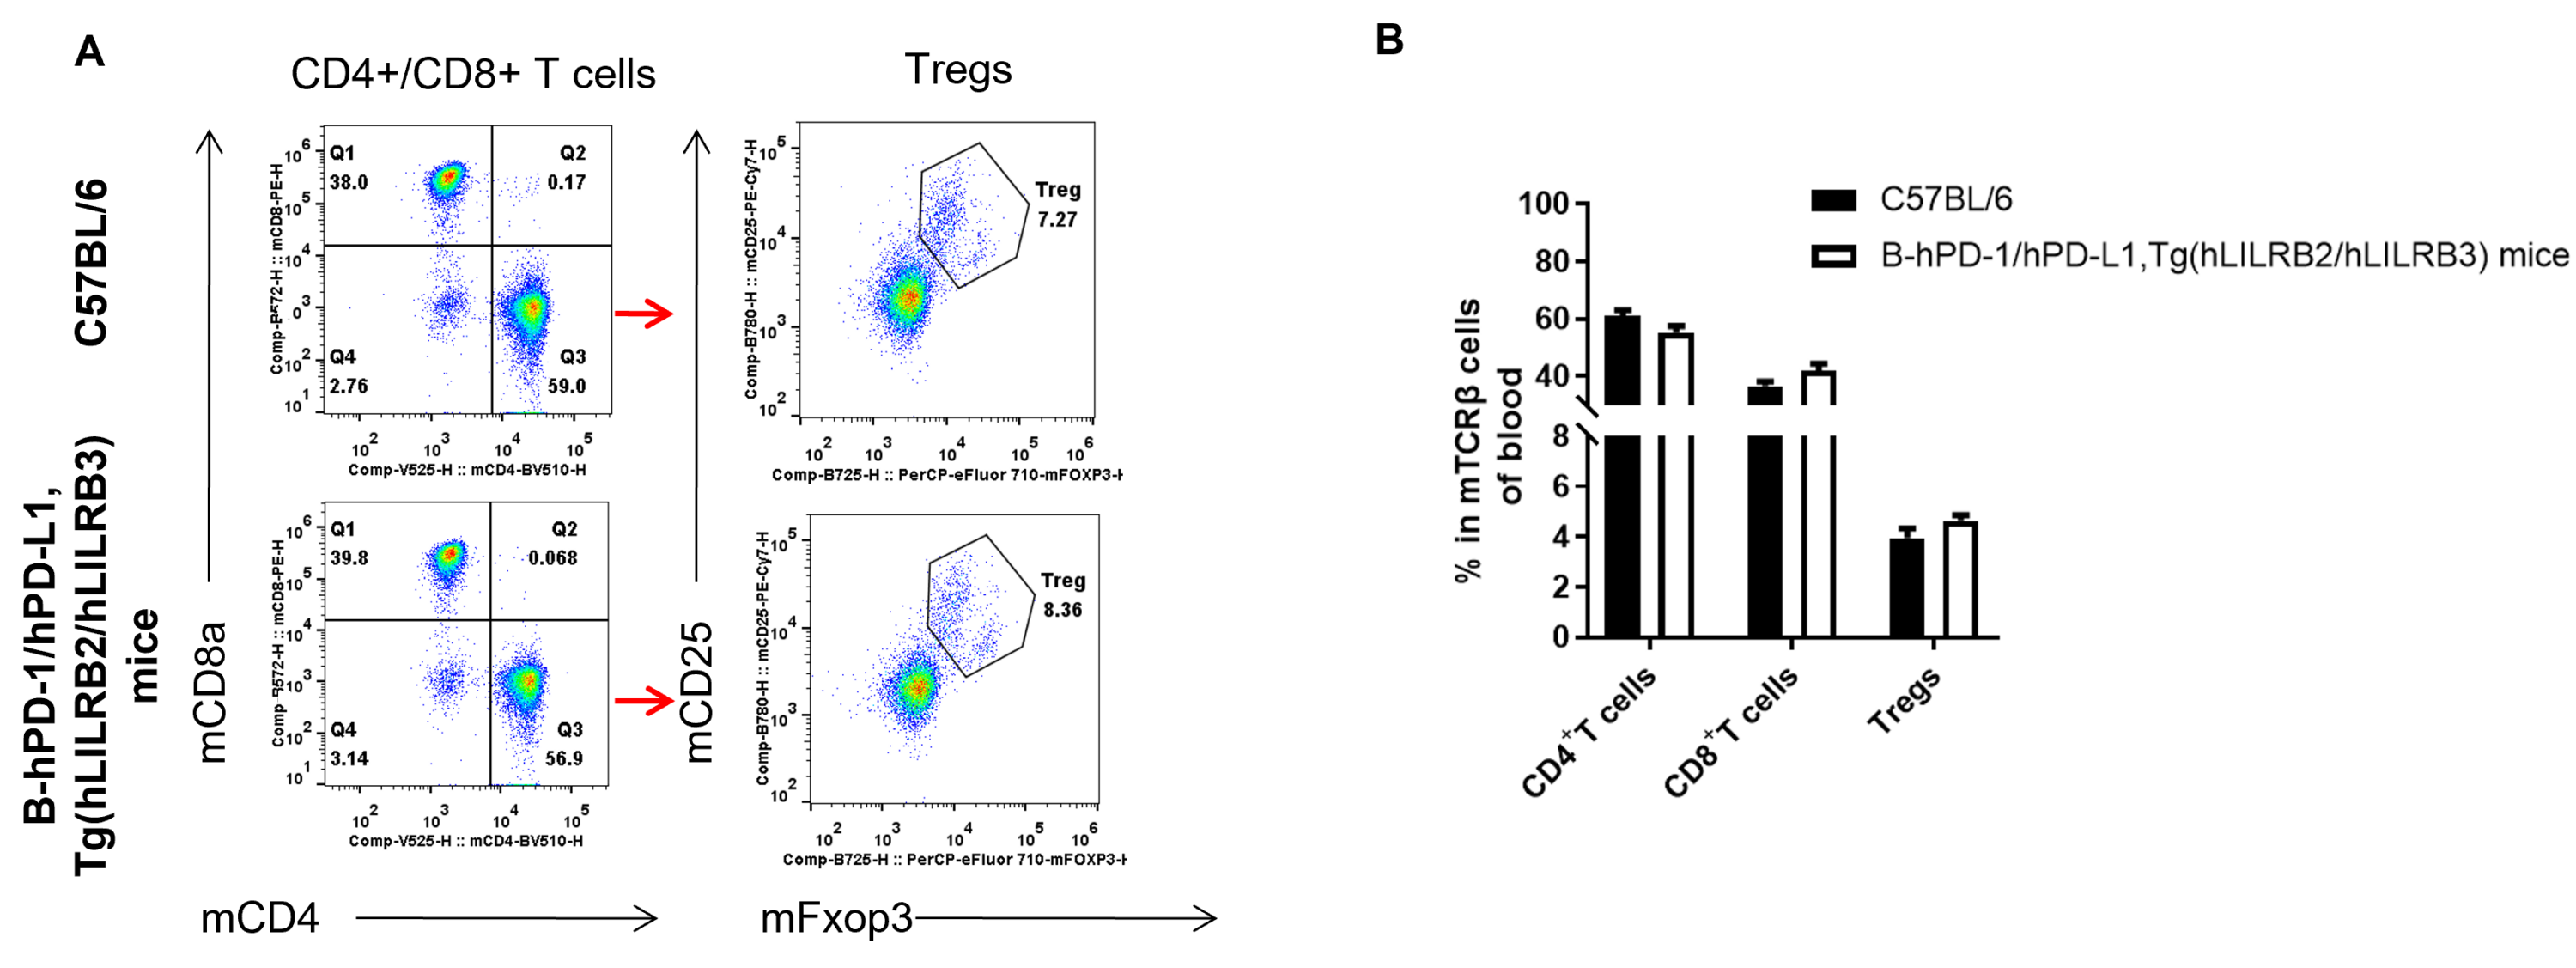
Analysis of blood T cell subpopulations by FACS. Leukocytes were isolated from female C57BL/6 and B-hPD-1/hPD-L1, Tg(hLILRB2/hLILRB3) mice(n=3, 7-week-old). Flow cytometry analysis of the blood was performed to assess leukocyte subpopulations. A. Representative FACS plots. Single live CD45+ cells were gated for TCRβ+ T cell population and used for further analysis as indicated here. B. Results of FACS analysis. The percent of CD8+ T cells, CD4+ T cells, and Tregs in B-hPD-1/hPD-L1, Tg(hLILRB2/hLILRB3) mice were similar to those in the C57BL/6 mice. Values are expressed as mean ± SEM.
