
Basic Information
-
Targeting Strategy

-
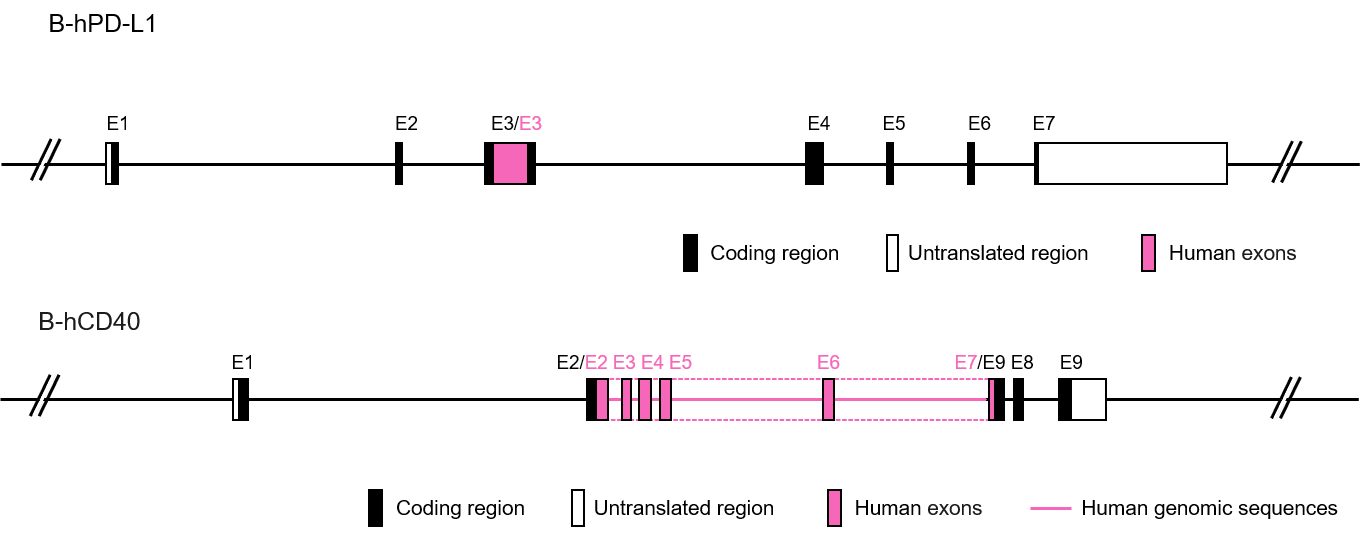
Gene targeting strategy for B-hPD-L1/hCD40 mice. The exon 3 of mouse Pd-l1 gene that encodes the extracellular domain was replaced by human PD-L1 exon 3 and the exons 2-7 of mouse Cd40 gene that encode the extracellular domain were replaced by human CD40 exons 2-7 in B-hPD-L1/hCD40 mice.
-
Details
-
Protein expression analysis
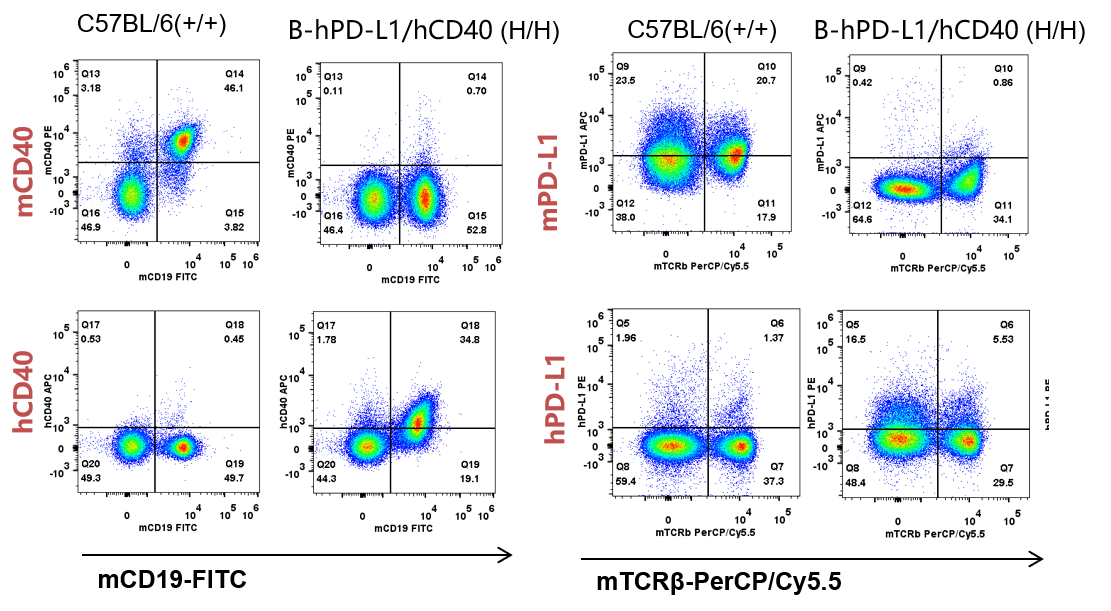
Strain specific CD40 and PD-L1 expression analysis in homozygous B-hPD-L1/hCD40 mice by flow cytometry. Splenocytes were collected from WT and homozygous B-hPD-L1/hCD40 (H/H) mice analyzed by flow cytometry with species-specific anti-PD-L1 antibody and anti-CD40 antibody. Mouse CD40 and PD-L1 were detected in WT. Human CD40 and PD-L1 were exclusively detected in H/H B-hPD-L1/hCD40 but not WT mice.

Strain specific CD40 and PD-L1 expression analysis in homozygous B-hPD-L1/hCD40 mice by flow cytometry. Splenocytes were collected from WT and homozygous B-hPD-L1/hCD40 (H/H) mice stimulated with anti-CD3ε in vivo (7.5 μg/mice), and analyzed by flow cytometry with species-specific anti-PD-L1 antibody. Mouse CD40 and PD-L1 were detected in WT. Human CD40 and PD-L1 were exclusively detected in H/H B-hPD-L1/hCD40 but not WT mice.
Combination therapy of PD-L1 mAb and CD40 mAb
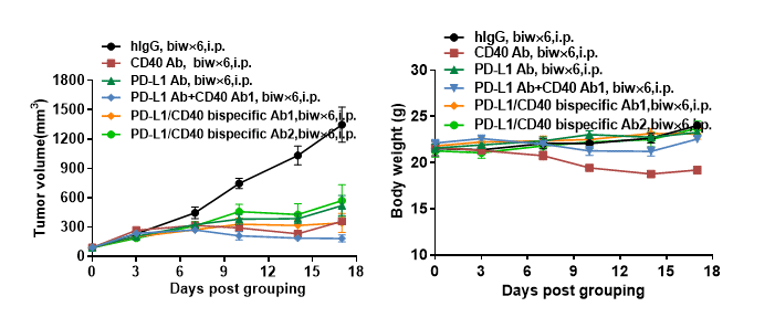
Antitumor activity of anti-hCD40 antibody combined with anti-hPD-L1 antibody in B-hPD-L1/hCD40 mice. (A) Anti-hCD40 antibody combined with anti-hPD-L1 antibodies inhibited MC38-hPD-L1 tumor growth in B-hPD-L1/hCD40 mice. Murine colon cancer MC38-hPD-L1 cells (5×10⁵) were subcutaneously implanted into homozygous B-hPD-L1/hCD40 mice (female, 6-8 week-old, n=5). Mice were grouped when tumor volume reached approximately 80-120 mm3, at which time they were treated with Anti-hCD40 antibody combined with anti-hPD-L1 antibody and schedules indicated in panel. (B) Body weight changes during treatment. As shown in panel A, combination of anti-hCD40 antibody and anti-hPD-L1 antibody shows more inhibitory effects than individual groups, demonstrating that the B-hPD-L1/hCD40 mice provide a powerful preclinical model for in vivo evaluating combination therapy efficacy of hCD40 antibodies and hPD-L1 antibodies . Statistical results showed significant weight loss in both G2 and G4 groups. As shown in panel B , anti-CD40 antibody significantly reduced body weight ,combination with PD-L1 antibody could relieve this symptom well.Values are expressed as mean ± SEM.
Blood chemistry of B-hPD-L1/hCD40 mice
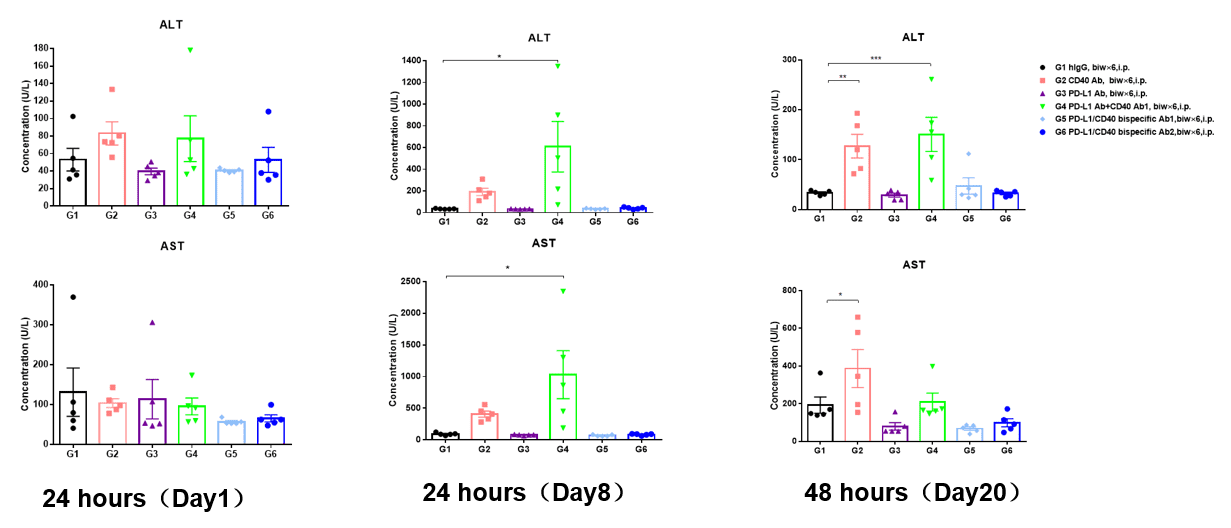
Blood chemistry tests of B-hPD-L1/hCD40 mice. Serum from the C57BL/6 and B-hPD-L1/hCD40 mice (n=5, 6-8 week-old) was analyzed for levels of ALT (alanine aminotransferase) and AST (aspartate aminotransferase). At 24 hours after the first dose (Day 1), statistical analysis was performed using one way ANOWA for each group compared with G1 control group. The results showed that there was no statistical difference in ALT and AST levels between each group and G1 group. After the third dose for 24 hours (Day 8), statistical analysis was performed for each group compared with G1 control group. The results showed that ALT and AST levels in G4 group (PD-L1 Ab+ CD40 Ab) were significantly increased (P < 0.05). At 48 hours after last dose (Day 20), statistical analysis was performed for each group compared with G1 control group. The results showed that ALT and AST levels in G2 group (CD40 Ab) were significantly increased (P < 0.01, P < 0.05), and ALT levels in G4 group (PD-L1 Ab+ CD40 Ab) were significantly increased (P < 0.001)
Activated cells (T cells, CD8 T cells, and B cells) make up the lymphocyte population in B-hPD-L1/hCD40 mice
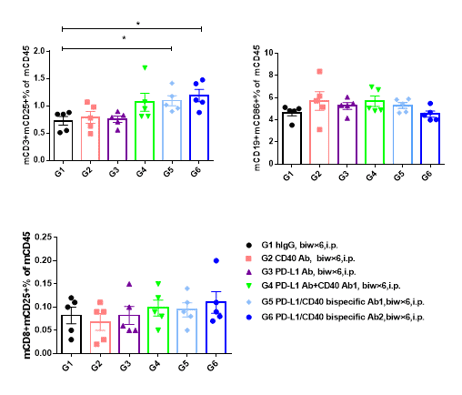
48 hours after the first dose, peripheral blood was collected and analyzed for activation of T and B cells by flow cytometry. 48 hours after the first administration, in the peripheral blood, the proportion of activated T cells (CD25 CD3% of CD45 cells) was significantly increased in the PD-L1/CD40 bispecific Ab treatment group compared with the G1 control group (P < 0.05), and the activated T cells was significantly increased in the G4 group (PD-L1 Ab+ CD40 Ab), but there was no statistically significant difference. In addition, there was no significant change in activated CD8 T cells (CD25 CD8% of CD45 cells) and activated B cells (CD86 CD19% of CD45 cells) in each treatment group compared with the G1 control group.
Proliferation of T cells, activation of B cells and DC cells in TILs
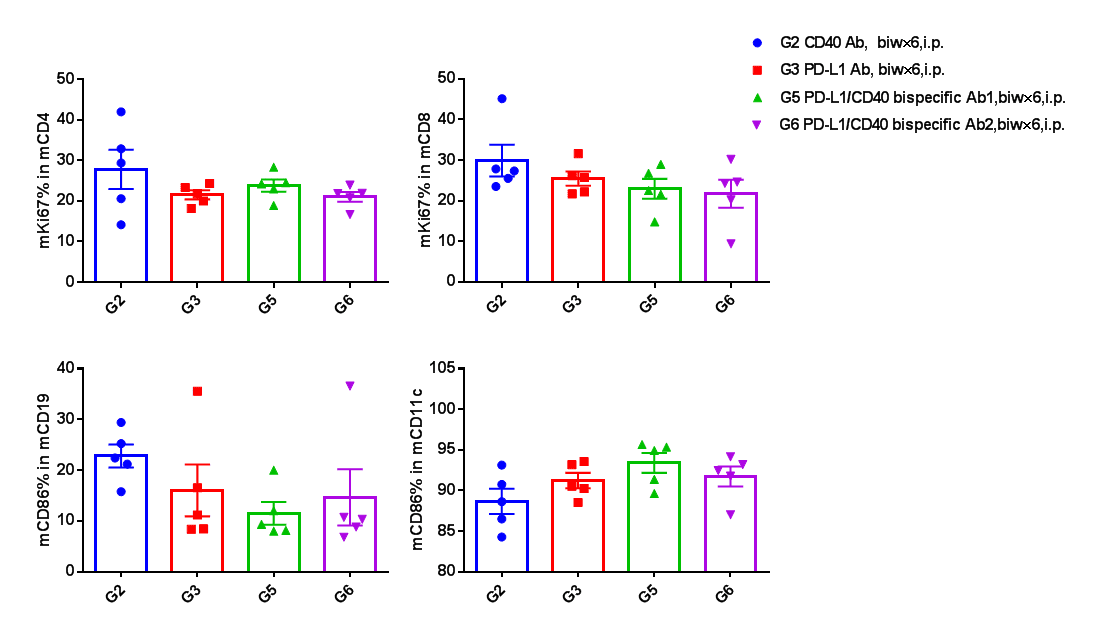
Proliferation of T cells, activation of B cells and DC cells in TILs. In tumors, there were no significant differences in the proliferation of T cells, activation of B cells and DC cells in each treatment group.
-
References
-
- Clin Cancer Res 2016; published online Nov 8. DOI:10.1158/1078-0432.CCR-16-1741
- Blood First Edition paper, May 11, 2010; DOI 10.1182/blood-2010-02-271874.
- J Immunol published online 1 May 2017. doi:10.4049/jimmunol.1601490
