
Basic Information
-
Gene targeting strategy

-
Gene targeting strategy for B-hTIGIT mice(C).
The exon 2 of mouse Tigit gene that encodes the extracellular region was replaced by human TIGIT exon 2 in B-hTIGIT mice(C).
-
Protein expression analysis
-
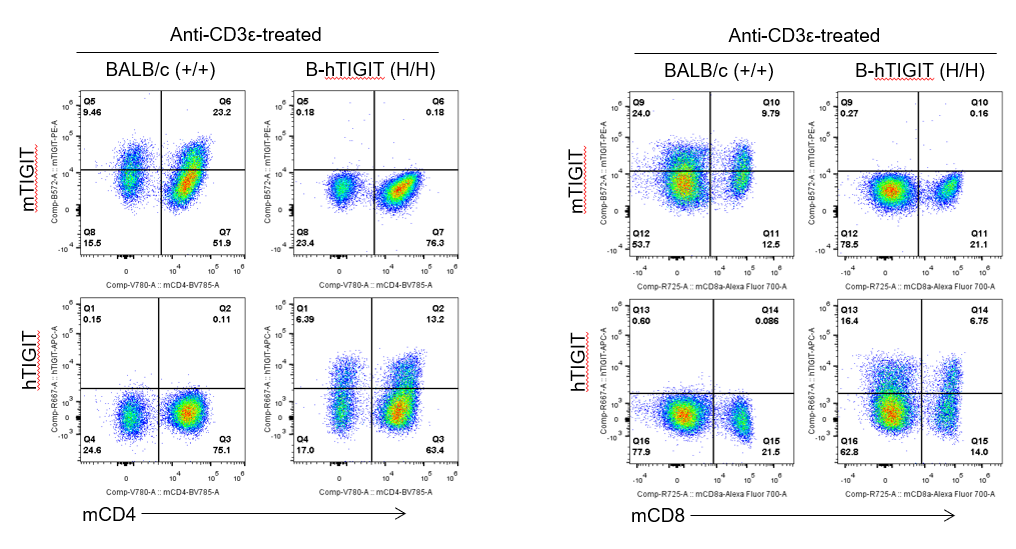
Strain specific TIGIT expression analysis in homozygous B-hTIGIT mice(C) by flow cytometry. Splenocytes were collected from wild-type BALB/c mice (+/+) and homozygous B-hTIGIT mice(C) (H/H) stimulated with anti-CD3ε in vivo, and analyzed by flow cytometry with species-specific anti-TIGIT antibody. Mouse TIGIT was detectable on CD4+ T cells and CD8+ T cells of wild-type mice. Human TIGIT was exclusively detectable on CD4+ T cells and CD8+ T cells of homozygous B-hTIGIT mice(C) but not in wild-type mice.
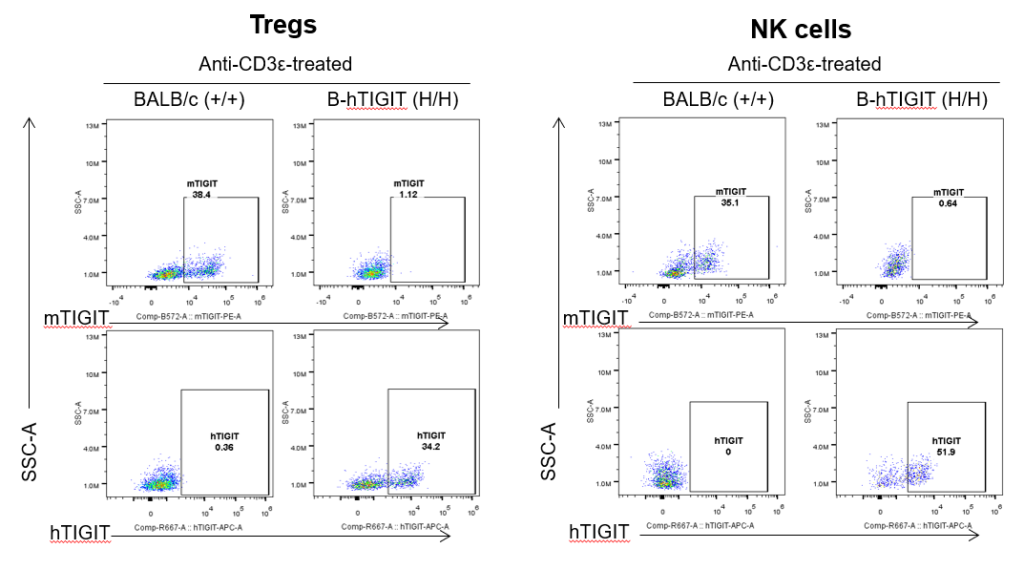
Strain specific TIGIT expression analysis in homozygous B-hTIGIT mice(C) by flow cytometry. Splenocytes were collected from wild-type BALB/c mice (+/+) and homozygous B-hTIGIT mice(C) (H/H) stimulated with anti-CD3ε in vivo, and analyzed by flow cytometry with species-specific anti-TIGIT antibody. Mouse TIGIT was detectable on Tregs and NK cells of wild-type mice. Human TIGIT was exclusively detectable on Treg cells and NK cells of homozygous B-hTIGIT mice(C) but not in wild-type mice.
-
Analysis of leukocytes cell subpopulation in spleen
-
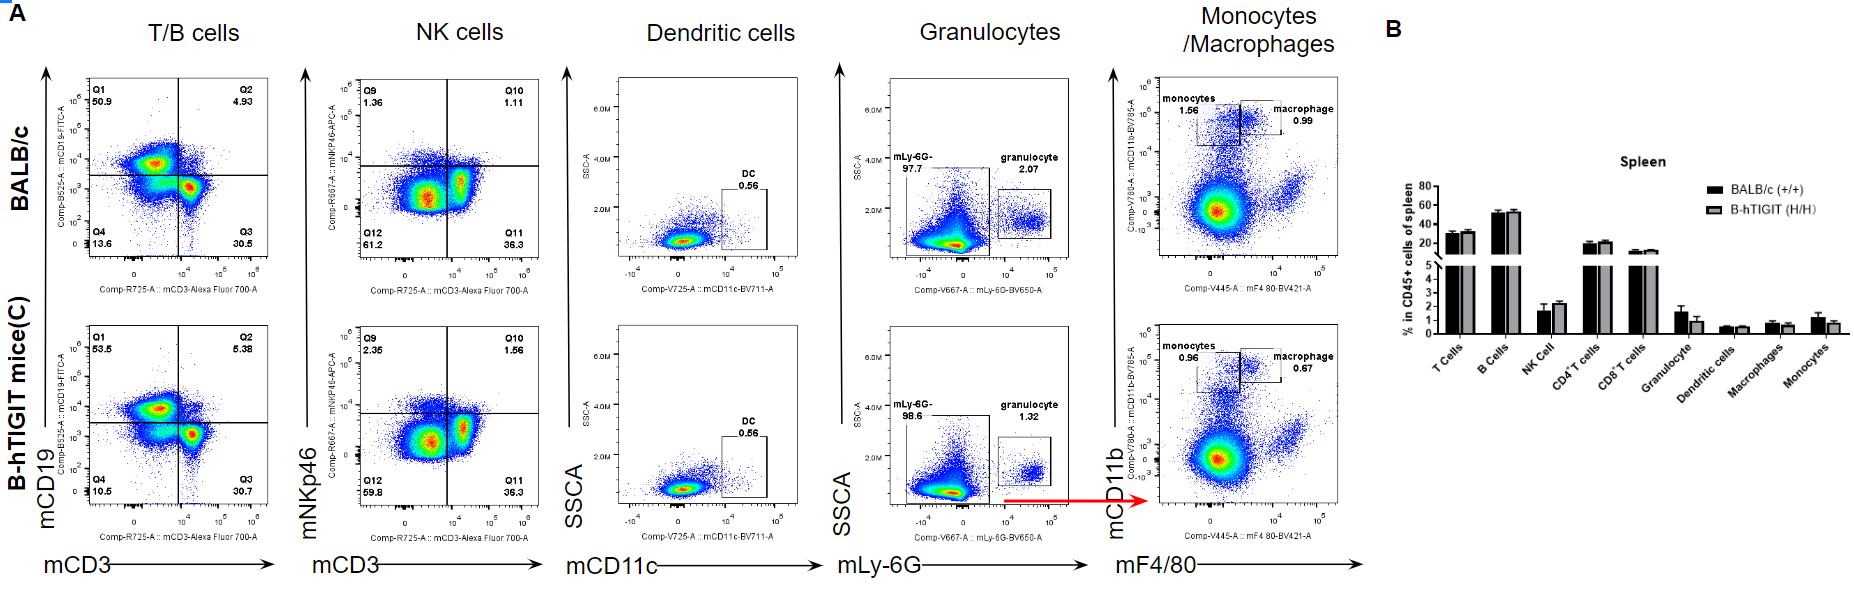
Analysis of spleen leukocyte subpopulations by FACS. Splenocytes were isolated from female BALB/c and B-hTIGIT mice(C) (n=3, 6-week-old). Flow cytometry analysis of the splenocytes was performed to assess leukocyte subpopulations. A. Representative FACS plots. Single live cells were gated for the CD45+ population and used for further analysis as indicated here. B. Results of FACS analysis. Percent of T cells, B cells, NK cells, dendritic cells, granulocytes, monocytes and macrophages in homozygous B-hTIGIT mice(C) were similar to those in the BALB/c mice, demonstrating that TIGIT humanized does not change the overall development, differentiation or distribution of these cell types in spleen. Values are expressed as mean ± SEM.
-
Analysis of T cell subpopulation in spleen
-
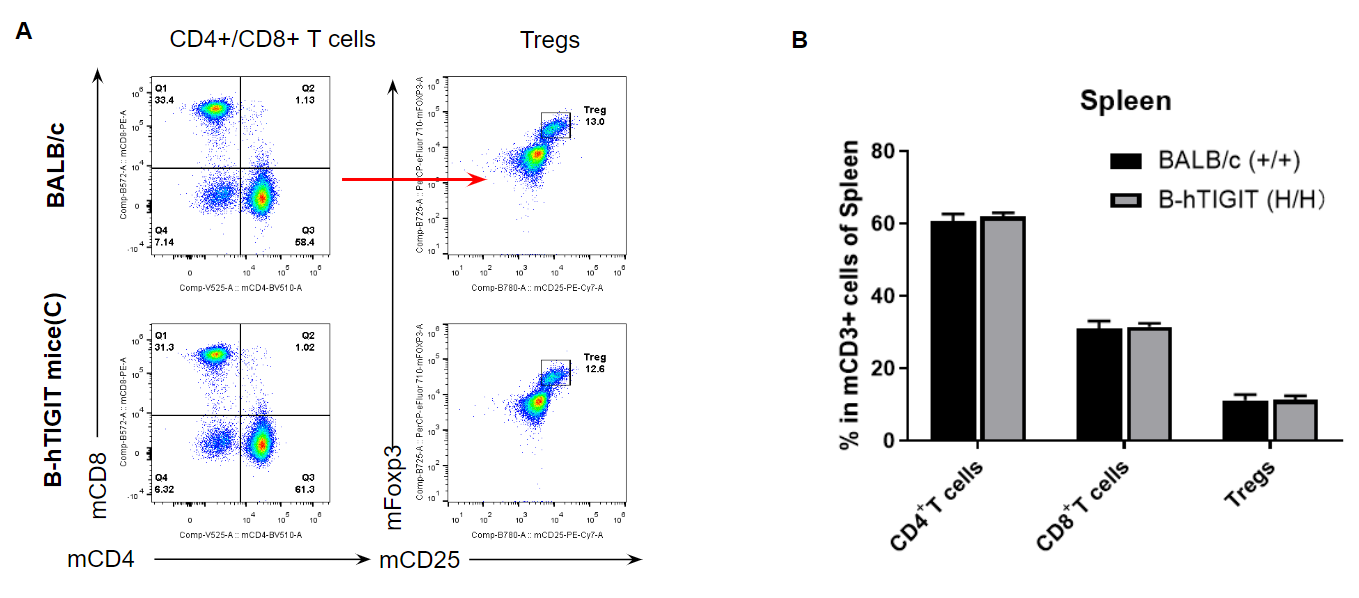
Analysis of spleen T cell subpopulations by FACS. Splenocytes were isolated from female BALB/c and B-hTIGIT mice(C) (n=3, 6-week-old). Flow cytometry analysis of the splenocytes was performed to assess leukocyte subpopulations. A. Representative FACS plots. Single live cells were gated for CD3+ T cell population and used for further analysis as indicated here. B. Results of FACS analysis. The percent of CD4+ T cells, CD8+ T cells and Tregs in homozygous B-hTIGIT mice(C) were similar to those in the BALB/c mice, demonstrating that TIGIT humanized does not change the overall development, differentiation or distribution of these T cell subtypes in spleen. Values are expressed as mean ± SEM.
-
Analysis of leukocytes cell subpopulation in lymph node
-
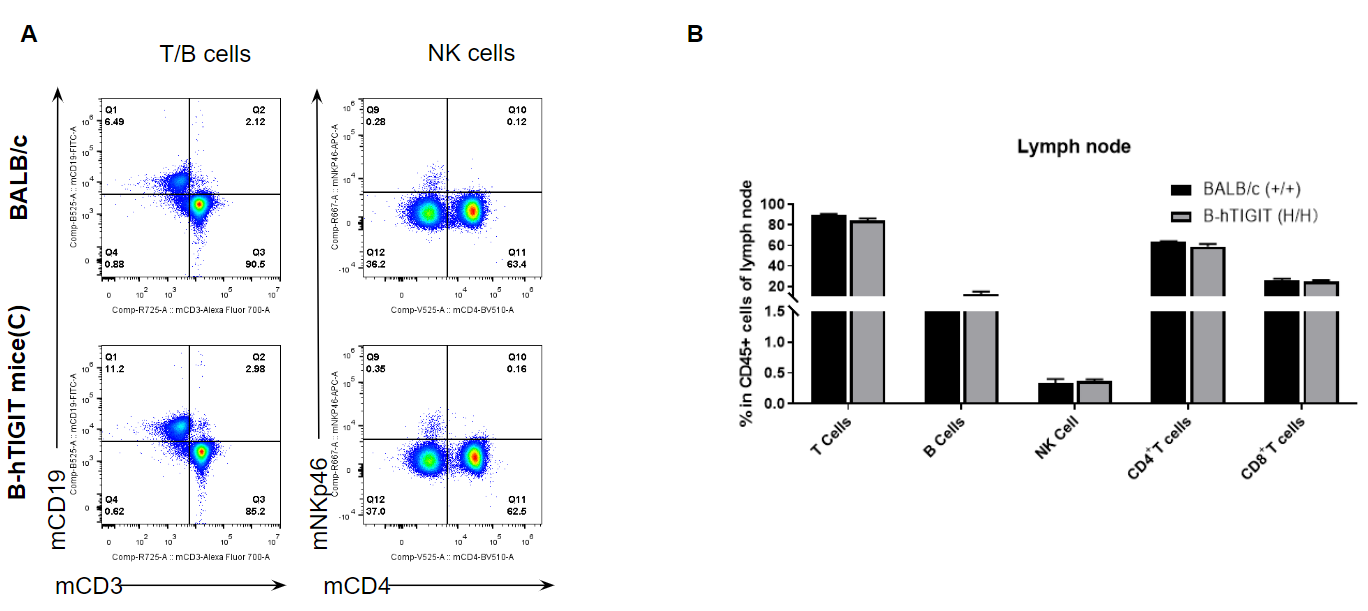
Analysis of lymph node leukocyte subpopulations by FACS. Lymph node was isolated from female BALB/c and B-hTIGIT mice(C) (n=3, 6-week-old). Flow cytometry analysis of the leukocytes was performed to assess leukocyte subpopulations. A. Representative FACS plots. Single live cells were gated for the CD45+ population and used for further analysis as indicated here. B. Results of FACS analysis. Percent of T cells, B cells and NK cells in homozygous B-hTIGIT mice(C) were similar to those in the BALB/c mice, demonstrating that TIGIT humanized does not change the overall development, differentiation or distribution of these cell types in lymph node. Values are expressed as mean ± SEM.
-
Analysis of leukocytes cell subpopulation in blood
-
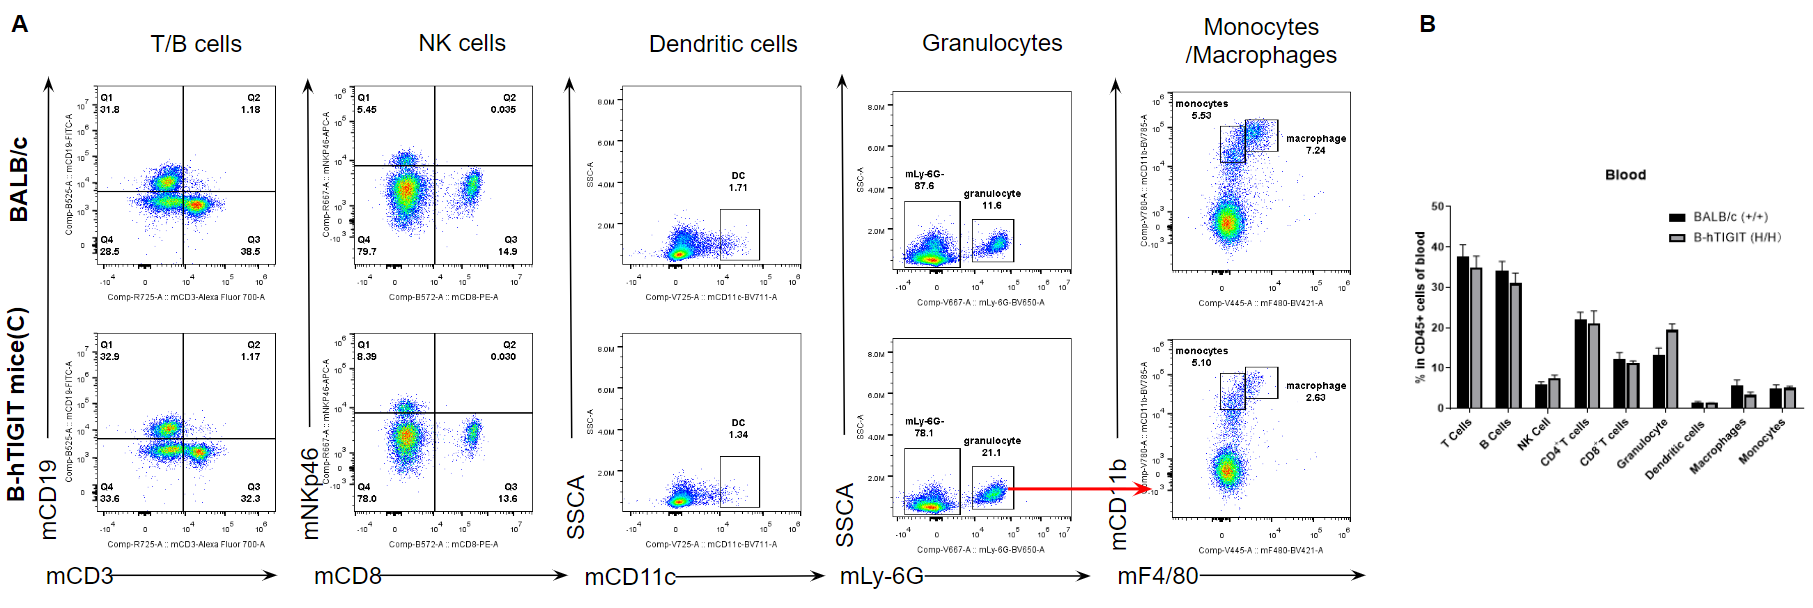
Analysis of blood leukocyte subpopulations by FACS. Blood was isolated from female BALB/c and B-hTIGIT mice(C) (n=3, 6-week-old). Flow cytometry analysis was performed to assess leukocyte subpopulations. A. Representative FACS plots. Single live cells were gated for the CD45+ population and used for further analysis as indicated here. B. Results of FACS analysis. Percent of T cells, B cells, NK cells, dendritic cells, granulocytes, monocytes and macrophages in homozygous B-hTIGIT mice(C) were similar to those in the BALB/c mice, demonstrating that TIGIT humanized does not change the overall development, differentiation or distribution of these cell types in blood. Values are expressed as mean ± SEM.
-
In vivo efficacy of anti-human TIGIT antibody
-
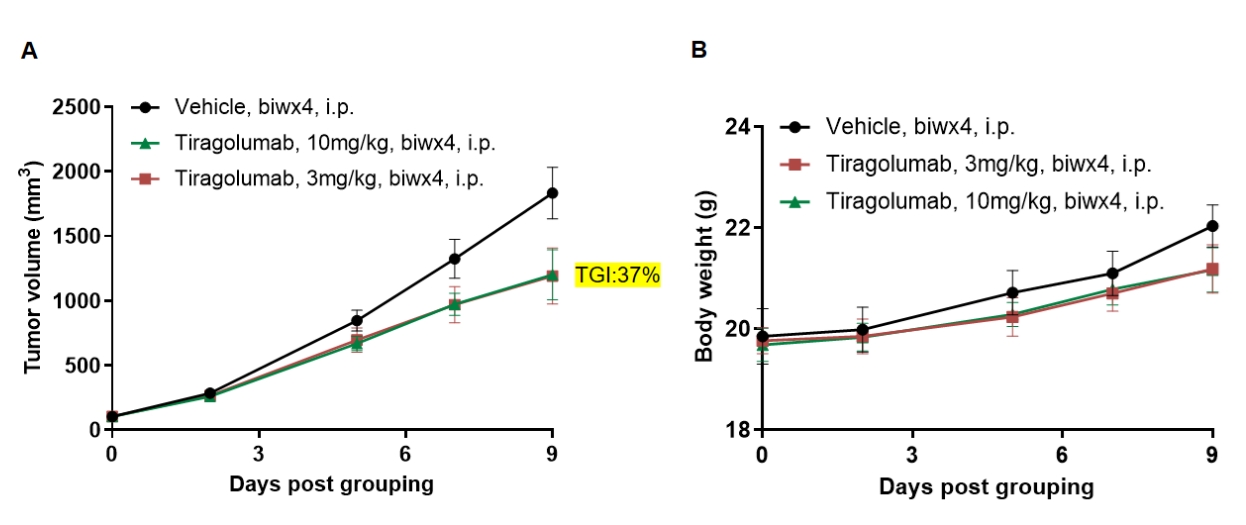
Antitumor activity of anti-human TIGIT antibody Tiragolumab (in house) in B-hTIGIT mice(C). (A) Anti-human TIGIT antibody inhibited CT26 tumor growth in B-hTIGIT mice(C). Murine colon cancer CT26 cells were subcutaneously implanted into homozygous B-hTIGIT mice(C) (female, 8-week-old, n=6). Mice were grouped when tumor volume reached approximately 80-120 mm3, at which time they were treated with anti-human TIGIT antibody with doses and schedules indicated with red arrows in panel A. (B) Body weight changes during treatment. As shown in panel A, anti-human TIGIT antibody were efficacious in controlling tumor growth in B-hTIGIT mice(C), demonstrating that the B-hTIGIT mice(C) provide a powerful preclinical model for in vivo evaluation of anti-human TIGIT antibodies. Values are expressed as mean ± SEM.
-
Summary
-
- Protein expression analysis:
Human TIGIT was exclusively detectable on CD4+ T cells, CD8+ T cells, NK cells and Tregs of homozygous B-hTIGIT mice(C) but not in wild-type mice.
- Leukocytes cell subpopulation analysis:
TIGIT humanized does not change the overall development, differentiation or distribution of immune cell types in spleen, lymph node and blood.
- In vivo efficacious:
Anti-human TIGIT antibody were efficacious in controlling tumor growth in B-hTIGIT mice(C).
