
Basic Information
-
mRNA expression analysis

-
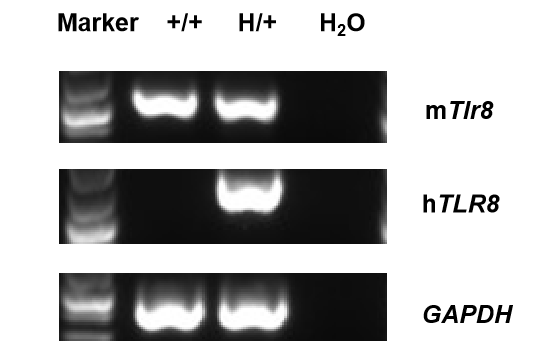
Strain specific analysis of TLR8 gene expression in wild-type C57BL/6 mice mice and heterozygote hTLR8 mice by RT-PCR. Mouse Tlr8 mRNA was detectable in wild-type C57BL/6 mice (+/+). Human TLR8 mRNA was detectable only in heterozygote B-hTLR8 but not in wild-type mice.
-
Protein expression analysis in DC cells
-
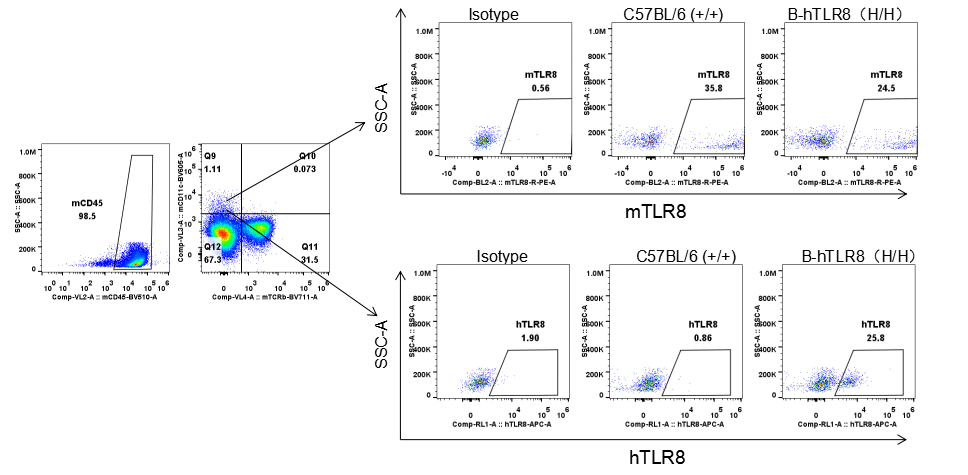
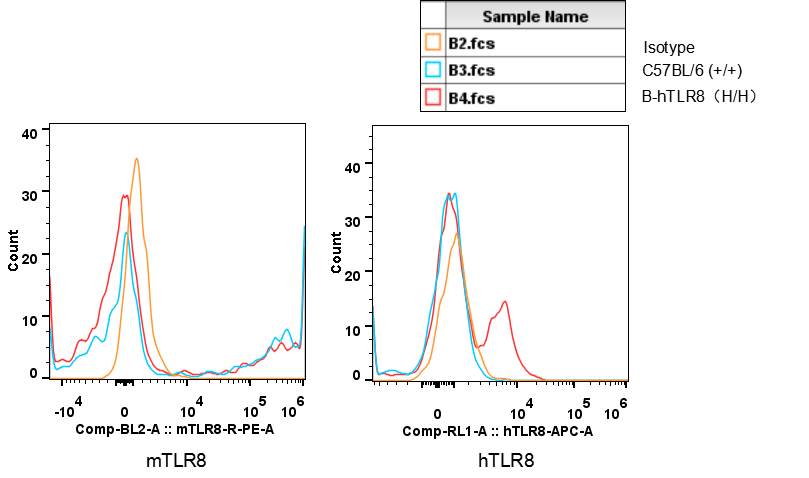
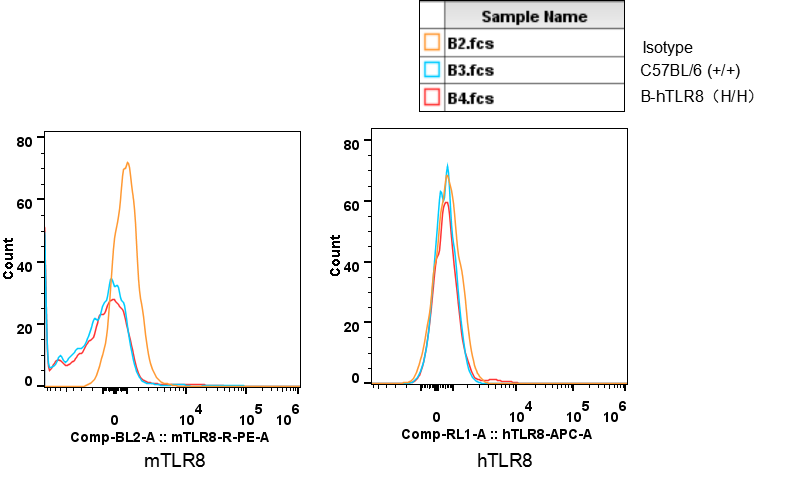
Splenocytes were collected from WT and homozygous B-hTLR8 (H/H) mice, and analyzed by flow cytometry with species-specific anti-TLR8 antibody. Mouse TLR8 was detectable in WT and homozygous B-hTLR8 mice compared to isotype due to the cross-reactivity of the anti-mTLR8 antibody between mice and humans.. Human TLR8 was exclusively detectable in homozygous B-hTLR8 mice compared to WT.
Splenocytes were collected from WT and homozygous B-hTLR8 (H/H) mice, and analyzed by flow cytometry with species-specific anti-TLR8 antibody. Mouse TLR8 was detectable in WT and homozygous B-hTLR8 mice compared to isotype due to the cross-reactivity of the anti-mTLR8 antibody between mice and humans.. Human TLR8 was exclusively detectable in homozygous B-hTLR8 mice compared to WT.
-
Protein expression analysis in monocytes
-
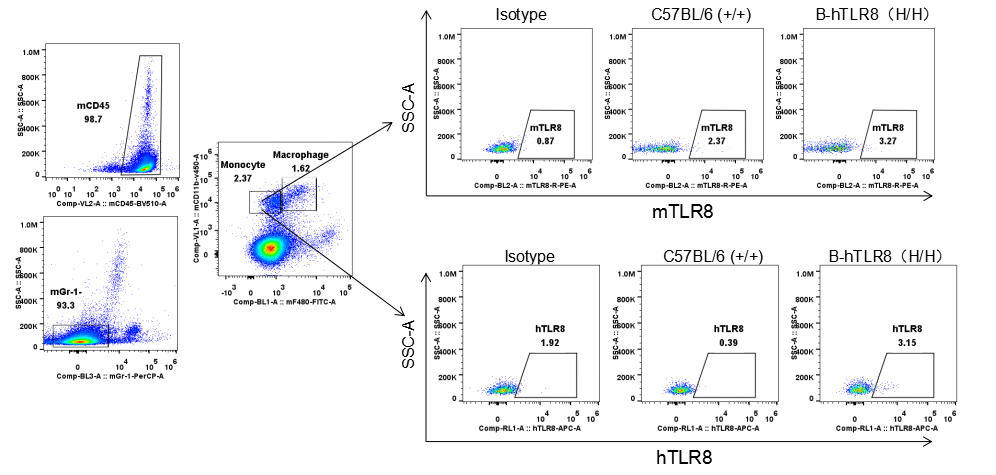
Splenocytes were collected from WT and homozygous B-hTLR8 (H/H) mice, and analyzed by flow cytometry with species-specific anti-TLR8 antibody. Mouse TLR8 was detectable in WT and homozygous B-hTLR8 mice compared to isotype due to the cross-reactivity of the anti-mTLR8 antibody between mice and humans. Human TLR8 was exclusively detectable in homozygous B-hTLR8 mice compared to WT.
Splenocytes were collected from WT and homozygous B-hTLR8 (H/H) mice, and analyzed by flow cytometry with species-specific anti-TLR8 antibody. Mouse TLR8 was detectable in WT and homozygous B-hTLR8 mice compared to isotype due to the cross-reactivity of the anti-mTLR8 antibody between mice and humans. Human TLR8 was exclusively detectable in homozygous B-hTLR8 mice compared to WT.
-
Function assay
-
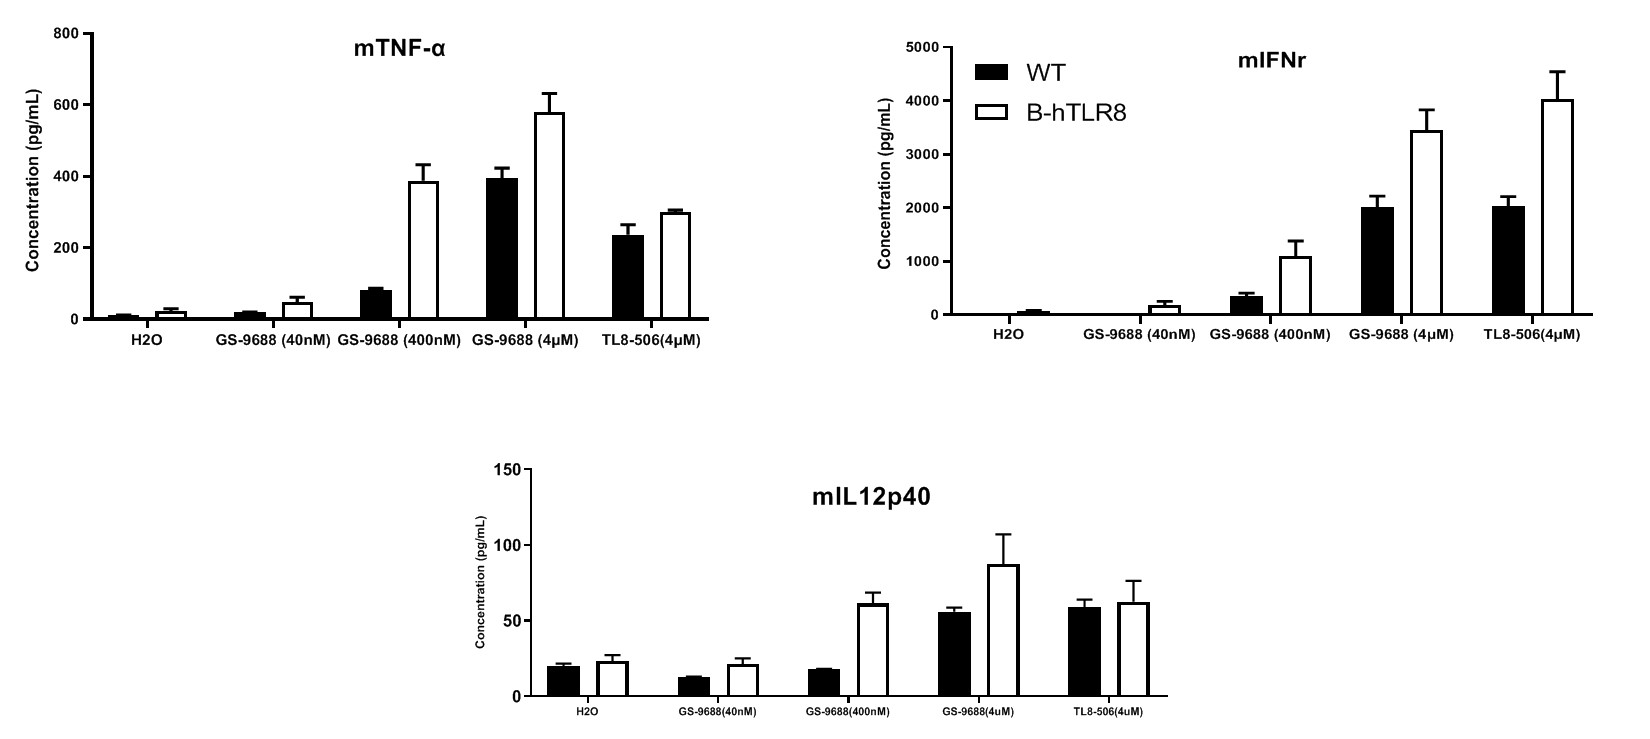
Function assay in homozygous B-hTLR8 mice by ELISA. TNFα, IFNγ and IL12p40 are important downstream cytokines in the NF-kb and IRF7 pathways. Splenocytes were collected from WT and homozygous B-hTLR8 (H/H) mice stimulated with TLR8 agonists TLR8-506 and GS-9688 (Selgantolimod) in vitro, and analyzed by mouse TNFα, IFNγ and IL12p40 ELISA kit. TNFα, IFNγ and IL12p40 secretion were enhanced in homozygous B-hTLR8 mice compared to wild-type mice due to the selectively high binding affinity to human TLR8, and The stimulation had dose-dependent effect with GS-9688 concentration.
-
Analysis of leukocytes cell subpopulation in spleen (6-week-old)
-
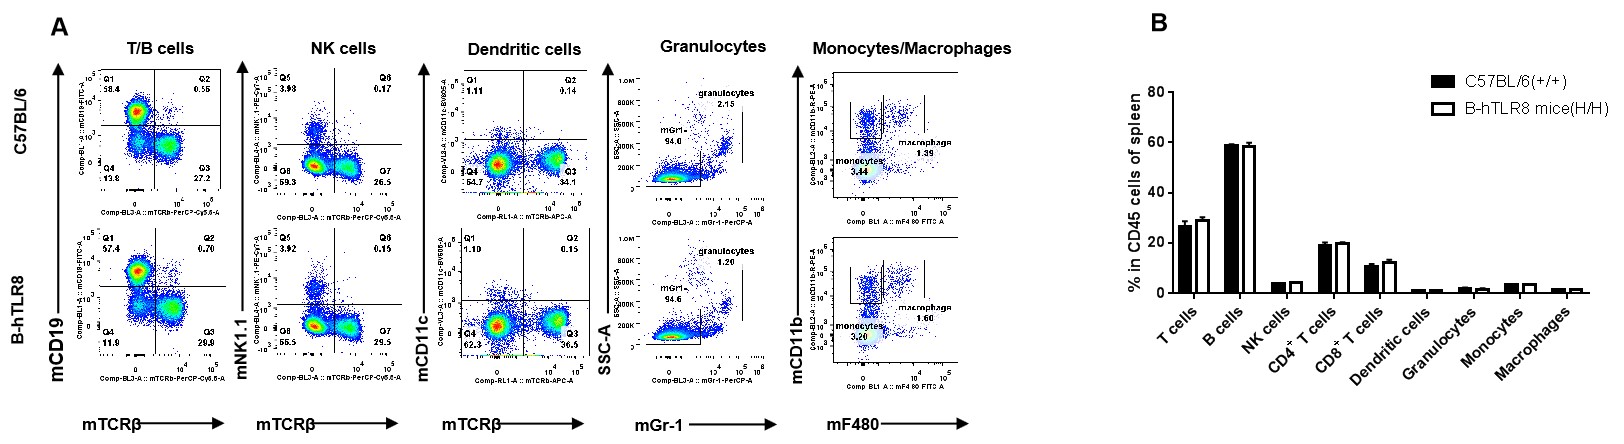
Analysis of spleen leukocyte subpopulations by FACS. Splenocytes were isolated from female C57BL/6 and B-hTLR8 mice (n=3, 6-week-old). Flow cytometry analysis of the splenocytes was performed to assess leukocyte subpopulations. A. Representative FACS plots. Single live cells were gated for the CD45+ population and used for further analysis as indicated here. B. Results of FACS analysis. Percent of T cells, B cells, NK cells, dendritic cells, granulocytes, monocytes and macrophages in homozygous B-hTLR8 mice were similar to those in the C57BL/6 mice, demonstrating that TLR8 humanized does not change the overall development, differentiation or distribution of these cell types in spleen.
-
Analysis of T cell subpopulation in spleen (6-week-old)
-
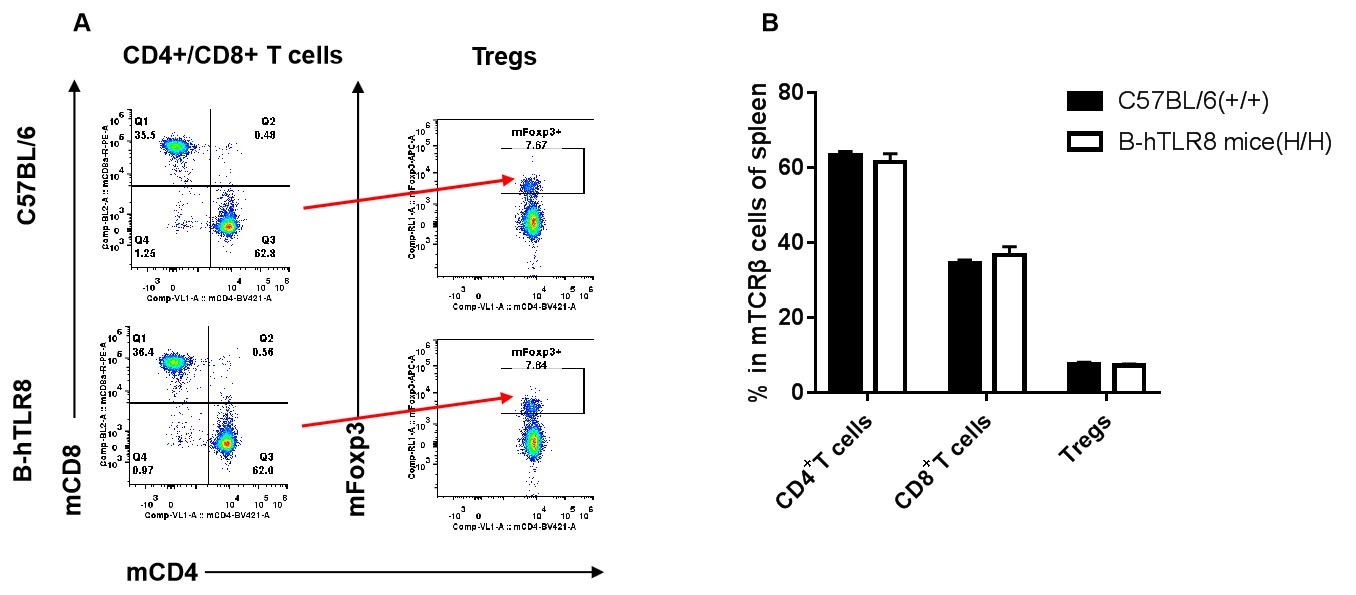
Analysis of spleen T cell subpopulations by FACS. Splenocytes were isolated from female C57BL/6 and B-hTLR8 mice (n=3, 6-week-old). Flow cytometry analysis of the splenocytes was performed to assess leukocyte subpopulations. A. Representative FACS plots. Single live CD45+ cells were gated for TCRβ+ T cell population and used for further analysis as indicated here. B. Results of FACS analysis. The percent of CD8+ T cells , CD4+ T cells and Tregs in homozygous B-hTLR8 mice were similar to those in the C57BL/6 mice, demonstrating that TLR8 humanized does not change the overall development, differentiation or distribution of these cell types in spleen.
-
Analysis of leukocytes cell subpopulation in lymph node (6-week-old)
-
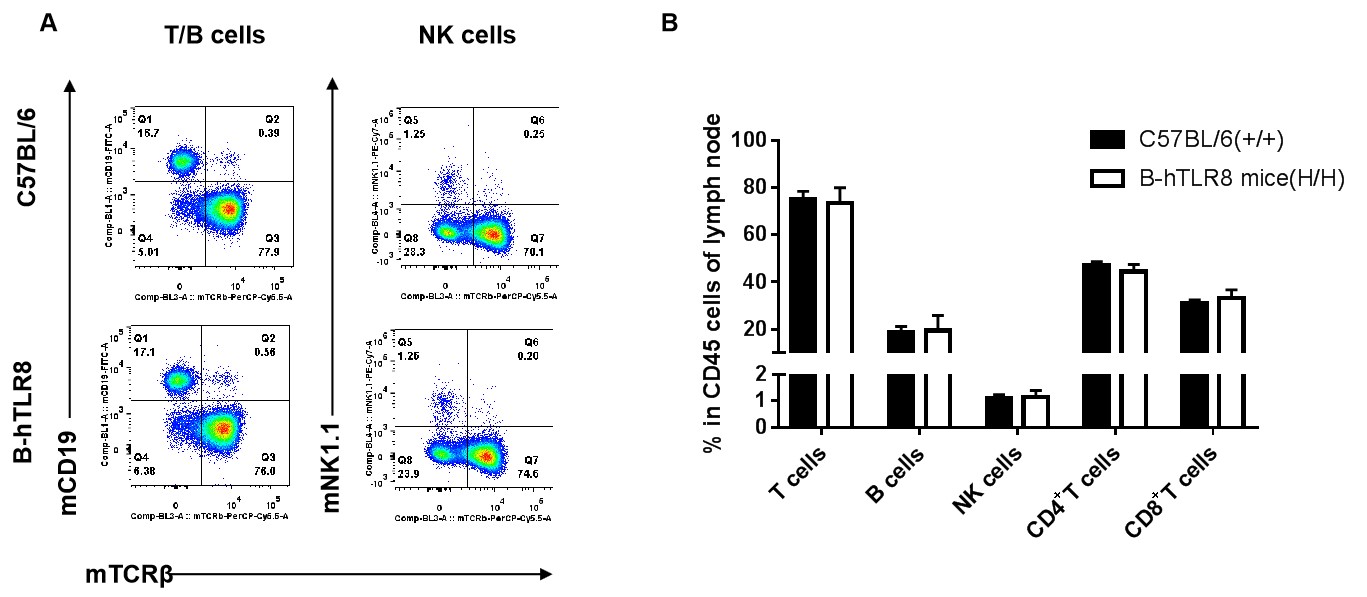
Analysis of LNs leukocyte subpopulations by FACS. LNs (Lymph nodes) were isolated from female C57BL/6 and B-hTLR8 mice (n=3, 6-week-old). Flow cytometry analysis of the LNs was performed to assess leukocyte subpopulations. A. Representative FACS plots. Single live cells were gated for the CD45+ population and used for further analysis as indicated here. B. Results of FACS analysis. Percent of T cells, B cells, NK cells in homozygous B-hTLR8 mice were similar to those in the C57BL/6 mice, demonstrating that TLR8 humanized does not change the overall development, differentiation or distribution of these cell types in LNs.
-
Analysis of T cell subpopulation in lymph node (6-week-old)
-
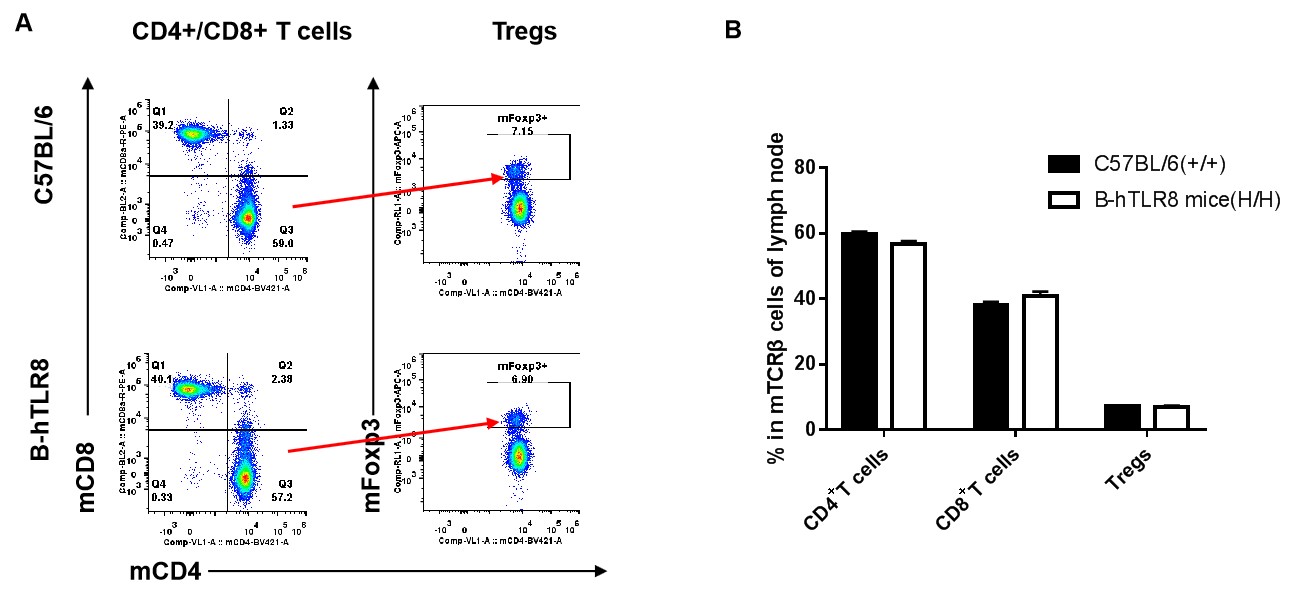
Analysis of LNs T cell subpopulations by FACS. LNs (Lymph nodes) were isolated from female C57BL/6 and B-hTLR8 mice (n=3, 6-week-old). Flow cytometry analysis of the LNs was performed to assess leukocyte subpopulations. A. Representative FACS plots. Single live CD45+ cells were gated for TCRβ+T cell population and used for further analysis as indicated here. B. Results of FACS analysis. The percent of CD8+ T cells , CD4+ T cells and Tregs in homozygous B-hTLR8 mice were similar to those in the C57BL/6 mice, demonstrating that TLR8 humanized does not change the overall development, differentiation or distribution of these cell types in LNs.
-
Analysis of leukocytes cell subpopulation in blood (6-week-old)
-
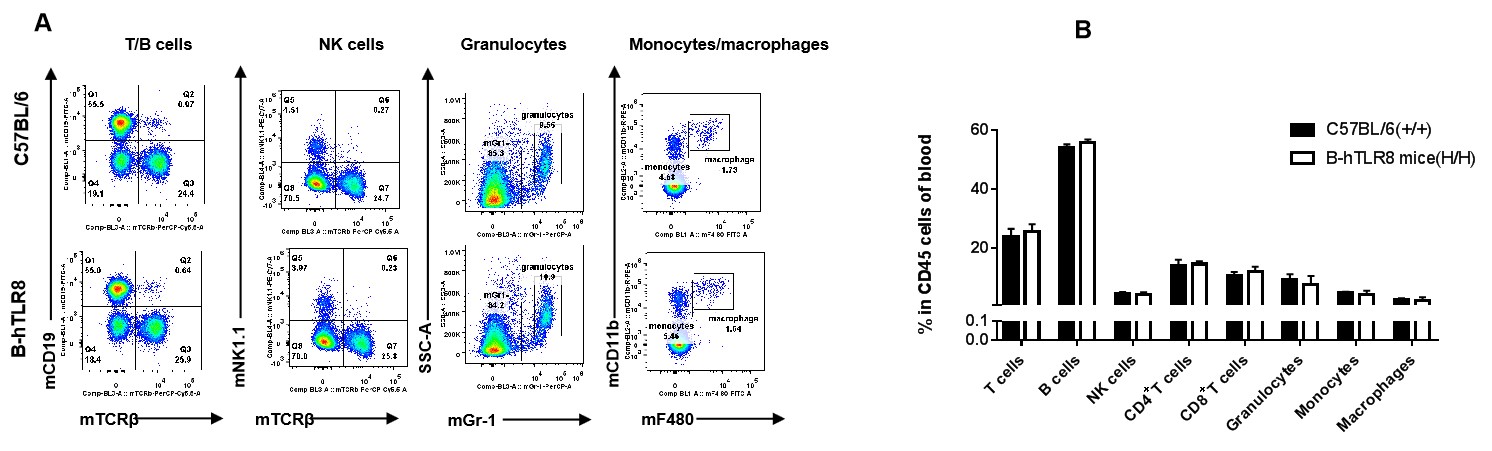
Analysis of blood leukocyte subpopulations by FACS. Blood were isolated from female C57BL/6 and B-hTLR8 mice (n=3, 6-week-old). Flow cytometry analysis of the blood was performed to assess leukocyte subpopulations. A. Representative FACS plots. Single live cells were gated for the CD45+ population and used for further analysis as indicated here. B. Results of FACS analysis. Percent of T cells, B cells, NK cells, granulocytes, monocytes and macrophages in homozygous B-hTLR8 mice were similar to those in the C57BL/6 mice, demonstrating that TLR8 humanized does not change the overall development, differentiation or distribution of these cell types in blood.
-
Analysis of T cell subpopulation in blood (6-week-old)
-
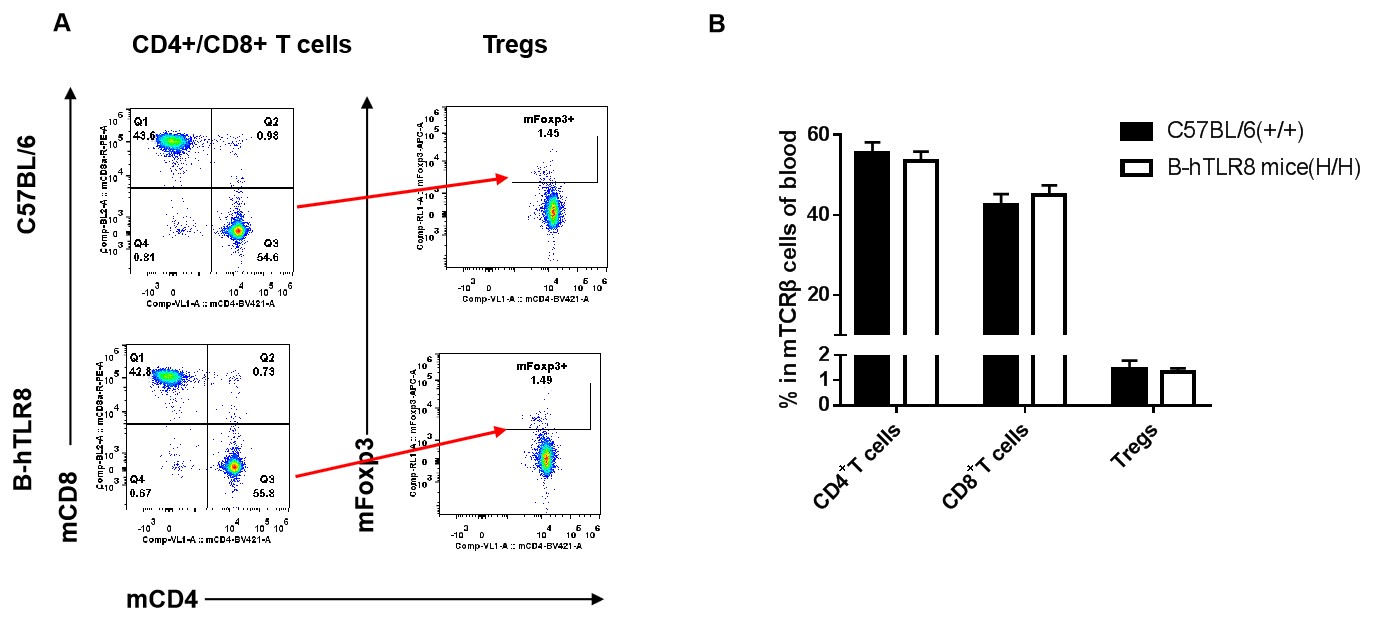
Analysis of blood T cell subpopulations by FACS. Blood were isolated from female C57BL/6 and B-hTLR8 mice (n=3, 6-week-old). Flow cytometry analysis of the blood was performed to assess leukocyte subpopulations. A. Representative FACS plots. Single live CD45+ cells were gated for CD3+ T cell population and used for further analysis as indicated here. B. Results of FACS analysis. The percent of CD4+ T cells, CD8+ T cells, and Tregs in homozygous B-hTLR8 mice were similar to those in the C57BL/6 mice, demonstrating that introduction of hTLR8 in place of its mouse counterpart does not change the overall development, differentiation or distribution of these T cell subtypes in blood.
-
Analysis of leukocytes cell subpopulation in spleen
-
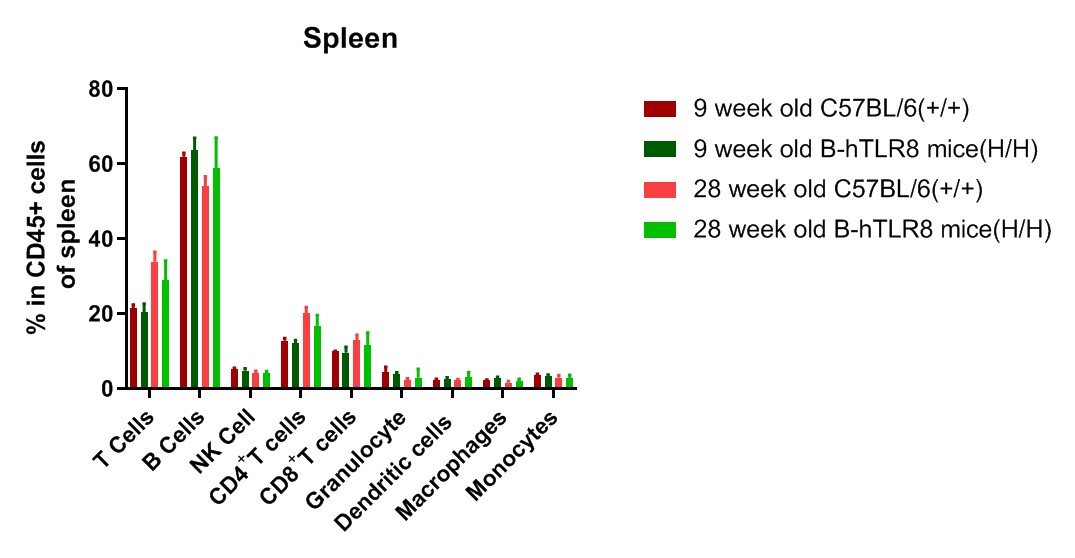
Analysis of spleen leukocyte subpopulations by FACS. Splenocytes were isolated from female C57BL/6 and B-hTLR8 mice (9-week old(n=3) and 28-week old (n=5)). Flow cytometry analysis of the splenocytes was performed to assess leukocyte subpopulations. Results of FACS analysis. Percent of T cells, B cells, NK cells, dendritic cells, granulocytes, monocytes and macrophages in homozygous B-hTLR8 mice were similar to those in the C57BL/6 mice, demonstrating that TLR8 humanized does not change the overall development, differentiation or distribution of these cell types in spleen.
-
Analysis of T cell subpopulation in spleen
-
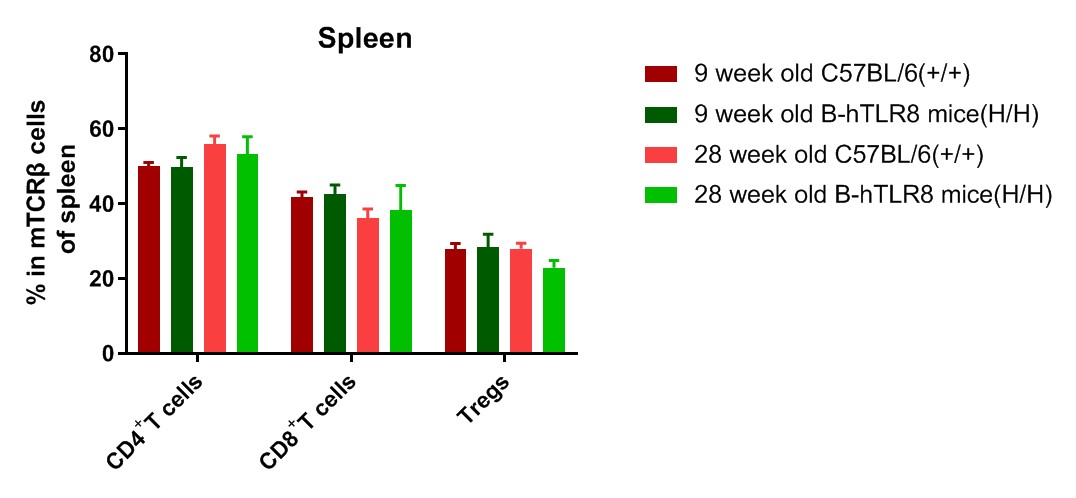
Analysis of spleen T cell subpopulations by FACS. Splenocytes were isolated from female C57BL/6 and B-hTLR8 mice (9-week old(n=3) and 28-week old (n=5)). Flow cytometry analysis of the splenocytes was performed to assess leukocyte subpopulations. Results of FACS analysis. The percent of CD8+ T cells , CD4+ T cells and Tregs in B-hTLR8 mice were similar to those in C57BL/6 mice, demonstrating that TLR8 humanized does not change the overall development, differentiation or distribution of these cell types in spleen.
-
Analysis of leukocytes cell subpopulation in blood
-
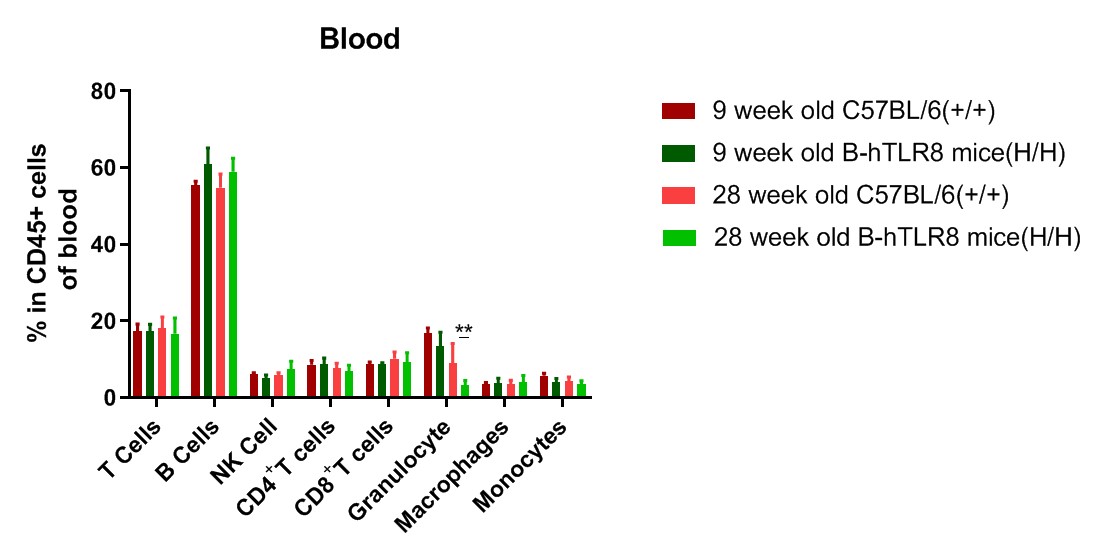
Analysis of blood leukocyte subpopulations by FACS. Blood were isolated from female C57BL/6 and B-hTLR8 mice (9-week old(n=3) and 28-week old (n=5)). Flow cytometry analysis of the blood was performed to assess leukocyte subpopulations. Results of FACS analysis. of T cells, B cells, NK cells, dendritic cells, monocytes and macrophages in homozygous B-hTLR8 mice were similar to those in the C57BL/6 mice. Compared with the C57BL/6 mice, the percent of granulocytes in B-hTLR8 mice were changed at the age of 28 weeks. It suggests that TLR8 humanized may change the development, differentiation or distribution of granulocytes in blood.
-
Analysis of T cell subpopulation in blood
-
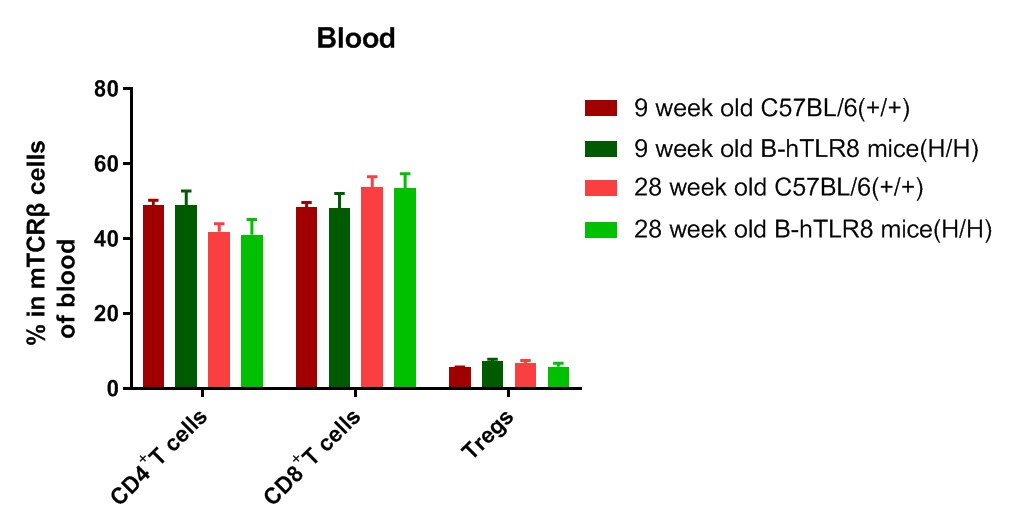
Analysis of blood T cell subpopulations by FACS. Blood were isolated from female C57BL/6 and B-hTLR8 mice (9-week old(n=3) and 28-week old (n=5)). Flow cytometry analysis of the blood was performed to assess leukocyte subpopulations. Results of FACS analysis. The percent of CD4+ T cells, CD8+ T cells, and Tregs in homozygous B-hTLR8 mice were similar to those in the C57BL/6 mice, demonstrating that introduction of hTLR8 in place of its mouse counterpart does not change the overall development, differentiation or distribution of these T cell subtypes in blood.
-
Spleen weight
-
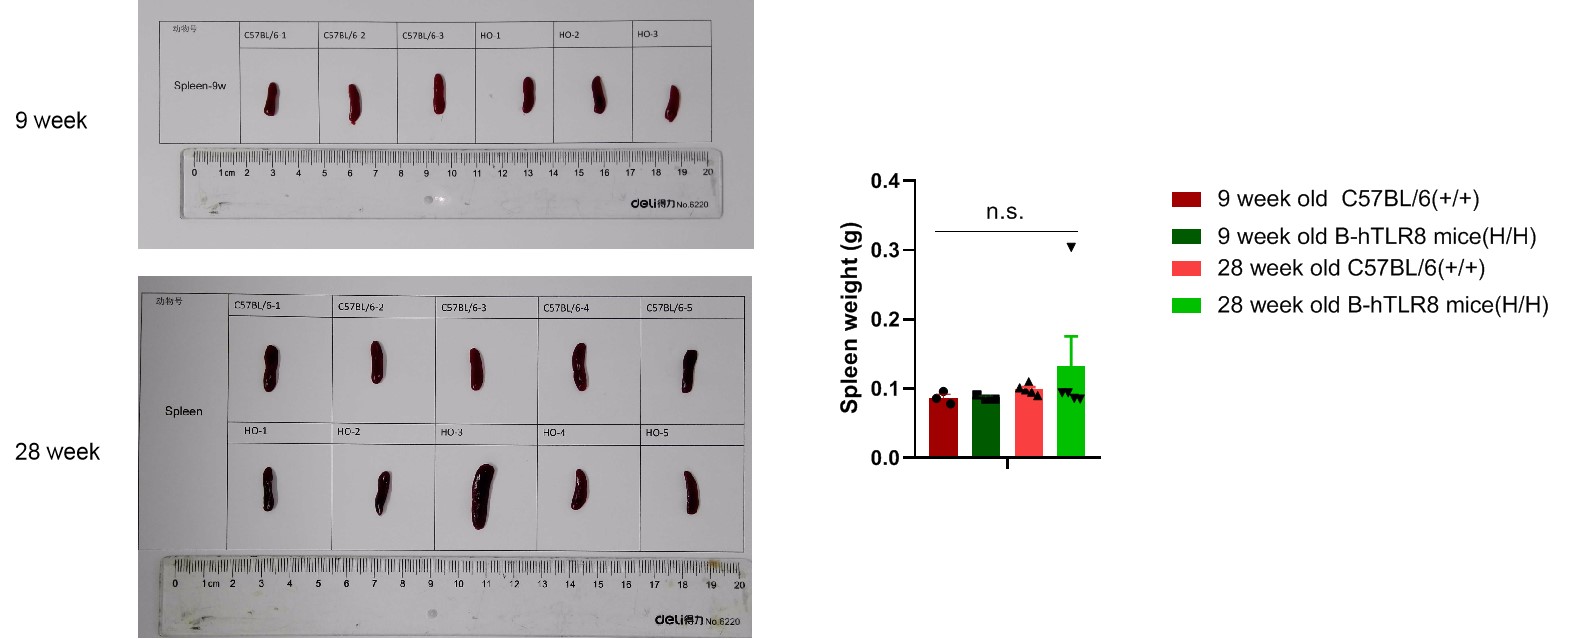
Analysis of spleen weight of B-TLR8 mice in different ages. Compared with age matched C57BL/6 mice, there was no significant change in spleen weight of 9-week-old B-hTLR8 mice. Compared with age matched C57BL/6 mice, the spleen weight of 28 week old B-hTLR8 mice increased, but there was no significant difference.
-
Liver weight
-
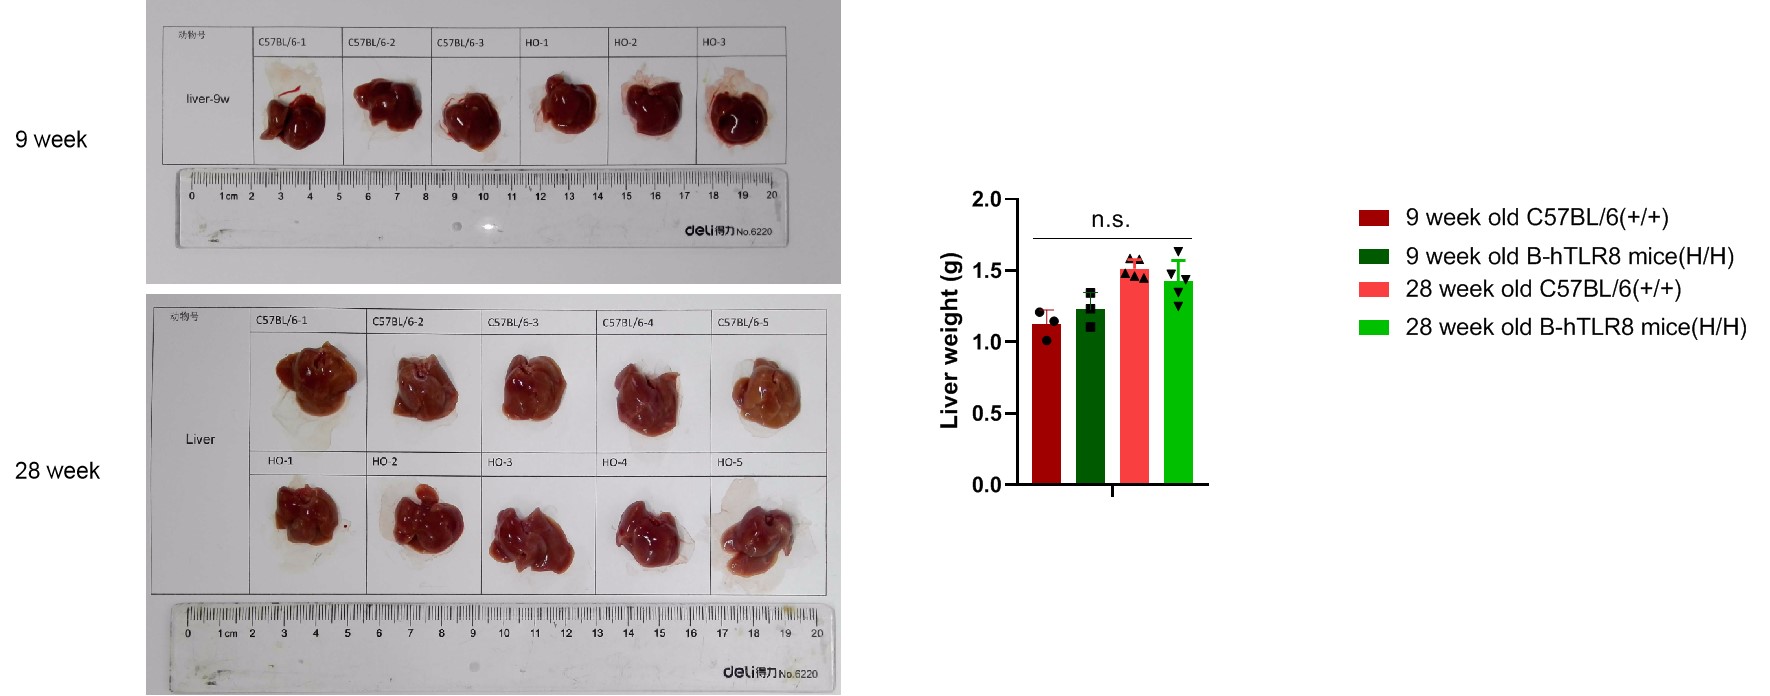
Analysis of liver weight of B-TLR8 mice in different ages. Compared with age matched C57BL/6 mice, there was no significant change in liver weight of 9-week-old B-hTLR8 mice. Compared with age matched C57BL/6 mice, there was no significant change in liver weight of 28-week-old B-hTLR8 mice.
-
In vivo efficacy of anti-human TROP2 antibody conjugated TLR8 agonists
-
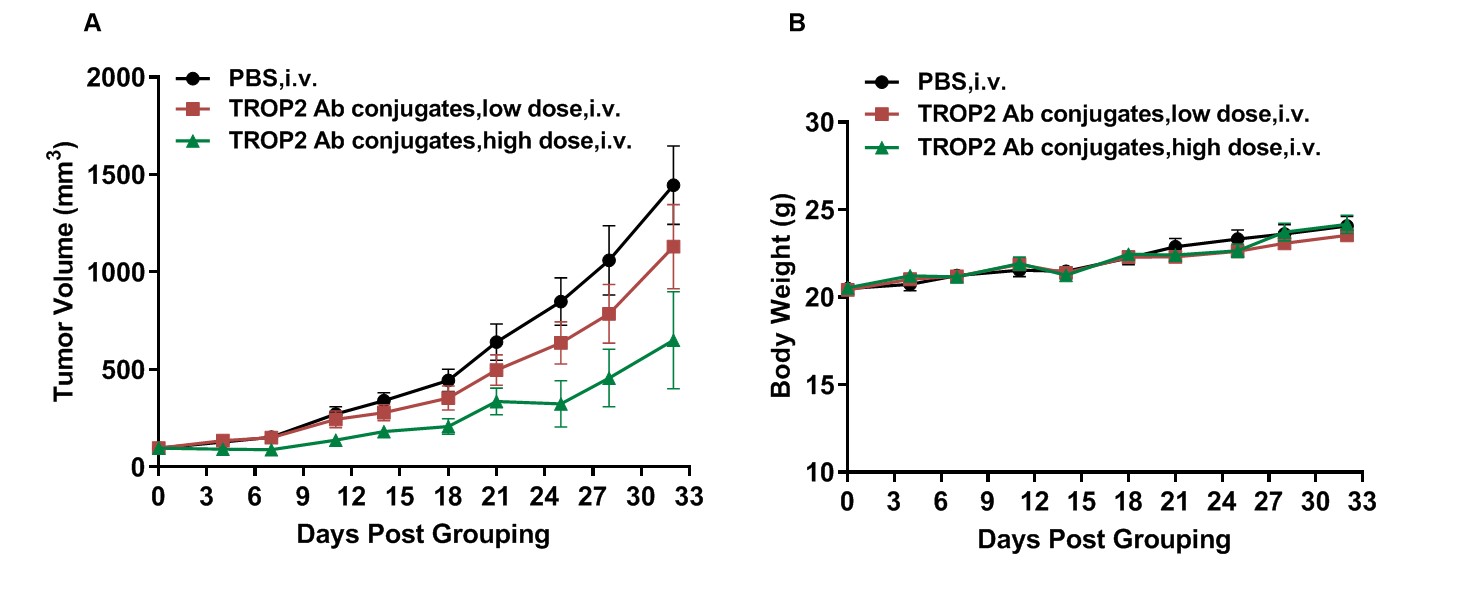
Antitumor activity of TROP2 antibody conjugated TLR8 agonists in B-hTLR8 mice. (A) Anti-human TROP2 antibody conjugated TLR8 agonists inhibited MC38 tumor growth in B-hTLR8 mice. Murine colon cancer B-hTROP2 MC38 plus cells were subcutaneously implanted into homozygous B-hTLR8 mice (female, 9 week-old, n=8). Mice were grouped according to body weight differences, at which time they were treated antibody conjugates with different doses. (B) Body weight changes during treatment. As shown in panel A, anti-human TROP2 antibody conjugated TLR8 agonists were efficacious in controlling tumor growth in B-hTLR8 mice, demonstrating that B-hTLR8 mouse model is a promising model for preclinical in vivo studies to evaluate antibodies conjugated TLR8 agonists. Values are expressed as mean ± SEM.
-
In vivo efficacy of collagen-induced arthritis model in B-hTLR8 mice
-
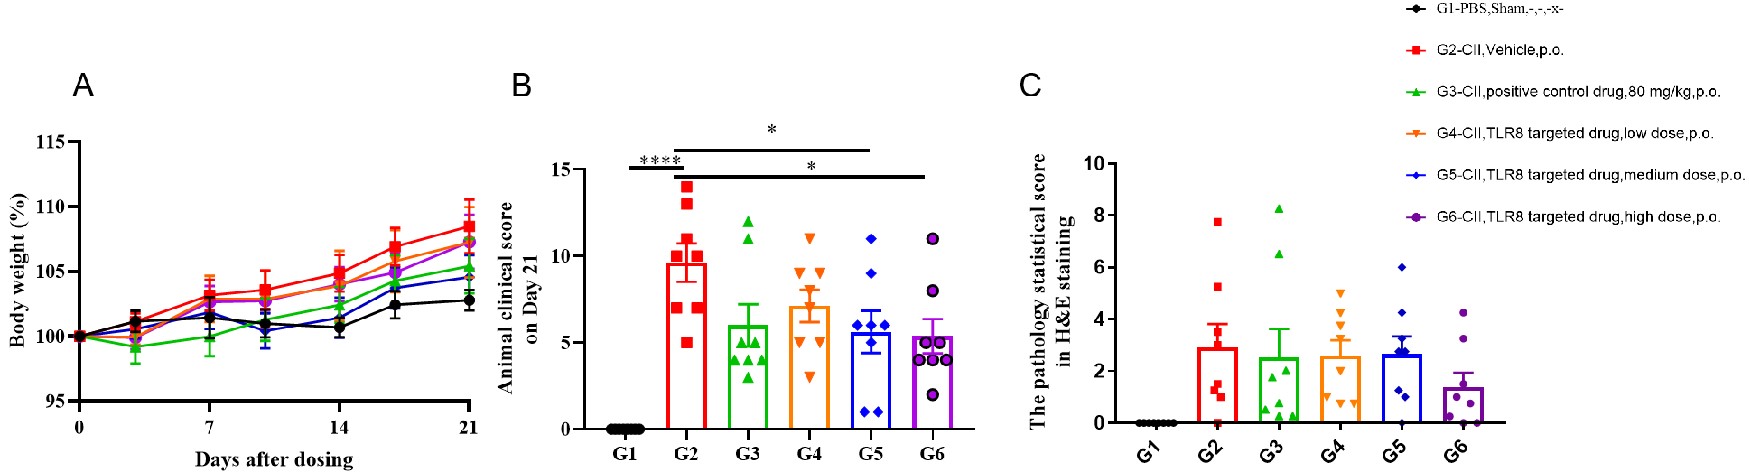
In vivo efficacy of collagen-induced arthritis model in B-hTLR8 mice. 96 animals were randomly divided into 2 groups according to their body weight, 8 animals in group A and 88 animals in Group B. On day 0, PBS was injected subcutaneously in group A. CⅡ emulsion was injected subcutaneously in group B. On day 21, animals in group A were injected with PBS; animals of group B were injected with CⅡ emulsion. When the average clinical score of the animal in group B is more than 0, they were grouped again, and these animals are divided into 5 groups, each with 8 animals, respectively marked as G2~G6. G1 group was group A with the same number of animals, it is a non-CIA control group. The G2 is the vehicle group(model group), G3 is 80 mg/kg positive control drug group, G4 is the low dose TLR8 targeted drug group, G5 is the medium dose TLR8 targeted drug group, G6 is the high dose TLR8 targeted drug group. (A) Weight changes. Percentage of animal weight change per day compared with Day 0. (B) Animal clinical score on Day 21 after dosing. As test article group, it was observed that the score average was lower in G3-G6 compared to that in vehicle-treated group(G2). Especially, G3 and G6 showed significant difference from G2. (C) The pathology statistical score in H&E staining. Microscopically, no lesion was found in G1. Different degrees of subcutaneous mixed inflammatory cell infiltration, joint synovitis and/or pannus formation, ankle and/or phalangeal joint cartilage and bone tissue destruction were observed in G2. G6 had a certain improvement on related lesions of arthritic animal model. Individual data of microscopic findings and photos were presented in Appendix.
-
Poster
