
Basic Information
-
mRNA expression analysis

-

Strain specific analysis of TNFR2 gene expression in WT and hTNFR2 mice by RT-PCR. Mouse Tnfr2 mRNA was detectable only in splenocytes of wild-type (+/+) mice. Human TNFR2 mRNA was detectable only in H/H, but not in +/+ mice.
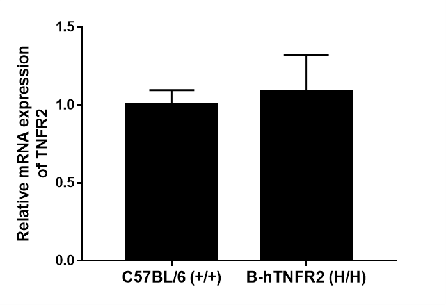
Strain specific analysis of TNFR2 gene expression in WT and hTNFR2 mice by RT-qPCR. The mRNA expression of hTNFR2 in B-hTNFR2 (H/H) was similar to those in the C57BL/6 (+/+), demonstrating that introduction of hTNFR2 in place of its mouse counterpart does not change the expression level of TNFR2 protein.
-
Protein expression analysis
-
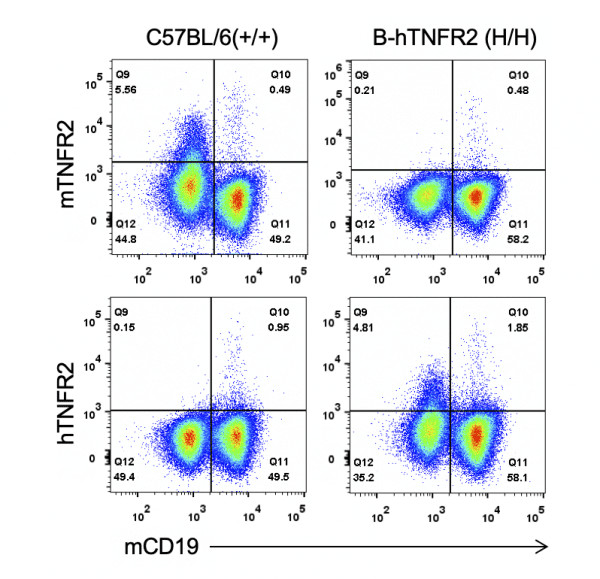
Strain specific TNFR2 expression analysis in homozygous B-hTNFR2 mice by flow cytometry. Splenocytes were collected from WT and homozygous B-hTNFR2 (H/H) mice, and analyzed by flow cytometry with species-specific anti-TNFR2 antibody. Mouse TNFR2 was detectable in WT mice. Human TNFR2 was exclusively detectable in homozygous B-hTNFR2 but not WT mice.
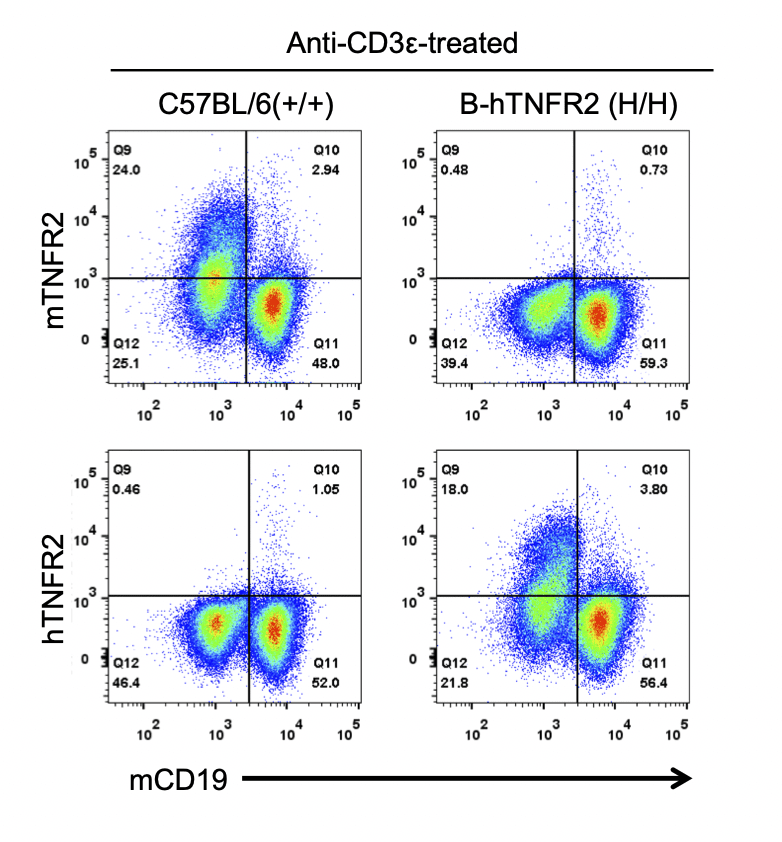
Strain specific TNFR2 expression analysis in homozygous B-hTNFR2 mice by flow cytometry. Splenocytes were collected from WT and homozygous B-hTNFR2 (H/H) mice stimulated with anti-CD3ε in vivo, and analyzed by flow cytometry with species-specific anti-TNFR2 antibody. Mouse TNFR2 was detectable in WT mice. Human TNFR2 was exclusively detectable in homozygous B-hTNFR2 but not WT mice.
Strain specific TNFR2 expression analysis in homozygous B-hTNFR2 mice by flow cytometry. Splenocytes were collected from WT and homozygous B-hTNFR2 (H/H) mice, and analyzed by flow cytometry with species-specific anti-TNFR2 antibody. Mouse TNFR2 was detectable in WT mice. Human TNFR2 was exclusively detectable in homozygous B-hTNFR2 but not WT mice.
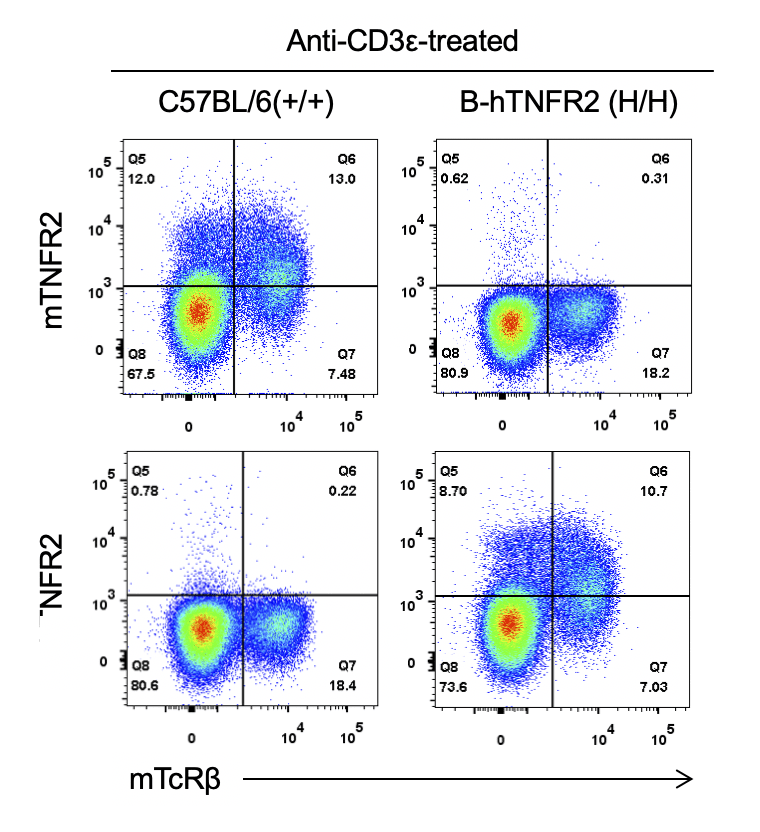
Strain specific TNFR2 expression analysis in homozygous B-hTNFR2 mice by flow cytometry. Splenocytes were collected from WT and homozygous B-hTNFR2 (H/H) mice stimulated with anti-CD3ε in vivo, and analyzed by flow cytometry with species-specific anti-TNFR2 antibody. Mouse TNFR2 was detectable in WT mice. Human TNFR2 was exclusively detectable in homozygous B-hTNFR2 but not WT mice.
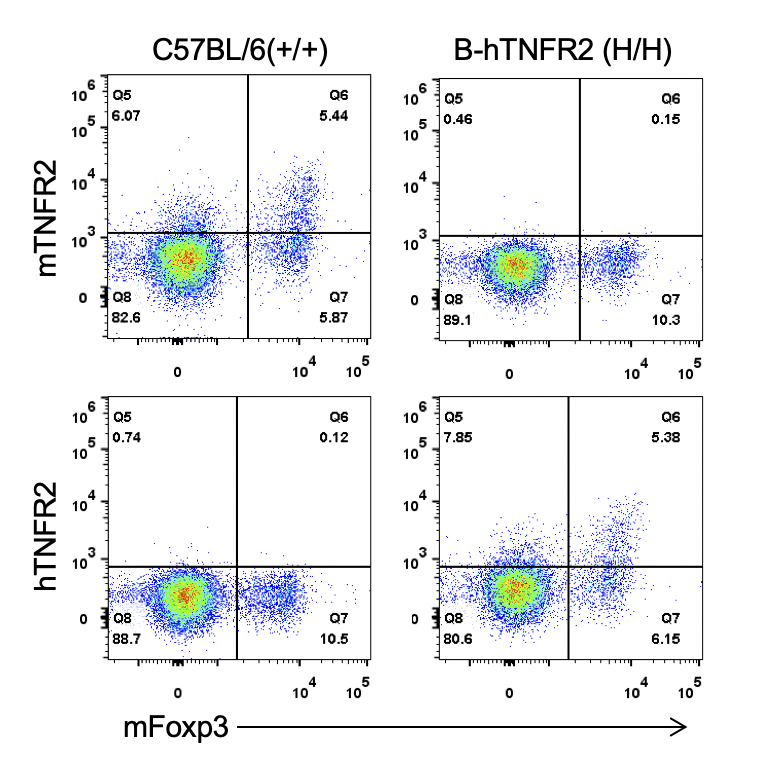
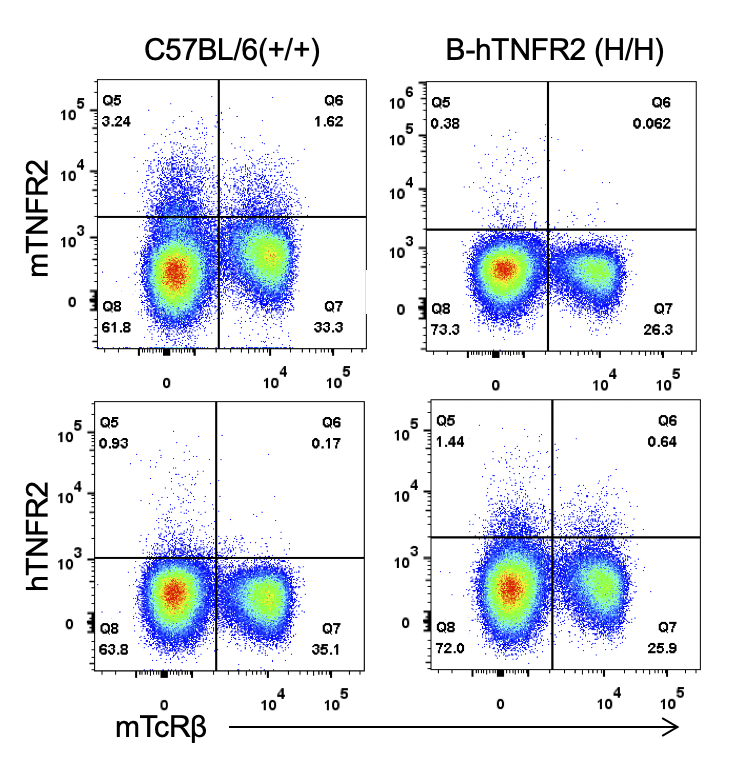
Strain specific TNFR2 expression analysis in homozygous B-hTNFR2 mice by flow cytometry. Splenocytes were collected from WT and homozygous B-hTNFR2 (H/H) mice, and analyzed by flow cytometry with species-specific anti-TNFR2 antibody. Mouse TNFR2 was detectable in WT mice. Human TNFR2 was exclusively detectable in homozygous B-hTNFR2 but not WT mice.
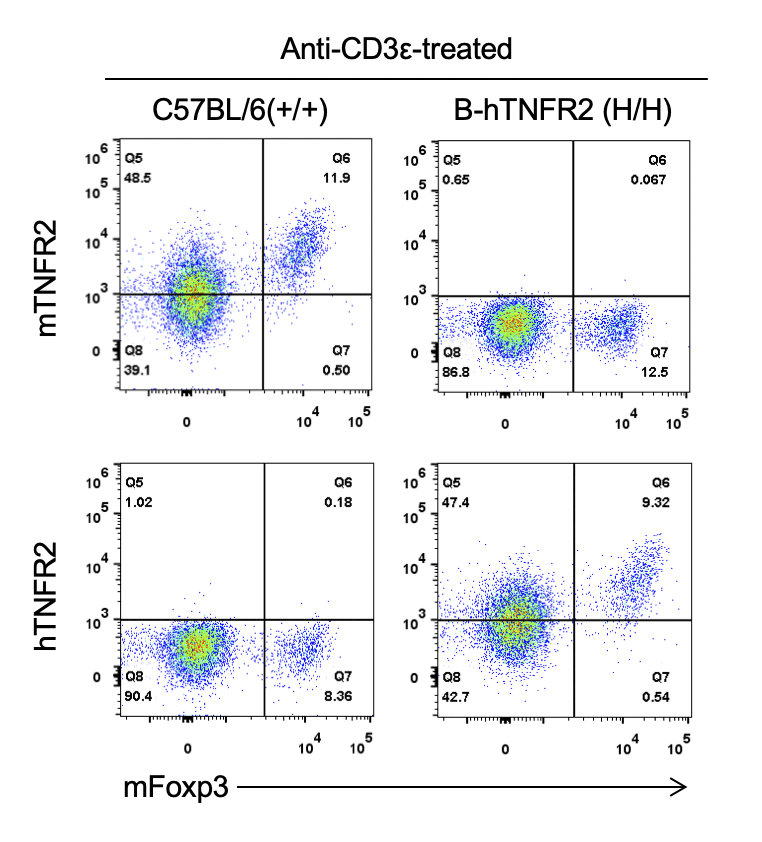
Strain specific TNFR2 expression analysis in homozygous B-hTNFR2 mice by flow cytometry. Splenocytes were collected from WT and homozygous B-hTNFR2 (H/H) mice stimulated with anti-CD3ε in vivo, and analyzed by flow cytometry with species-specific anti-TNFR2 antibody. Mouse TNFR2 was detectable in WT mice. Human TNFR2 was exclusively detectable in homozygous B-hTNFR2 but not WT mice.
Analysis of spleen leukocytes cell subpopulations in B-hTNFR2 mice
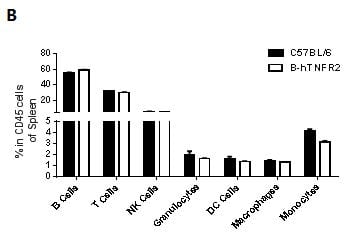
Analysis of spleen leukocyte subpopulations by FACS
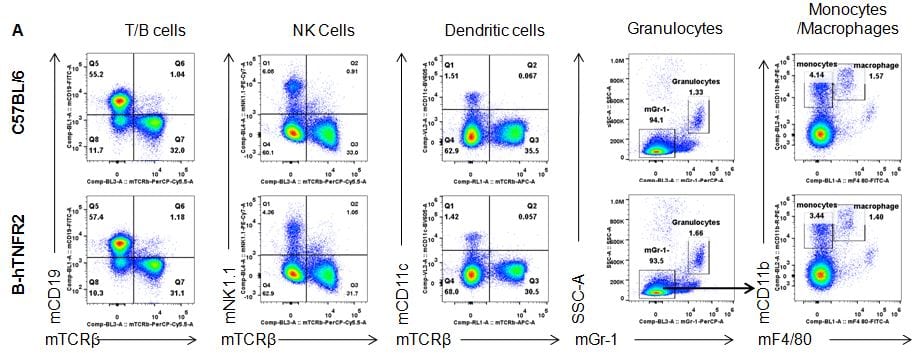
Splenocytes were isolated from female C57BL/6 and B-hTNFR2 mice (n=3, 6 week-old) Flow cytometry analysis of the splenocytes was performed to assess leukocyte subpopulations. A. Representative FACS plots. Single live cells were gated for CD45 population and used for further analysis as indicated here. B. Results of FACS analysis. Percent of T, B, NK, Monocyte, DC and macrophage cells in homozygous B-hTNFR2 mice were similar to those in the C57BL/6 mice, demonstrating that introduction of hTNFR2 in place of its mouse counterpart does not change the overall development, differentiation or distribution of these cell types in spleen.
Analysis of spleen T cell subpopulations in B-hTNFR2 mice
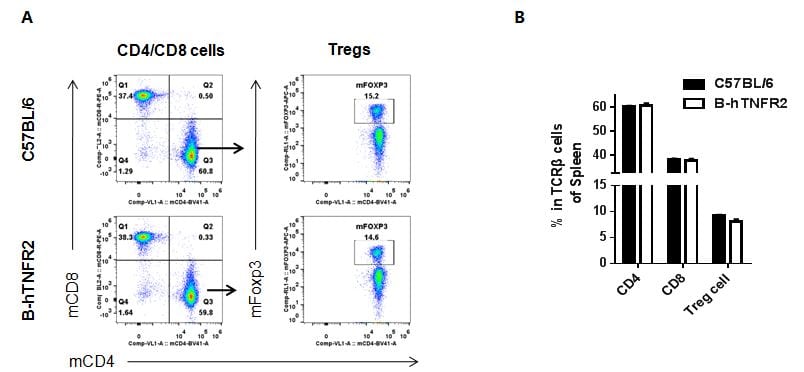
Analysis of spleen T cell subpopulations by FACS
Splenocytes were isolated from female C57BL/6 and B-hTNFR2 mice (n=3, 6 week-old). Flow cytometry analysis of the splenocytes was performed to assess leukocyte subpopulations. A. Representative FACS plots. Single live CD45+ cells were gated for CD3 T cell population and used for further analysis as indicated here. B. Results of FACS analysis. Percent of CD8, CD4, and Treg cells in homozygous B-hTNFR2 mice were similar to those in the C57BL/6 mice, demonstrating that introduction of hTNFR2 in place of its mouse counterpart does not change the overall development, differentiation or distribution of these T cell sub types in spleen. Values are expressed as mean ± SEM.
Analysis of lymph node leukocytes cell subpopulations in B-hTNFR2 mice
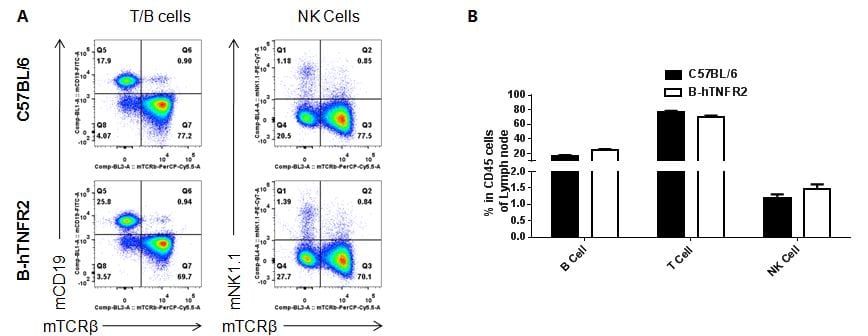
Analysis of lymph node leukocyte subpopulations by FACS.Leukocytes were isolated from female C57BL/6 and B-hTNFR2 mice (n=3, 6 week-old) Flow cytometry analysis of the leukocytes was performed to assess leukocyte subpopulations. A. Representative FACS plots. Single live cells were gated for CD45 population and used for further analysis as indicated here. B. Results of FACS analysis. Percent of T, B and NK cells in homozygous B-hTNFR2 mice were similar to those in the C57BL/6 mice, demonstrating that introduction of hTNFR2 in place of its mouse counterpart does not change the overall development, differentiation or distribution of these cell types in lymph node.
Analysis of lymph node T cell subpopulations in B-hTNFR2 mice
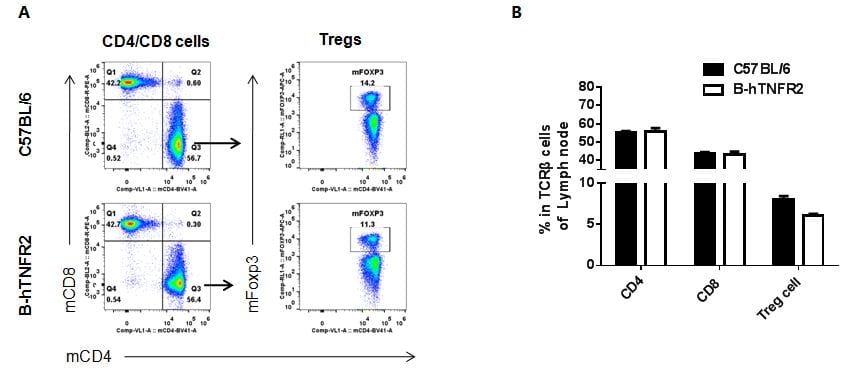
Analysis of lymph node T cell subpopulations by FACS
Leukocytes were isolated from female C57BL/6 and B-hTNFR2 mice (n=3, 6 week-old). Flow cytometry analysis of the leukocytes was performed to assess leukocyte subpopulations. A. Representative FACS plots. Single live CD45+ cells were gated for CD3 T cell population and used for further analysis as indicated here. B. Results of FACS analysis. Percent of CD8, CD4, and Treg cells in homozygous B-hTNFR2 mice were similar to those in the C57BL/6 mice, demonstrating that introduction of hTNFR2 in place of its mouse counterpart does not change the overall development, differentiation or distribution of these T cell sub types in lymph node. Values are expressed as mean ± SEM.
Antibody binding assay
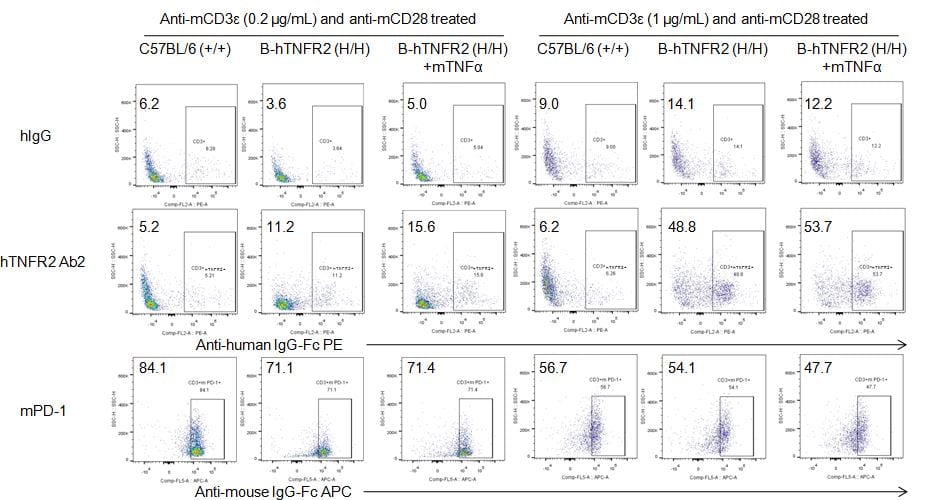
Analysis of splenocytes of B-hTNFR2 mice by FACS. Splenocytes were isolated from female B-hTNFR2 mice (n=3, 6 week-old) treated with anti-mCD3ε (0.2 or 1 μg/mL) and anti-mCD28 (1 μg/mL) in vivo. Single live cells were gated for CD45 population and used for further analysis as indicated here. Human TNFR2 expression was detectable on CD3 T cells in B-hTNFR2 mice as evidenced by hTNFR2 Ab2 binding vs isotype control (hIgG). mTNFα enhanced hTNFR2 Ab2 binding under mild anti-mCD3ε (0.2 μg/mL) stimulation, suggesting that mTNFα/hTNFR2 signaling pathway also works well in the B-hTNFR2 mice.
In vivo efficacy of anti human TNFR2 antibodies
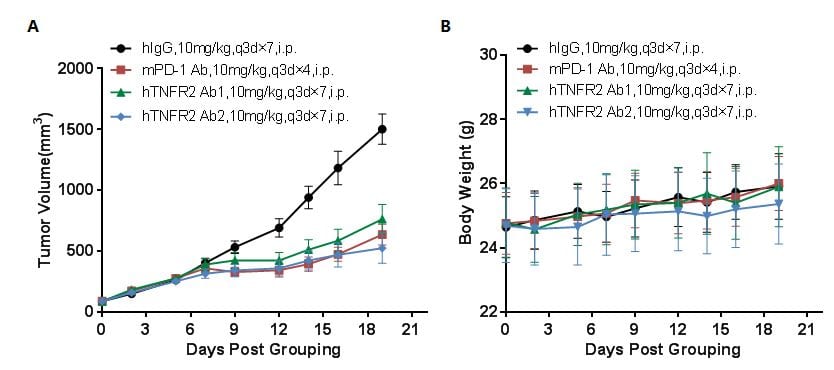
Antitumor activity of anti-human TNFR2 antibodies in B-hTNFR2 mice. (A) Anti-human TNFR2 antibodies inhibited MC38 tumor growth in B-hTNFR2 mice. Murine colon cancer MC38 cells (5E5) were subcutaneously implanted into homozygous B-hTNFR2 mice (female, 9-10 week-old, n=8). Mice were grouped when tumor volume reached approximately 100 mm3, at which time they were treated with anti-human TNFR2 antibodies with doses and schedules indicated in panel (B) Body weight changes during treatment. As shown in panel A, two anti-human TNFR2 antibodies were efficacious in controlling tumor growth in B-hTNFR2 mice, demonstrating that the B-hTNFR2 mice provide a powerful preclinical model for in vivo evaluation of anti-human TNFR2 antibodies. Values are expressed as mean ± SEM.
In vivo efficacy of anti-human TNFR2 antibody
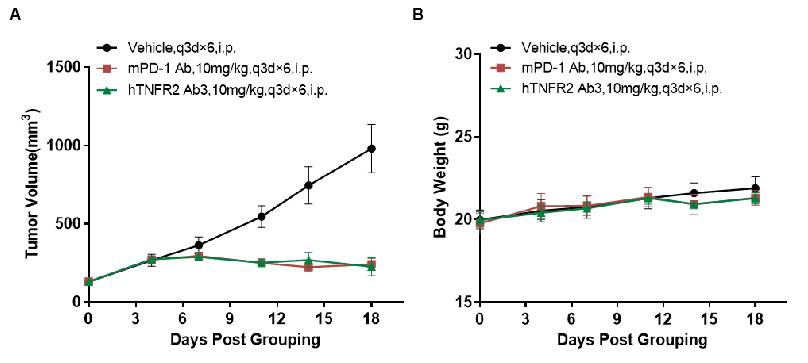
Antitumor activity of anti-human TNFR2 antibodies in B-hTNFR2 mice. (A) Anti-human TNFR2 antibodies inhibited MC38 tumor growth in B-hTNFR2 mice. Murine colon cancer MC38 cells (5E5) were subcutaneously implanted into homozygous B-hTNFR2 mice (female, 8-9 week-old, n=6). Mice were grouped when tumor volume reached approximately 100 mm3, at which time they were treated with anti-human TNFR2 antibody with doses and schedules indicated in panel A. (B) Body weight changes during treatment. As shown in panel A, anti-human TNFR2 antibody was efficacious in controlling tumor growth in B-hTNFR2 mice, demonstrating that the B-hTNFR2 mice provide a powerful preclinical model for in vivo evaluation of anti-human TNFR2 antibodies. Values are expressed as mean ± SEM.
In vivo efficacy of anti-human TNFR2 antibodies
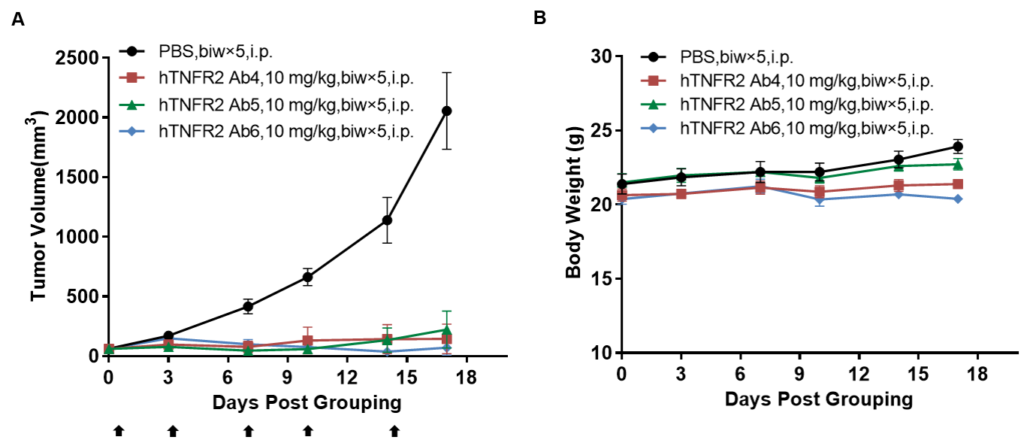
Antitumor activity of anti-human TNFR2 antibodies in B-hTNFR2 mice. (A) Anti-human TNFR2 antibodies inhibited MC38 tumor growth in B-hTNFR2 mice. Murine colon cancer MC38 cells (5E5) were subcutaneously implanted into homozygous B-hTNFR2 mice (female, 5-8 week-old, n=4). Mice were grouped when tumor volume reached approximately 50 mm3, at which time they were treated with anti-human TNFR2 antibodies with doses and schedules indicated in panel A. (B) Body weight changes during treatment. As shown in panel A, anti-human TNFR2 antibodies were efficacious in controlling tumor growth in B-hTNFR2 mice, demonstrating that the B-hTNFR2 mice provide a powerful preclinical model for in vivo evaluation of anti-human TNFR2 antibodies. Values are expressed as mean ± SEM. (All antibodies were provided by the clients)
-
Poster
-
References
-
1. Torrey H, Butterworth J, Mera T, Okubo Y, Wang L, Baum D, et al. Targeting TNFR2 with antagonistic antibodies inhibits proliferation of ovarian cancer cells and tumor-associated Tregs. Sci Signal 2017, 10(462).
2. Faustman D, Davis M. TNF receptor 2 pathway: drug target for autoimmune diseases. Nat Rev Drug Discov 2010, 9(6): 482-493.
