
Basic Information
-
Gene Targeting Strategy

-
Gene targeting strategy for B-hTREM1 mice. The exons 1~4 of mouse Trem1 gene that encode the extracellular domain were replaced by human TREM1 exons 1~4 in B-hTREM1 mice.
-
mRNA Expression Analysis
-

Strain specific analysis of TREM1 gene expression in wild type C57BL/6 (+/+) mice and homozygous B-hTREM1(H/H) mice by RT-qPCR. The mRNA expression of hTREM1 in B-hTREM1(H/H) was similar to mTrem1 in the C57BL/6 (+/+), demonstrating that introduction of hTREM1 in place of its mouse counterpart does not change the expression level of TREM1 mRNA.
-
Protein Expression Analysis
-
Macrophages
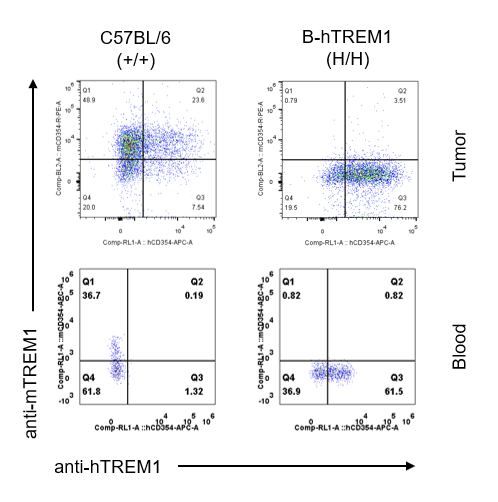
Strain specific TREM1 expression analysis in homozygous B-hTREM1 mice by flow cytometry. MC38 cells were inoculated into wild-type C57BL/6(+/+) and homozygous B-hTREM1 mice(H/H). Blood and tumor were harvested when tumor volume reached approximately 500 mm3, and analyzed by flow cytometry with species-specific anti-TREM1 antibody. Mouse TREM1 was exclusively detectable in blood and tumor macrophages of wild-type mice. Human TREM1 was exclusively detectable in blood and tumor macrophages of homozygous B-hTREM1 mice.
* It is not clear what population of cells was stained with specific anti-hTREM1 in tumors of C57BL/6 (Q2).
Monocytes (M-MDSC)
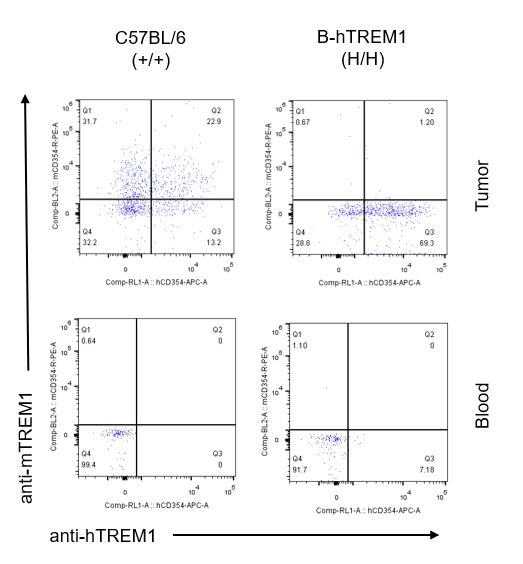
Strain specific TREM1 expression analysis in homozygous B-hTREM1 mice by flow cytometry. MC38 cells were inoculated into wild-type C57BL/6(+/+) and homozygous B-hTREM1 mice(H/H). Blood and tumor were harvested when tumor volume reached approximately 500 mm3, and analyzed by flow cytometry with species-specific anti-TREM1 antibody. Mouse and human TREM1 were not detectable in blood monocyte of wild-type mice and homozygous B-hTREM1 mice. Human TREM1 was exclusively detectable in tumor M-MDSC of homozygous B-hTREM1 mice.
* It is not clear what population of cells was stained with specific anti-hTREM1 in tumors of C57BL/6 (Q2).
Neutrophils (G-MDSC)
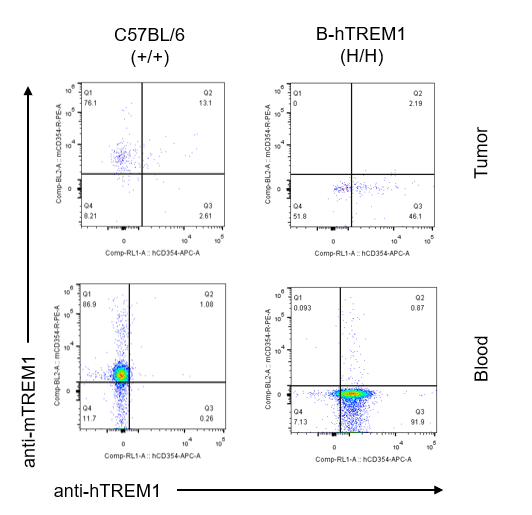
Strain specific TREM1 expression analysis in homozygous B-hTREM1 mice by flow cytometry. MC38 cells were inoculated into wild-type C57BL/6(+/+) and homozygous B-hTREM1 mice(H/H). Blood and tumor were harvested when tumor volume reached approximately 500 mm3, and analyzed by flow cytometry with species-specific anti-TREM1 antibody. Mouse TREM1 was exclusively detectable in blood and tumor neutrophils (G-MDSC) of wild-type mice. Human TREM1 was exclusively detectable in blood and tumor neutrophils (G-MDSC) of homozygous B-hTREM1 mice.
T cells
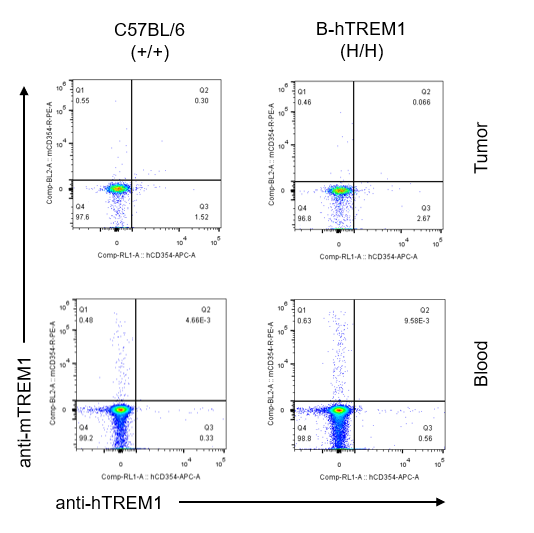
Strain specific TREM1 expression analysis in homozygous B-hTREM1 mice by flow cytometry. MC38 cells were inoculated into wild-type C57BL/6(+/+) and homozygous B-hTREM1 mice(H/H). Blood and tumor were harvested when tumor volume reached approximately 500 mm3, and analyzed by flow cytometry with species-specific anti-TREM1 antibody. Mouse and human TREM1 were not detectable in blood and tumor T cells of wild-type mice and homozygous B-hTREM1 mice.
B-cells

Strain specific TREM1 expression analysis in homozygous B-hTREM1 mice by flow cytometry. MC38 cells were inoculated into wild-type C57BL/6(+/+) and homozygous B-hTREM1 mice(H/H). Blood and tumor were harvested when tumor volume reached approximately 500 mm3, and analyzed by flow cytometry with species-specific anti-TREM1 antibody. Mouse and human TREM1 were not detectable in blood and tumor B cells of wild-type mice and homozygous B-hTREM1 mice.
-
Immune Cell Analysis
-
Analysis of leukocyte cell subpopulation in spleen


Analysis of spleen leukocyte subpopulations by FACS. Splenocytes were isolated from female C57BL/6 and B-hTREM1 mice (n=3, 6-week-old). Flow cytometry analysis of the splenocytes was performed to assess leukocyte subpopulations. (A) Representative FACS plots. Single live cells were gated for the CD45+ population and used for further analysis as indicated here. (B) Results of FACS analysis. Percent of T cell, B cell, NK cell, monocyte, dendritic cell, granulocyte and macrophage in homozygous B-hTREM1 mice were similar to those in the C57BL/6 mice, demonstrating that TREM1 humanized does not change the overall development, differentiation or distribution of these cell types in spleen. Values are expressed as mean ± SEM.
Analysis of T cell subpopulation in spleen

Analysis of spleen T cell subpopulations by FACS. Splenocytes were isolated from female C57BL/6 and B-hTREM1 mice (n=3, 6-week-old). Flow cytometry analysis of the splenocytes was performed to assess leukocyte subpopulations. (A) Representative FACS plots. Single live CD45+ cells were gated for TCRβ+T cell population and used for further analysis as indicated here. (B) Results of FACS analysis. There were no differences between C57BL/6 and B-hTREM1 mice, demonstrating that humanized of TREM1 does not change the overall development, differentiation or distribution of these T cell subtypes. Values are expressed as mean ± SEM.
Analysis of leukocyte cell subpopulation in lymph nodes

Analysis of lymph node leukocyte subpopulations by FACS. Lymph nodes were isolated from female C57BL/6 and B-hTREM1 mice (n=3, 6-week-old). Flow cytometry analysis of the lymph nodes was performed to assess leukocyte subpopulations. (A) Representative FACS plots. Single live cells were gated for the CD45+ population and used for further analysis as indicated here. (B) Results of FACS analysis. Percent of T cell, B cell, NK cell in homozygous B-hTREM1 mice were similar to those in the C57BL/6 mice, demonstrating that TREM1 humanized does not change the overall development, differentiation or distribution of these cell types in spleen. Values are expressed as mean ± SEM.
Analysis of T cell subpopulation in lymph nodes

Analysis of lymph node T cell subpopulations by FACS. Lymph nodes were isolated from female C57BL/6 and B-hTREM1 mice (n=3, 6-week-old). Flow cytometry analysis of the lymph nodes was performed to assess leukocyte subpopulations. (A) Representative FACS plots. Single live CD45+ cells were gated for TCRβ+T cell population and used for further analysis as indicated here. (B) Results of FACS analysis. . There were no differences between C57BL/6 and B-hTREM1 mice, demonstrating that humanized of TREM1 does not change the overall development, differentiation or distribution of these T cell subtypes. Values are expressed as mean ± SEM.
Analysis of leukocyte cell subpopulation in blood


Analysis of blood leukocyte subpopulations by FACS. Blood was isolated from female C57BL/6 and B-hTREM1 mice (n=3, 6-week-old). Flow cytometry analysis of the blood was performed to assess leukocyte subpopulations. (A) Representative FACS plots. Single live cells were gated for the CD45+ population and used for further analysis as indicated here. (B) Results of FACS analysis. Percent of T cell, B cell, NK cell, monocyte, dendritic cell, granulocyte and macrophage in homozygous B-hTREM1 mice were similar to those in the C57BL/6 mice, demonstrating that TREM1 humanized does not change the overall development, differentiation or distribution of these cell types in blood. Values are expressed as mean ± SEM.
Analysis of T cell subpopulation in blood

Analysis of blood T cell subpopulations by FACS. Blood were isolated from female C57BL/6 and B-hTREM1 mice (n=3, 6-week-old). Flow cytometry analysis of the blood was performed to assess leukocyte subpopulations. (A) Representative FACS plots. Single live CD45+ cells were gated for TCRβ+T cell population and used for further analysis as indicated here. (B) Results of FACS analysis. There were no differences between C57BL/6 and B-hTREM1 mice, demonstrating that humanized of TREM1 does not change the overall development, differentiation or distribution of these T cell subtypes. Values are expressed as mean ± SEM.
-
Analysis of hTREM1 Function in B-hTREM1 Mice
-

Analysis of hTREM1 function in B-hTREM1 mice. Wild-type C57BL/6 mice(+/+) and B-hTREM1 mice(H/H) were randomly grouped and injected i.p. with LPS from E.coli (500 ug/mouse). Serum and peritoneal macrophages were collected after LPS administration. Under LPS-stimulated conditions, human TREM1 could be activated effectively and then induced rapid phosphorylation of Syk in B-hTREM1 mice (A) Also, soluble TREM1 was upregulated in the serum of B-hTREM1 mice (B) indicating that mouse MMP was able to proteolytic cleave human TREM1, and induce soluble TREM1 release. ND, not detected.
-
Tumor Growth Curve and Body Weight Changes
-
Tumor Growth Curve and Body Weight Changes

Subcutaneous homograft tumor growth of MC38 cells in B-hTREM1 mice. Wild-type MC38 cells (5×10⁵) were subcutaneously implanted into wild-type C57BL/6 mice and B-hTREM1 mice (male, 8-week-old, n=6). Tumor volume and body weight were measured twice a week. (A) Average tumor volume ± SEM. (B) Body weight (Mean± SEM). Volume was expressed in mm3 using the formula: V=0.5 X long diameter X short diameter2. As shown in panel A, MC38 cells were able to establish tumors in B-hTREM1 mice and can be used for efficacy studies.
Tumor Growth Curve of Individual Mice

MC38 tumor cells growth of individual mice. Wild-type MC38 cells (5×10⁵) were subcutaneously implanted into wild-type C57BL/6 mice and B-hTREM1 mice (male, 8-week-old, n=6). As shown in panel, B-hTREM1 mice were able to establish tumors in vivo and can be used for efficacy studies.
-
Combination Therapy of An Anti-Mouse PD-1 Antibody with An Anti-Human TREM1 Antibody
-

Antitumor activity of anti-mouse PD-1 antibody combined with anti-human TREM1 antibody in B-hTREM1 mice. (A) Anti-mouse PD-1 antibody combined with anti-human TREM1 antibody inhibited MC38 tumor growth in B-hTREM1 mice. Murine colon cancer MC38 cells were subcutaneously implanted into homozygous B-hTREM1 mice (female, 9-week-old, n=5). Mice were grouped when tumor volume reached approximately 80-100 mm3, at which time they were treated with mPD-1 and hTREM1 antibodies. (B) Body weight changes during treatment. As shown in panel A, combination of anti-hTREM1 and anti-mPD-1 antibody shows more inhibitory effects than individual groups, demonstrating that the B-hTREM1 mice provide a powerful preclinical model for in vivo evaluation of anti-human TREM1 antibody. Values are expressed as mean ± SEM.
-
Summary
-
mRNA expression analysis
The introduction of hTREM1 in place of its mouse counterpart does not change the expression level of TREM1 mRNA.
Protein expression analysis
Human TREM1 can be detected in macrophages (blood and tumor), M-MDSC(tumor), and neutrophil(blood)/G-MDSC(tumor) in homozygous B-hTREM1 mice.
Human TREM1 can be activated and cleaved efficiently in B-hTREM1 mice.
MC38 cells were able to establish tumors in B-hTREM1 mice and can be used for efficacy studies.
B-hTREM1 mice provide a powerful preclinical model for in vivo evaluation of anti-human TREM1 antibody.
