
Basic Information
-
Gene targeting strategy

-
Gene targeting strategy for B-hTROP2 mice.
The exon 1 of mouse Trop2 gene that encodes the full-length protein was replaced by human TROP2 exon 1 in B-hTROP2 mice.
-
mRNA expression analysis
-
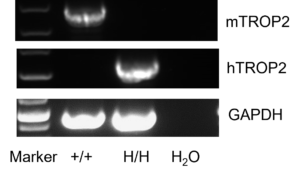
Strain specific analysis of TROP2 gene expression in wild type (WT) mice and B-hTROP2 mice by RT-PCR.
Mouse Trop2 mRNA was detectable only in the skin of WT mice (+/+). Human TROP2 mRNA was detectable only in homozygous B-hTROP2 mice (H/H) but not in WT mice (+/+).
-
Protein expression analysis
-
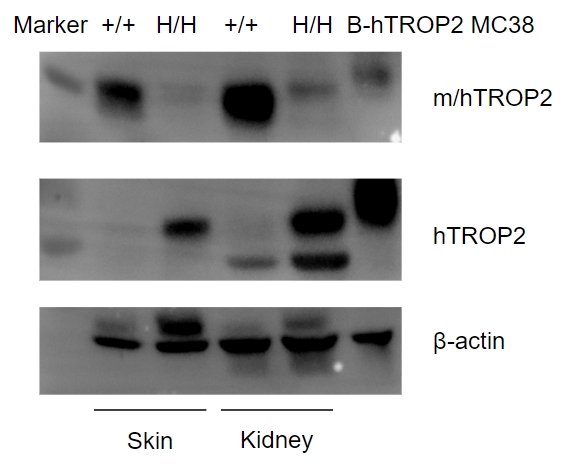
Strain specific TROP2 expression analysis in homozygous B-hTROP2 mice by western blot.
Skin and kidney tissues were collected from wild-type (WT) mice (+/+) and homozygous B-hTROP2 mice (H/H), and analyzed by western blot with anti-TROP2 antibody. Mouse TROP2 was detectable in WT mice (+/+) due to the cross-reactivity of antibodies. Human TROP2 was detectable in homozygous B-hTROP2 mice (H/H) and B-hTROP2 MC38 cell lines.
-
Protein expression profile of TROP2
-
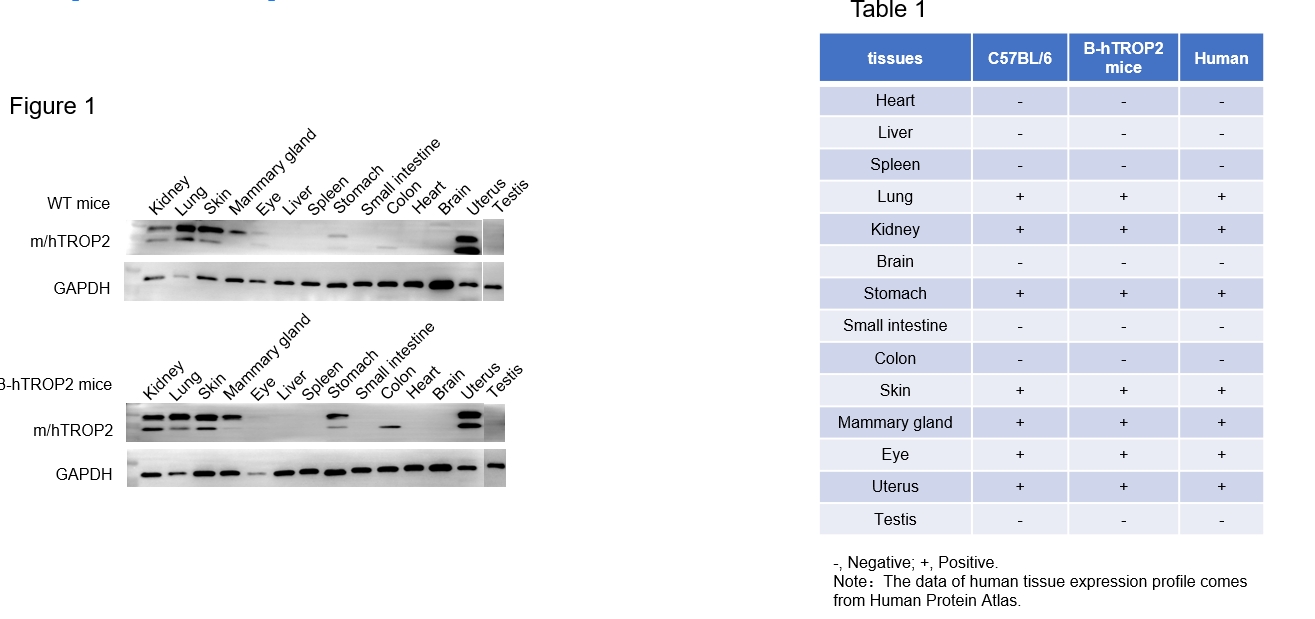
TROP2 protein expression in wild-type (WT) mice and B-hTROP2 mice by western blot.
Fourteen major tissues were collected from WT mice and homozygous B-hTROP2 mice (2 males and 2 females, 8 week-old), and analyzed by western blotting with anti-TROP2 antibodies. TROP2 was detected in the lung, kidney, stomach, skin, mammary gland, eye, and uterus of WT mice and B-hTROP2 mice due to the cross-reactivity of antibodies, but not expressed in the heart, liver, spleen, brain, small intestine, colon, and testis (Figure 1). The results showed that humanized TROP2 did not change the expression site of TROP2 protein in mice, and the expression profile of TROP2 in B-hTROP2 mice was similar to that in normal human tissues (Table 1). B-hTROP2 mice can be used to evaluate the toxicity of TROP2 drugs.
-
Analysis of spleen leukocytes cell subpopulations in B-hTROP2 mice
-
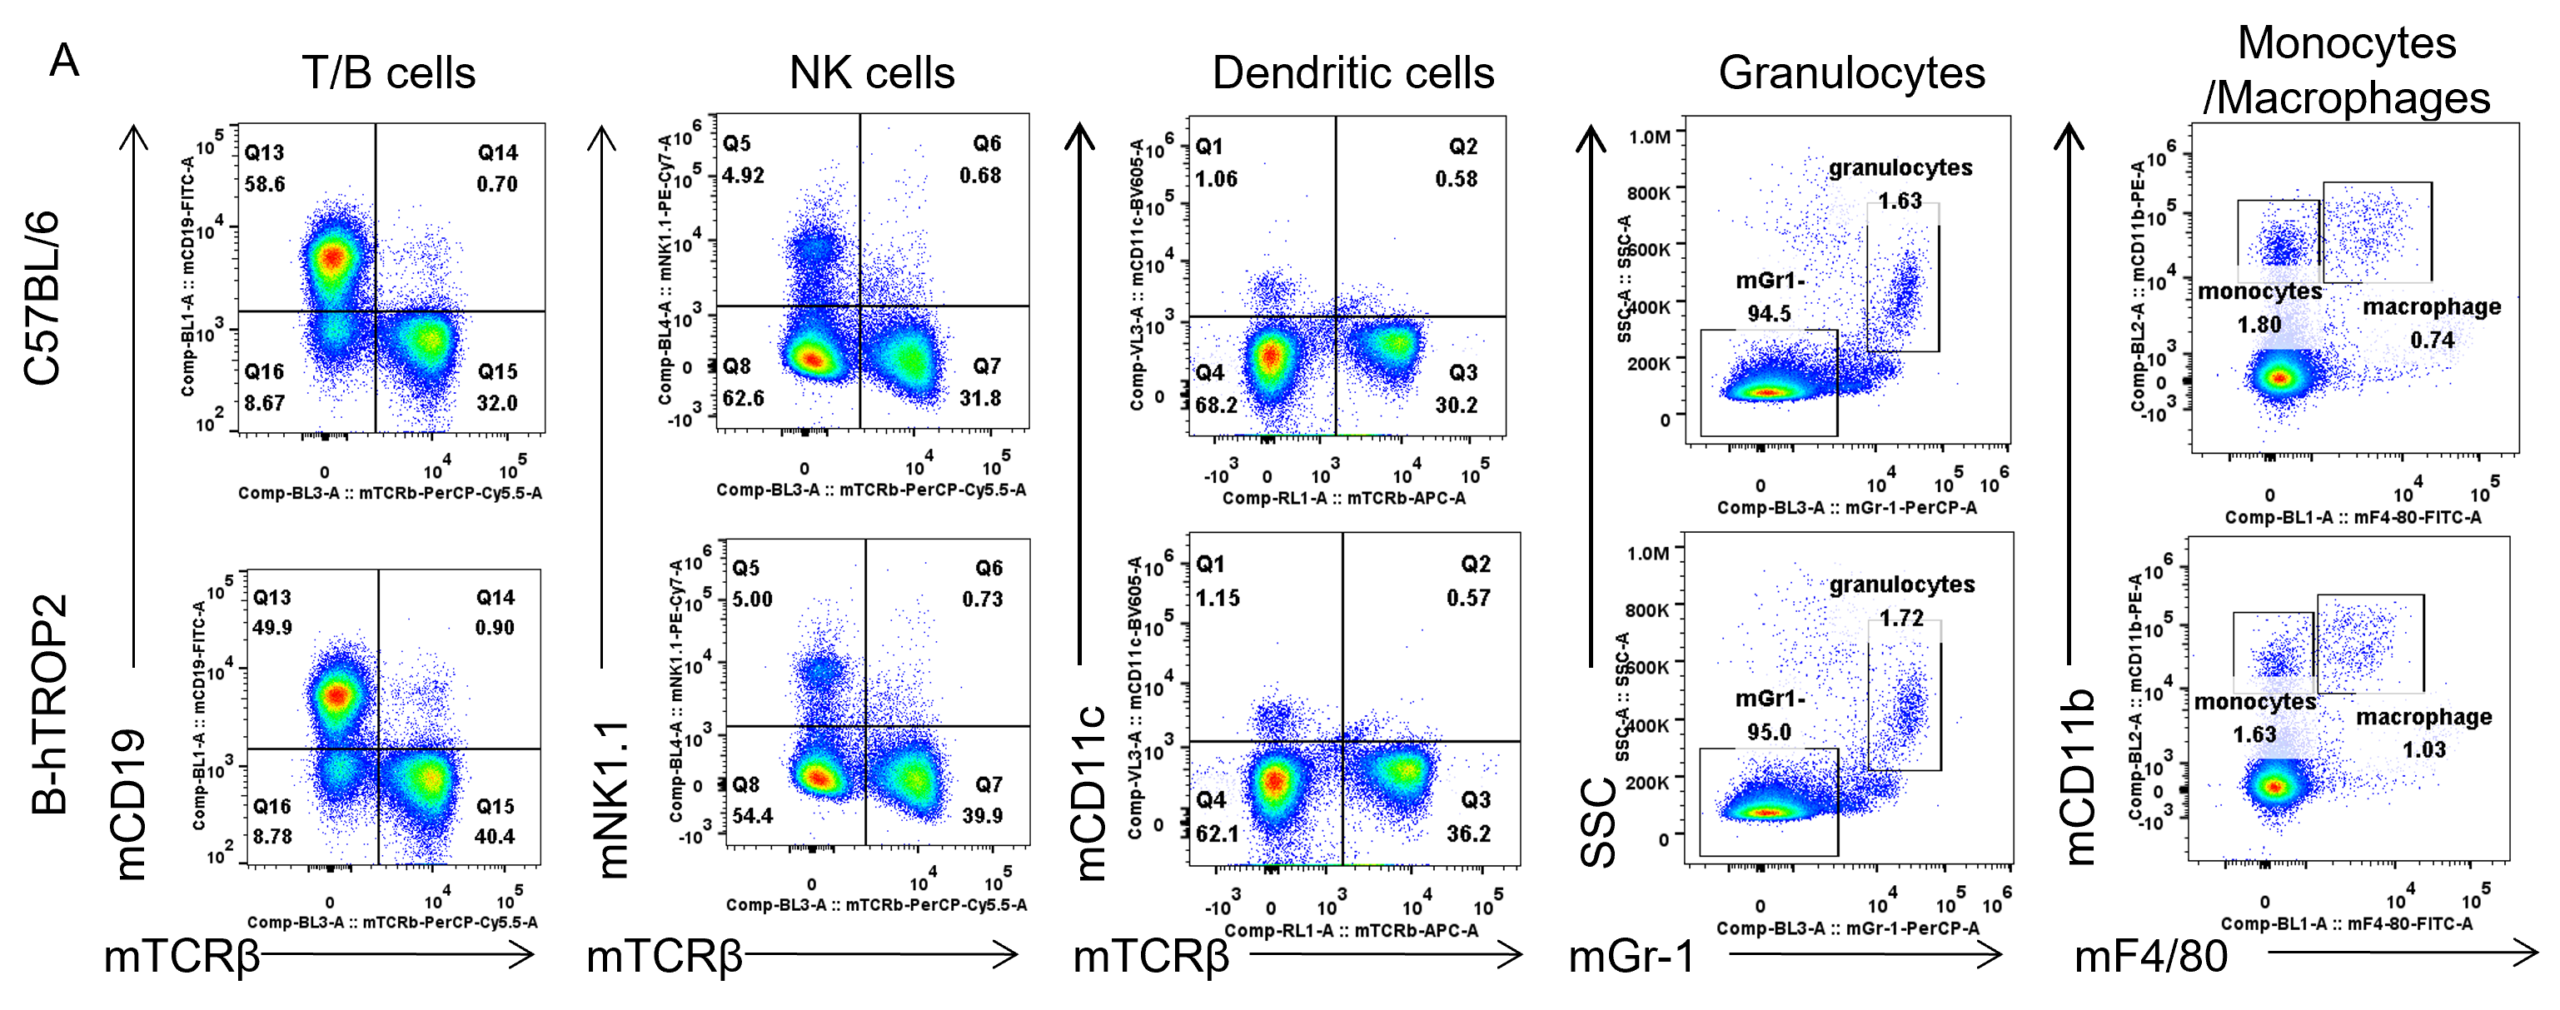
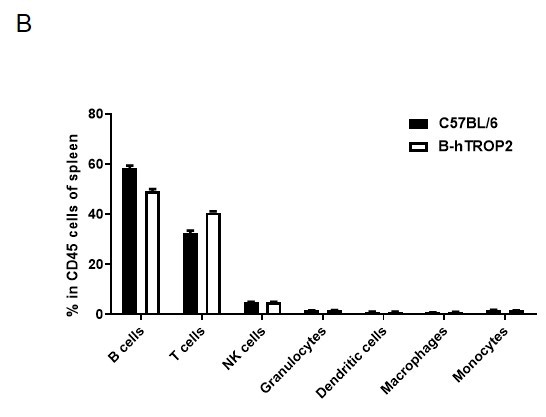
Analysis of spleen leukocyte subpopulations by FACS.
Splenocytes were isolated from female C57BL/6 and B-hTROP2 mice (n=3, 6 week-old). Flow cytometry analysis of the splenocytes was performed to assess leukocyte subpopulations. A. Representative FACS plots. Single live cells were gated for CD45 population and used for further analysis as indicated here. B. Results of FACS analysis. Percent of T cells, B cells, NK cells, dendritic cells, granulocytes, monocytes and macrophages in homozygous B-hTROP2 mice were similar to those in the C57BL/6 mice, demonstrating that introduction of hTROP2 in place of its mouse counterpart does not change the overall development, differentiation or distribution of these cell types in spleen. Values are expressed as mean ± SEM.
-
Analysis of spleen T cell subpopulations in B-hTROP2 mice
-
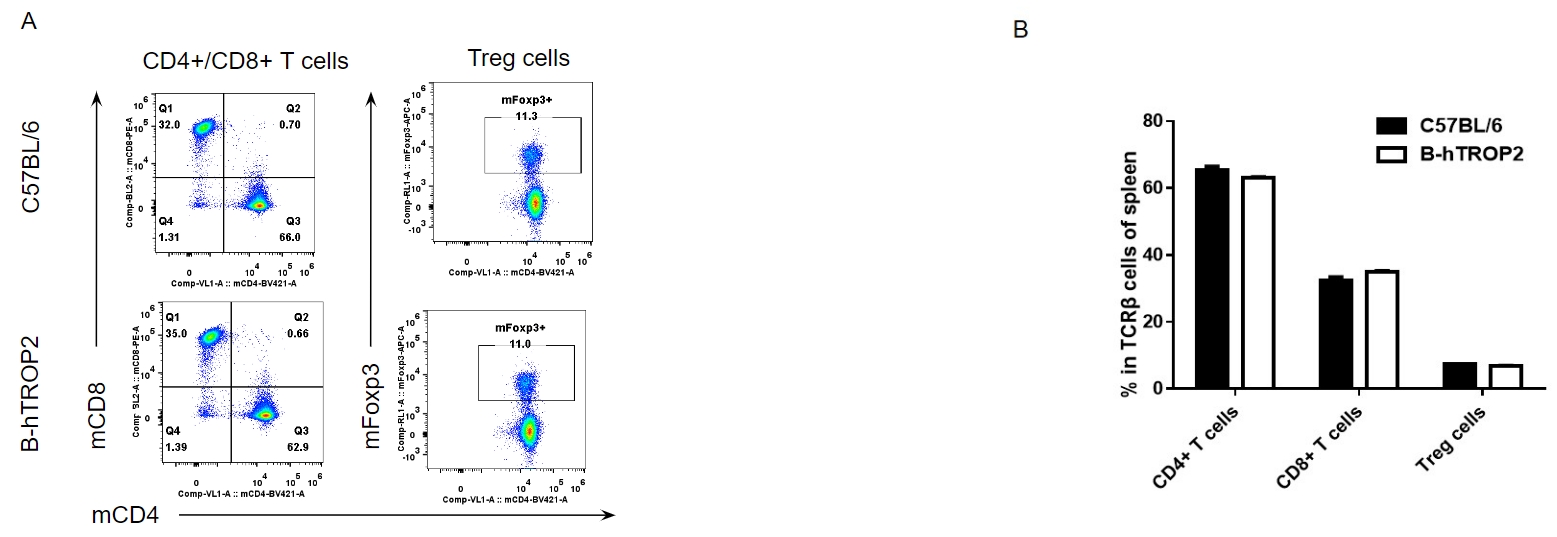
Analysis of spleen T cell subpopulations by FACS.
Splenocytes were isolated from female C57BL/6 and B-hTROP2 mice (n=3, 6 week-old). Flow cytometry analysis of the splenocytes was performed to assess leukocyte subpopulations. A. Representative FACS plots. Single live CD45+ cells were gated for CD3 T cell population and used for further analysis as indicated here. B. Results of FACS analysis. Percent of CD8+ T cells, CD4+ T cells and Treg cells in homozygous B-hTROP2 mice were similar to those in the C57BL/6 mice, demonstrating that introduction of hTROP2 in place of its mouse counterpart does not change the overall development, differentiation or distribution of these T cell sub types in spleen. Values are expressed as mean ± SEM.
-
Analysis of lymph node leukocytes cell subpopulations in B-hTROP2 mice
-
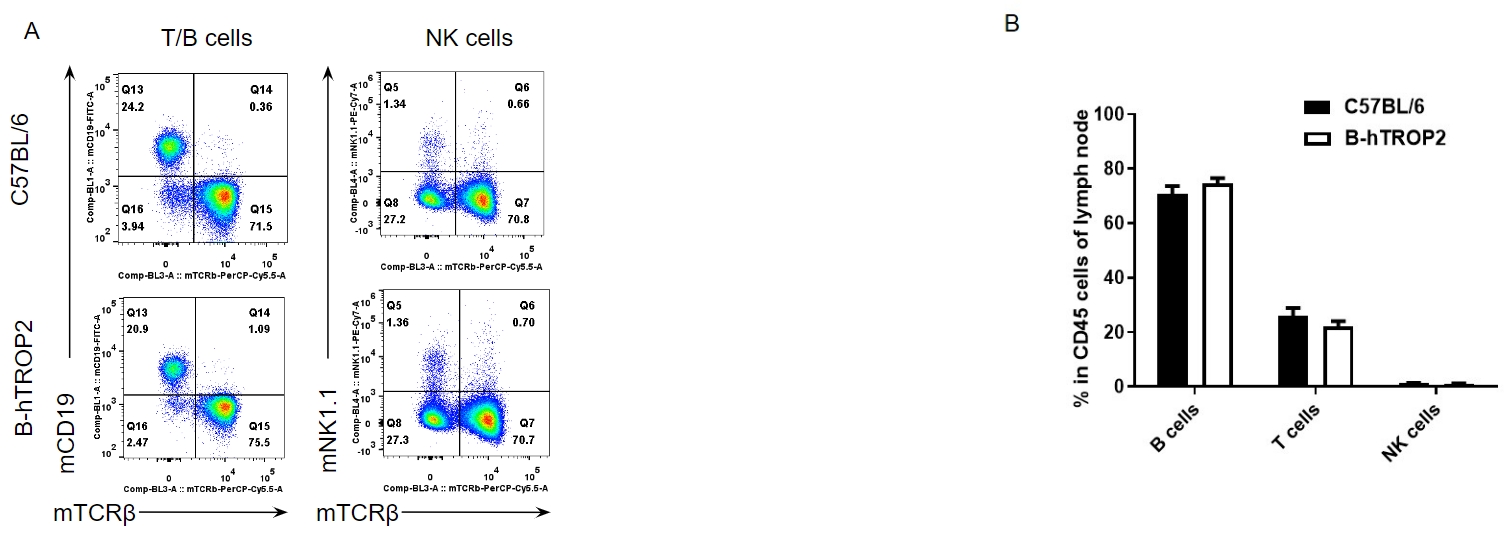
Analysis of lymph node leukocyte subpopulations by FACS.
Leukocytes were isolated from female C57BL/6 and B-hTROP2 mice (n=3, 6 week-old). Flow cytometry analysis of the leukocytes was performed to assess leukocyte subpopulations. A. Representative FACS plots. Single live cells were gated for CD45 population and used for further analysis as indicated here. B. Results of FACS analysis. Percent of T cells, B cells and NK cells in homozygous B-hTROP2 mice were similar to those in the C57BL/6 mice, demonstrating that introduction of hTROP2 in place of its mouse counterpart does not change the overall development, differentiation or distribution of these cell types in lymph node. Values are expressed as mean ± SEM.
-
Analysis of lymph node T cell subpopulations in B-hTROP2 mice
-
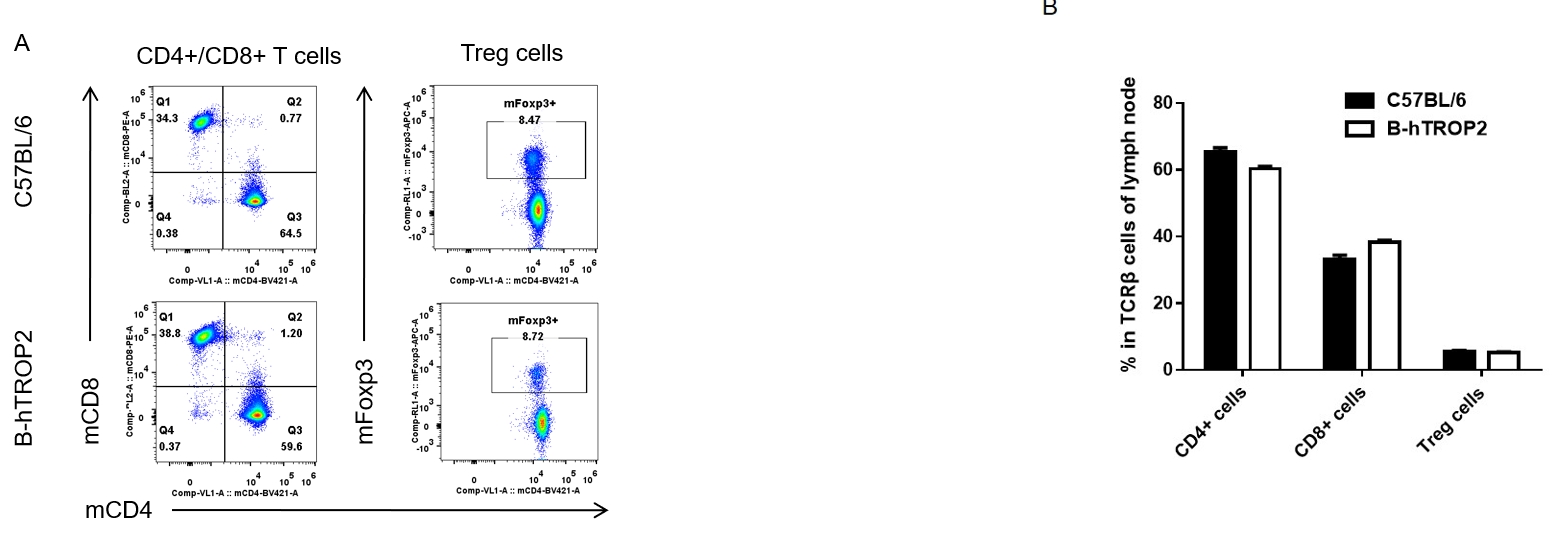
Analysis of lymph node T cell subpopulations by FACS.
Leukocytes were isolated from female C57BL/6 and B-hTROP2 mice (n=3, 6 week-old). Flow cytometry analysis of the leukocytes was performed to assess leukocyte subpopulations. A. Representative FACS plots. Single live CD45+ cells were gated for CD3 T cell population and used for further analysis as indicated here. B. Results of FACS analysis. Percent of CD8+ T cells, CD4+ T cells and Treg cells in homozygous B-hTROP2 mice were similar to those in the C57BL/6 mice, demonstrating that introduction of hTROP2 in place of its mouse counterpart does not change the overall development, differentiation or distribution of these T cell sub types in lymph node. Values are expressed as mean ± SEM.
-
Analysis of blood leukocytes cell subpopulations in B-hTROP2 mice
-
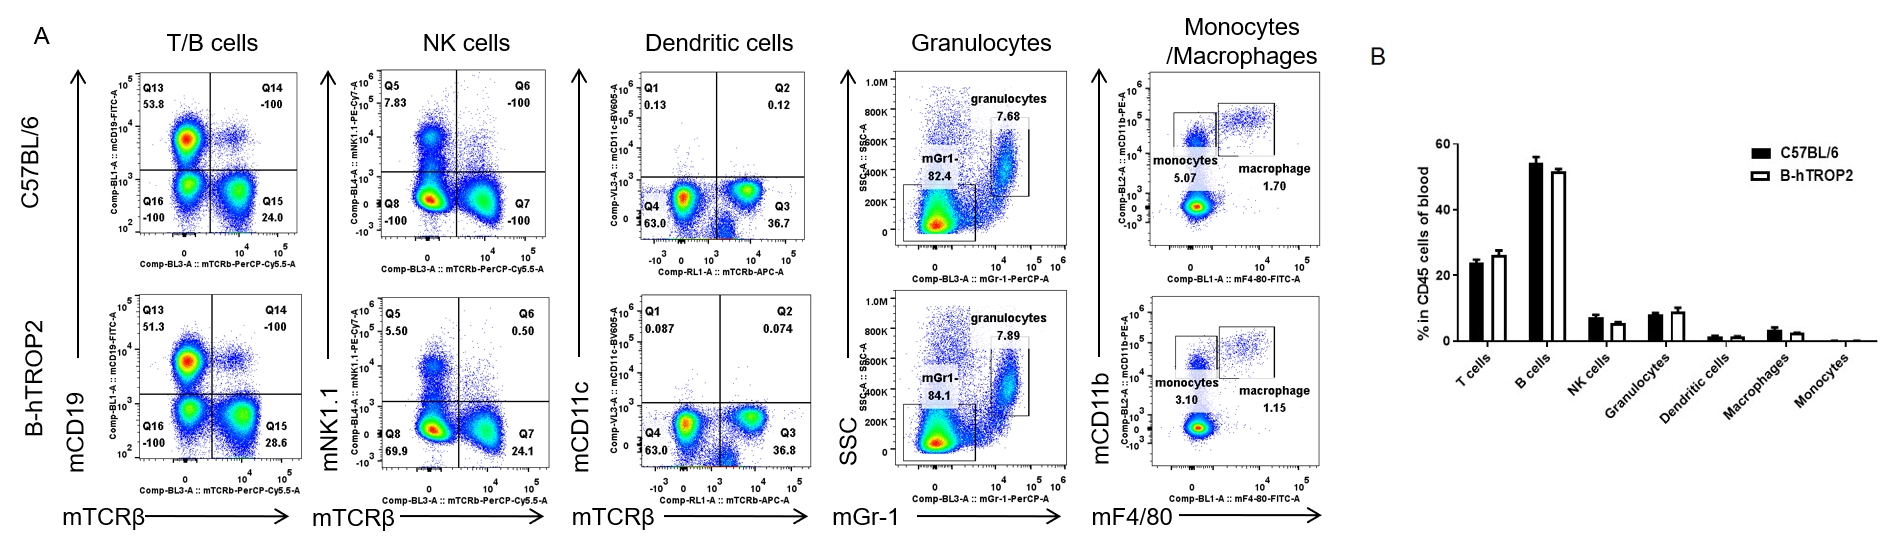
Analysis of blood leukocyte subpopulations by FACS.
Blood cells were isolated from female C57BL/6 and B-hTROP2 mice (n=3, 6 week-old). Flow cytometry analysis of the blood leukocytes was performed to assess leukocyte subpopulations. A. Representative FACS plots. Single live cells were gated for CD45 population and used for further analysis as indicated here. B. Results of FACS analysis. Percent of T cells, B cells, NK cells, dendritic cells, granulocytes, monocytes and macrophages in homozygous B-hTROP2 mice were similar to those in the C57BL/6 mice, demonstrating that introduction of hTROP2 in place of its mouse counterpart does not change the overall development, differentiation or distribution of these cell types in blood. Values are expressed as mean ± SEM.
-
Analysis of blood T cell subpopulations in B-hTROP2 mice
-
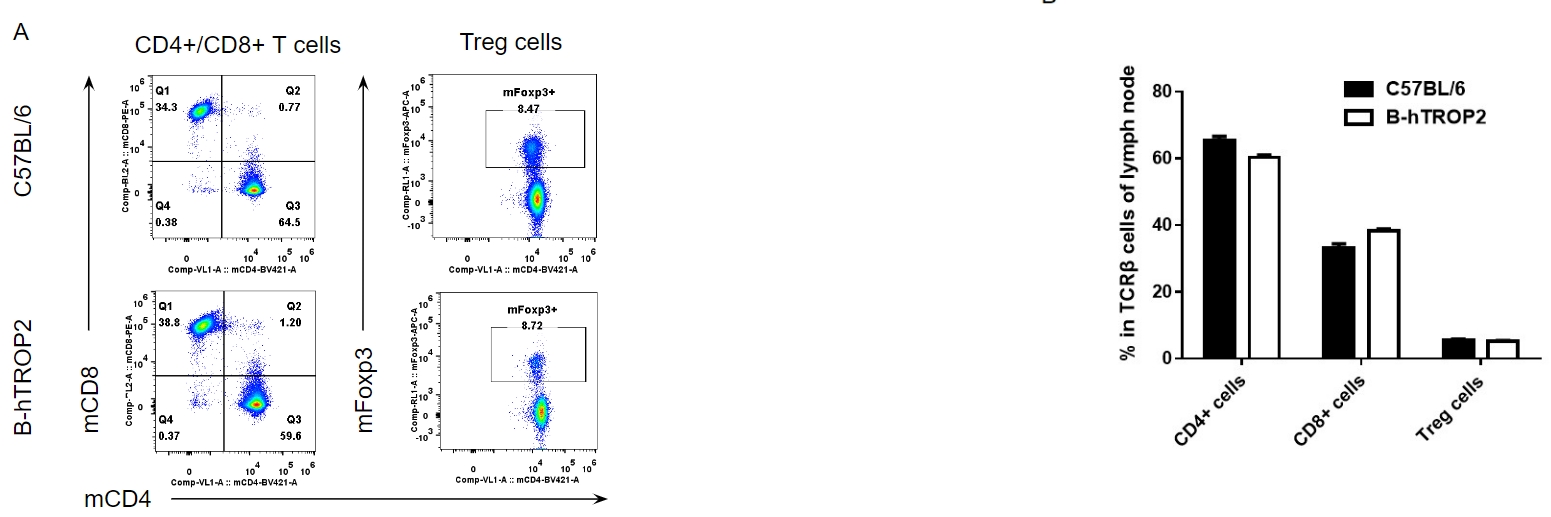
Analysis of blood T cell subpopulations by FACS.
Blood cells were isolated from female C57BL/6 and B-hTROP2 mice (n=3, 6 week-old). Flow cytometry analysis of the leukocytes was performed to assess leukocyte subpopulations. A. Representative FACS plots. Single live CD45+ cells were gated for CD3 T cell population and used for further analysis as indicated here. B. Results of FACS analysis. Percent of CD8+ T cells, CD4+ T cells and Treg cells in homozygous B-hTROP2 mice were similar to those in the C57BL/6 mice, demonstrating that introduction of hTROP2 in place of its mouse counterpart does not change the overall development, differentiation or distribution of these T cell sub types in blood. Values are expressed as mean ± SEM.
-
Blood routine test in B-hTROP2 mice
-
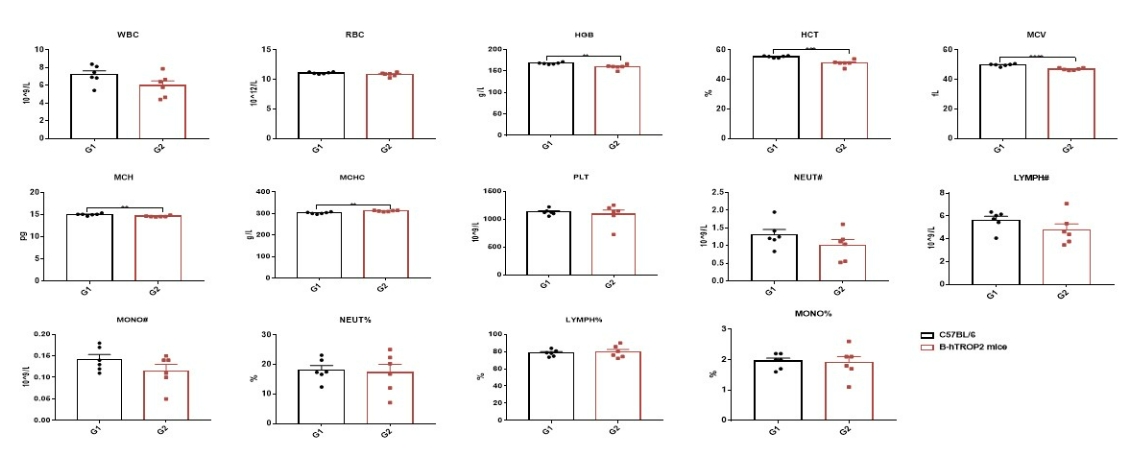
Complete blood count (CBC).
Blood from female C57BL/6 and B-hTROP2 mice (n=6, 9-week-old) was collected and analyzed for CBC. There were no differences among any measurement between C57BL/6 and B-hTROP2 mice, indicating that introduction of hTROP2 in place of its mouse counterpart does not change blood cell composition and morphology. Values are expressed as mean ± SEM.
-
Blood chemistry of B-hTROP2 mice
-
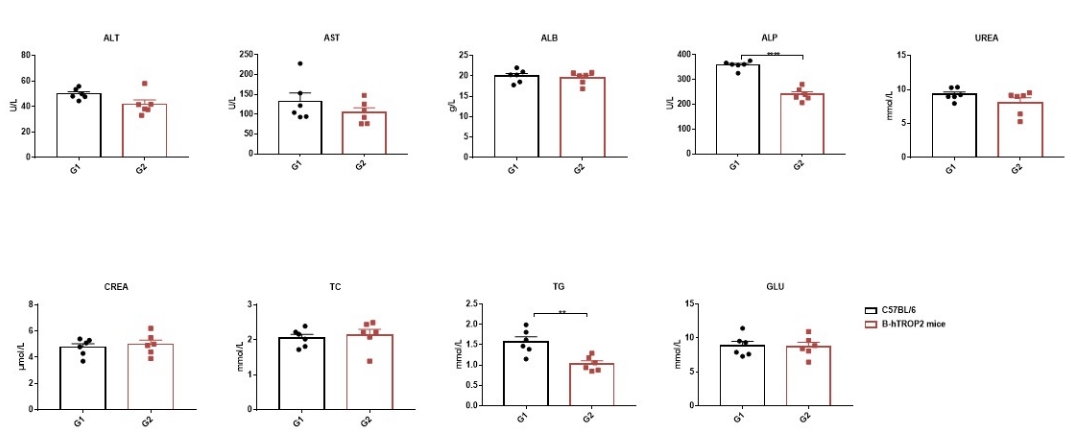
Blood chemistry tests of B-hTROP2 mice.
Serum from the C57BL/6 and B-hTROP2 mice (n=6, 9-week-old) was collected and analyzed for levels of ALT and AST. There were no differences on either measurement between C57BL/6 and B-hTROP2 mice, indicating that introduction of hTROP2 in place of its mouse counterpart does not change ALT and AST levels or health of liver. Values are expressed as mean ± SEM.
-
Summary
-
mRNA expression analysis:
Mouse TROP2 mRNA was detectable in skin of WT mice (+/+). Human TROP2 mRNA was exclusively detectable in homozygous B-hTROP2 mice (H/H) mice but not in WT mice (+/+).
Protein expression analysis:
Human TROP2 was exclusively detectable in skin and kidney of homozygous B-hTROP2 mice (H/H) mice but not in WT mice (+/+), and mouse TROP2 was detectable in WT mice (+/+).
TROP2 was detected in the lung, kidney, stomach, skin, mammary gland, eye, and uterus of WT mice and B-hTROP2 mice due to the cross-reactivity of antibodies, but not or low expressed in the heart, liver, spleen, brain, small intestine, colon, and testis.
Leukocytes cell subpopulation analysis:
TROP2 humanized does not change the overall development, differentiation or distribution of immune cell types in spleen, Lymph nodes and blood.
-
Poster
-
Related mouse models
-
