
Basic Information
-
Gene targeting strategy

-
Gene targeting strategy for B-hTPBG mice. The exon 2 of mouse Tpbg gene that encodes the full-length protein was replaced by human TPBG exon 2 in B-hTPBG mice.
-
mRNA expression analysis
-
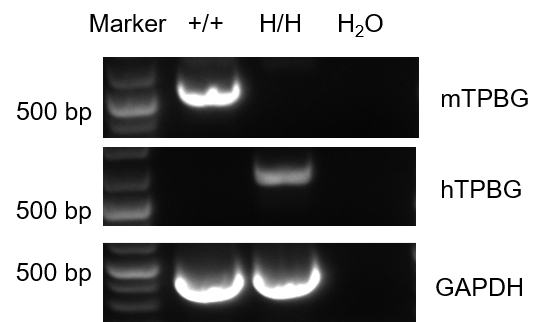
Species-specific TPBG gene expression analysis in wild-type and humanized B-hTPBG mice by RT-PCR. Murine Tpbg mRNA was detected in splenocytes isolated from wild-type (+/+), while human TPBG mRNA was exclusively detected in homozygous B-hTPBG (H/H) mice.
-
Protein expression analysis
-
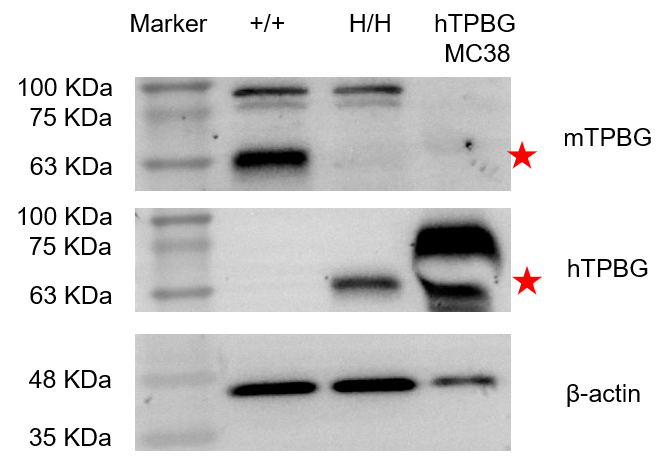
Species-specific TPBG protein expression analysis in wild-type and humanized B-hTPBG mice. Spinal tissue was isolated from wild-type and homozygous B-hTPBG (H/H) mice and analyzed by western blot using species-specific anti-TPBG antibodies. Murine TPBG protein was detected in wild-type mice (target band size is 63 kDa), while human TPBG protein was exclusively in B-hTPBG mice and hTPBG MC38 cells.
-
Immune cell profiling in humanized B-hTPBG mice
-
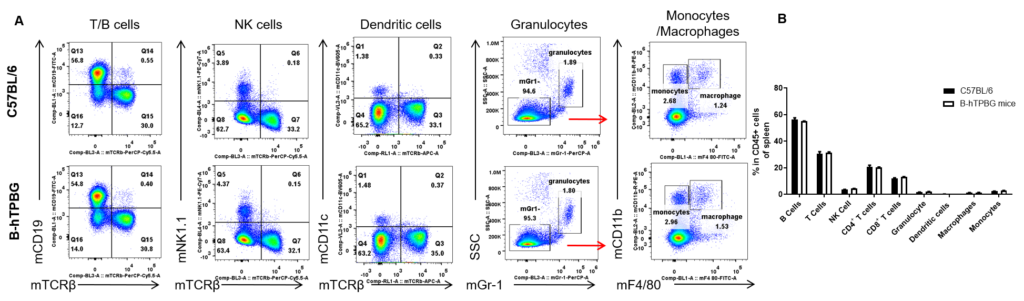
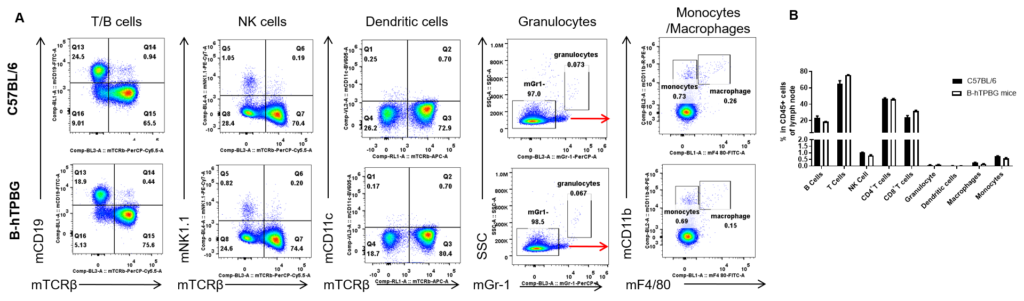
Analysis of spleen leukocyte subpopulations by FACS. Splenocytes were isolated from female C57BL/6 and B-hTPBG mice (n=3, 6-week-old). Flow cytometry analysis of the splenocytes was performed to assess leukocyte subpopulations. A. Representative FACS plots. Single live cells were gated for the CD45+ population and used for further analysis as indicated here. B. Results of FACS analysis. Percent of T cells, B cells, NK cells, dendritic cells, granulocytes, monocytes and macrophages in homozygous B-hTPBG mice were similar to those in the C57BL/6 mice, demonstrating that TPBG humanized does not change the overall development, differentiation or distribution of these cell types in spleen. Values are expressed as mean ± SEM.
Analysis of spleen T cell subpopulations in B-hTPBG mice
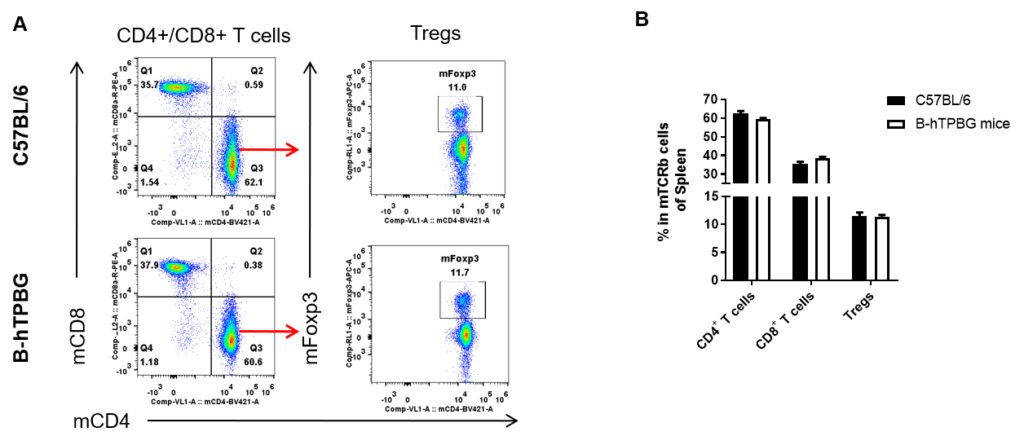
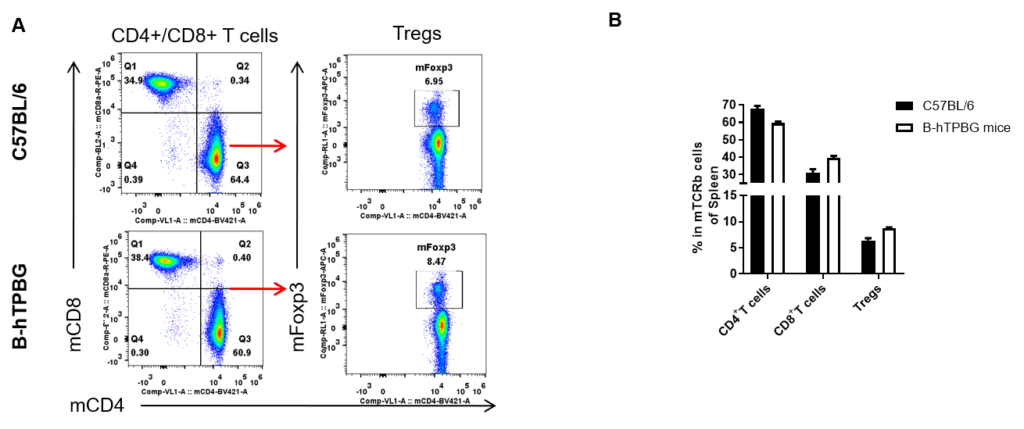
Analysis of spleen T cell subpopulations by FACS. Splenocytes were isolated from female C57BL/6 and B-hTPBG mice (n=3, 6-week-old). Flow cytometry analysis of the splenocytes was performed to assess leukocyte subpopulations. A. Representative FACS plots. Single live CD45+ cells were gated for TCRβ+T cell population and used for further analysis as indicated here. B. Results of FACS analysis. The percent of CD8+ T cells, CD4+ T cells, and Tregs in homozygous B-hTPBG mice were similar to those in the C57BL/6 mice, demonstrating that introduction of hTPBG in place of its mouse counterpart does not change the overall development, differentiation or distribution of these T cell subtypes in spleen. Values are expressed as mean ± SEM.
Analysis of leukocytes subpopulation in TPBG mice
Analysis of lymph node leukocyte subpopulations by FACS. Lymph node was isolated from female C57BL/6 and B-hTPBG mice (n=3, 6-week-old). Flow cytometry analysis of the lymph node was performed to assess leukocyte subpopulations. A. Representative FACS plots. Single live cells were gated for the CD45+ population and used for further analysis as indicated here. B. Results of FACS analysis. Percent of T cells, B cells, NK cells, dendritic cells, granulocytes, monocytes and macrophages in homozygous B-hTPBG mice were similar to those in the C57BL/6 mice, demonstrating that TPBG humanized does not change the overall development, differentiation or distribution of these cell types in lymph node. Values are expressed as mean ± SEM.
Analysis of lymph node T cell subpopulations in B-hTPBG mice
Analysis of lymph node T cell subpopulations by FACS. Lymph node was isolated from female C57BL/6 and B-hTPBG mice (n=3, 6-week-old). Flow cytometry analysis of the lymph node was performed to assess leukocyte subpopulations. A. Representative FACS plots. Single live CD45+ cells were gated for CD3+ T cell population and used for further analysis as indicated here. B. Results of FACS analysis. The percent of CD8+ T cells, CD4+ T cells, and Tregs in homozygous B-hTPBG mice were similar to those in the C57BL/6 mice, demonstrating that introduction of hTPBG in place of its mouse counterpart does not change the overall development, differentiation or distribution of these T cell subtypes in lymph node. Values are expressed as mean ± SEM.
Analysis of leukocytes subpopulation in B-hTPBG mice

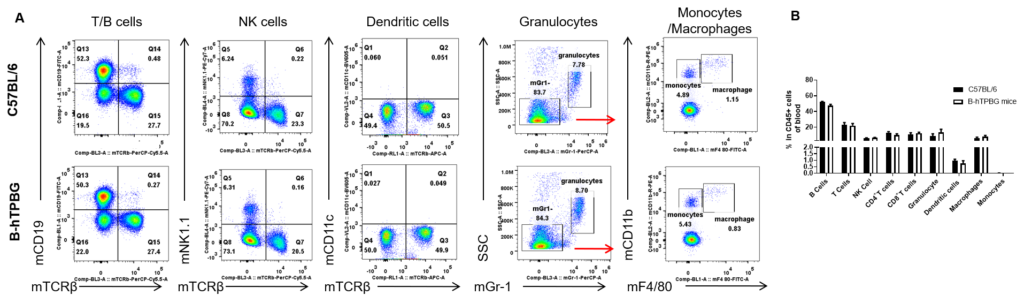
Analysis of blood leukocyte subpopulations by FACS. Blood was isolated from female C57BL/6 and B-hTPBG mice (n=3, 6-week-old). Flow cytometry analysis of the blood cells was performed to assess leukocyte subpopulations. A. Representative FACS plots. Single live cells were gated for the CD45+ population and used for further analysis as indicated here. B. Results of FACS analysis. Percent of T cells, B cells, NK cells, dendritic cells, granulocytes, monocytes and macrophages in homozygous B-hTPBG mice were similar to those in the C57BL/6 mice, demonstrating that TPBG humanized does not change the overall development, differentiation or distribution of these cell types in blood. Values are expressed as mean ± SEM.
Analysis of blood T cell subpopulations in B-hTPBG mice
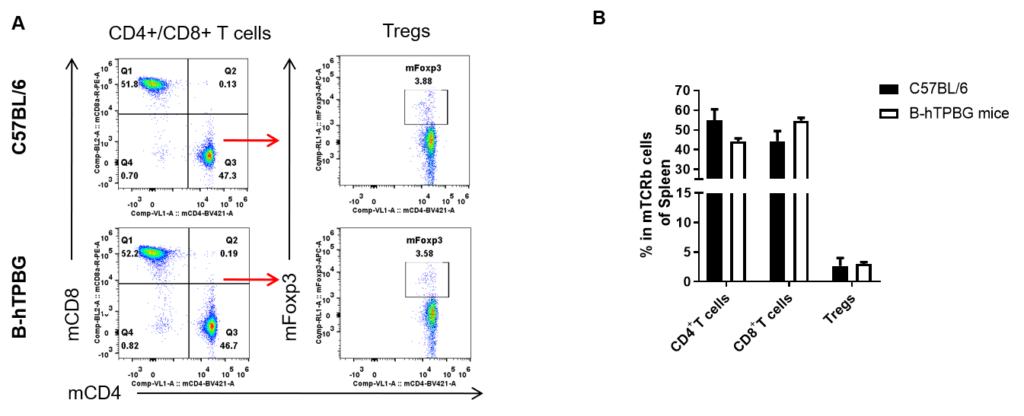
Analysis of blood T cell subpopulations by FACS. Blood was isolated from female C57BL/6 and B-hTPBG mice (n=3, 6-week-old). Flow cytometry analysis of the blood cells was performed to assess leukocyte subpopulations. A. Representative FACS plots. Single live CD45+ cells were gated for CD3+ T cell population and used for further analysis as indicated here. B. Results of FACS analysis. The percent of CD8+ T cells, CD4+ T cells, and Tregs in homozygous B-hTPBG mice were similar to those in the C57BL/6 mice, demonstrating that introduction of hTPBG in place of its mouse counterpart does not change the overall development, differentiation or distribution of these T cell subtypes in blood. Values are expressed as mean ± SEM.
-
Blood Chemistry
-
Blood routine test in B-hTPBG mice
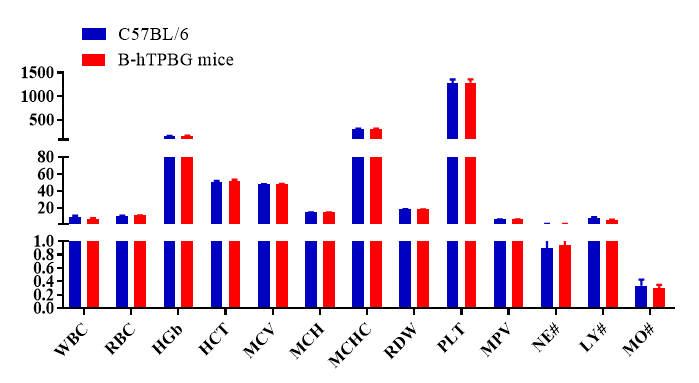
Complete blood count (CBC). Blood from female C57BL/6 and B-hTPBG mice (n=6, 6-8 week-old) was collected and analyzed for CBC. Results indicate that introduction of hTPBG in place of its mouse counterpart does not change blood cell composition and morphology. Values are expressed as mean ± SEM.
Blood chemistry of B-hTPBG mice
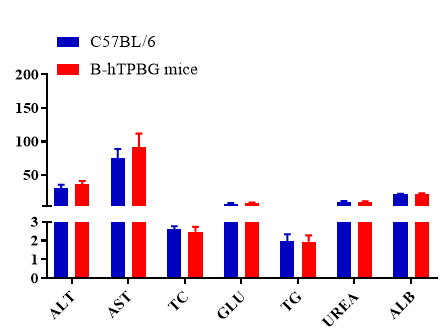
Blood chemistry tests of B-hTPBG mice. Serum from the C57BL/6 and B-hTPBG mice (n=6, 6-8 week-old) was collected and analyzed. There was no differences on either measurement between C57BL/6 and B-hTPBG mice, indicating that introduction of hTPBG in place of its mouse counterpart does not change ALT and AST levels or health of liver. Values are expressed as mean ± SEM.
