Description
EGFR: A Key Driver of Cell Growth and Cancer Progression
- Gene Information: EGFR encodes a transmembrane receptor tyrosine kinase belonging to the ErbB receptor family. EGFR plays a central role in regulating cell proliferation, survival, differentiation, and tissue repair and is frequently dysregulated in cancer.
- Protein Expression: EGFR is widely expressed in epithelial tissues, including the skin, lung, gastrointestinal tract, liver, and kidney. It is also detected in various epithelial-derived tumors, where overexpression, amplification, or activating mutations can drive tumor growth and disease progression.
- Signaling Pathway: EGFR is activated by ligands such as EGF and TGF-α, inducing receptor dimerization and activation of downstream pathways including RAS/RAF/MEK/ERK, PI3K/Akt/mTOR, JAK/STAT, and PLCγ/PKC. These signaling cascades promote cell proliferation, survival, migration, angiogenesis, and tumor progression.
- Therapeutic Inhibition: Current EGFR-targeted therapies include monoclonal antibodies and tyrosine kinase inhibitors (TKIs). Emerging approaches such as bispecific antibodies, ADCs, and combination therapies are being developed to overcome resistance and enhance anti-tumor efficacy.
Targeting strategy
EGFR
- A chimeric CDS that encodes human EGFR extracellular domain, mouse Egfr signal peptide, transmembrane and cytoplasmic domain, followed by mouse 3’UTR-STOP is inserted right after mouse Egfr exon2.
- The chimeric EGFR protein expression was driven by endogenous mouse Egfr promoter, while mouse Egfr gene transcription and translation will be disrupted.
EGFR Expression by RT-PCR
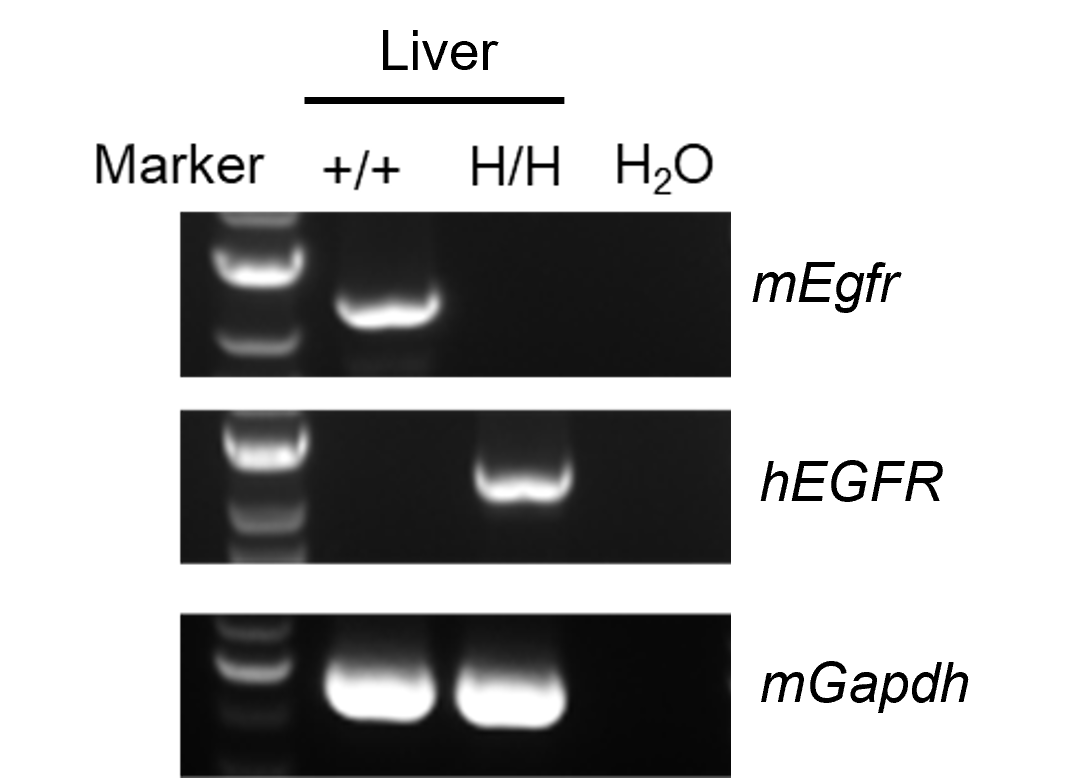
- Human EGFR is specifically and correctly expressed in B-hEGFR mice(C).
Human EGFR was detectable in B-hEGFR mice(C) by RT-PCR and sequencing. Liver tissue were isolated from wild-type BALB/cCrSlcNifdc mice (+/+) and homozygous B-hEGFR mice(C) (H/H). Primers were designed to detect human and mouse EGFR, respectively. Human EGFR mRNA was detectable in B-hEGFR mice(C), but not in wild-type mice. Sequencing of PCR products confirmed that the amplified sequences were consistent with database reference sequences.
Immunohistochemical Analysis
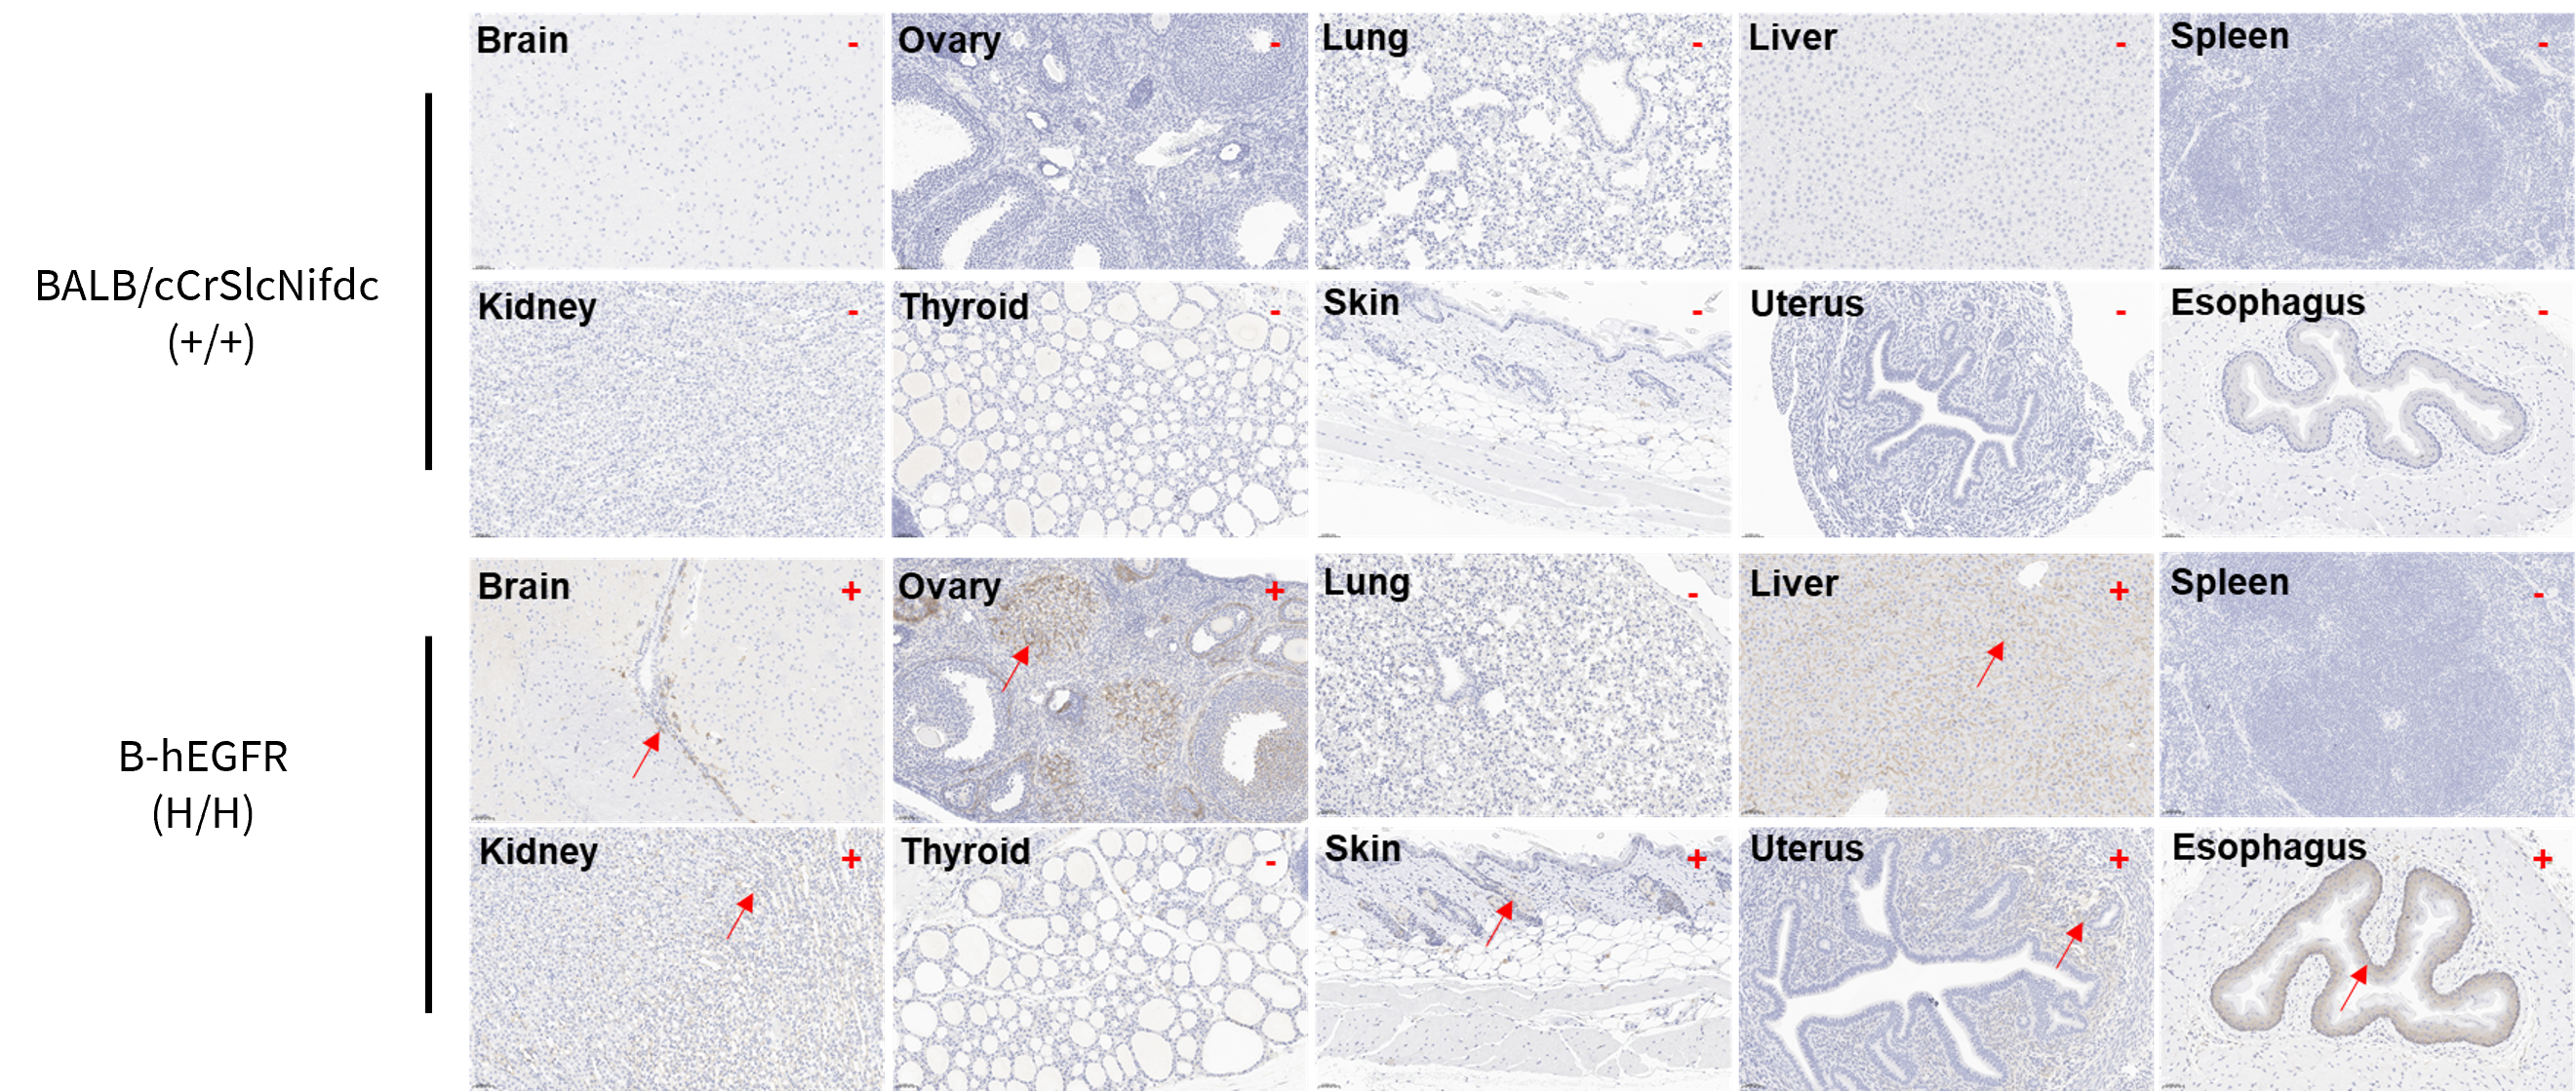
- Human EGFR expression was detected in the brain, liver, kidney, skin, uterus, esophagus, and ovary of homozygous B-hEGFR mice(C), but not in the lung, spleen, or thyroid. The antibodies were species-specific and did not bind to mouse EGFR in wild-type mice.
Immunohistochemical analysis of organs in B-hEGFR mice(C). Major organs were collected from wild-type BALB/cCrSlcNifdc mice and homozygous B-hEGFR mice(C) (female, 6 weeks old), and analyzed by IHC using anti-EGFR antibody (Invitrogen, MA5-49312). The arrow indicates tissue cells with positive EGFR staining (brown). "+" and "-" indicate positive and negative tissues, respectively.
Toxicity Analysis of Anti-human EGFR Antibody in B-hEGFR Mice(C)
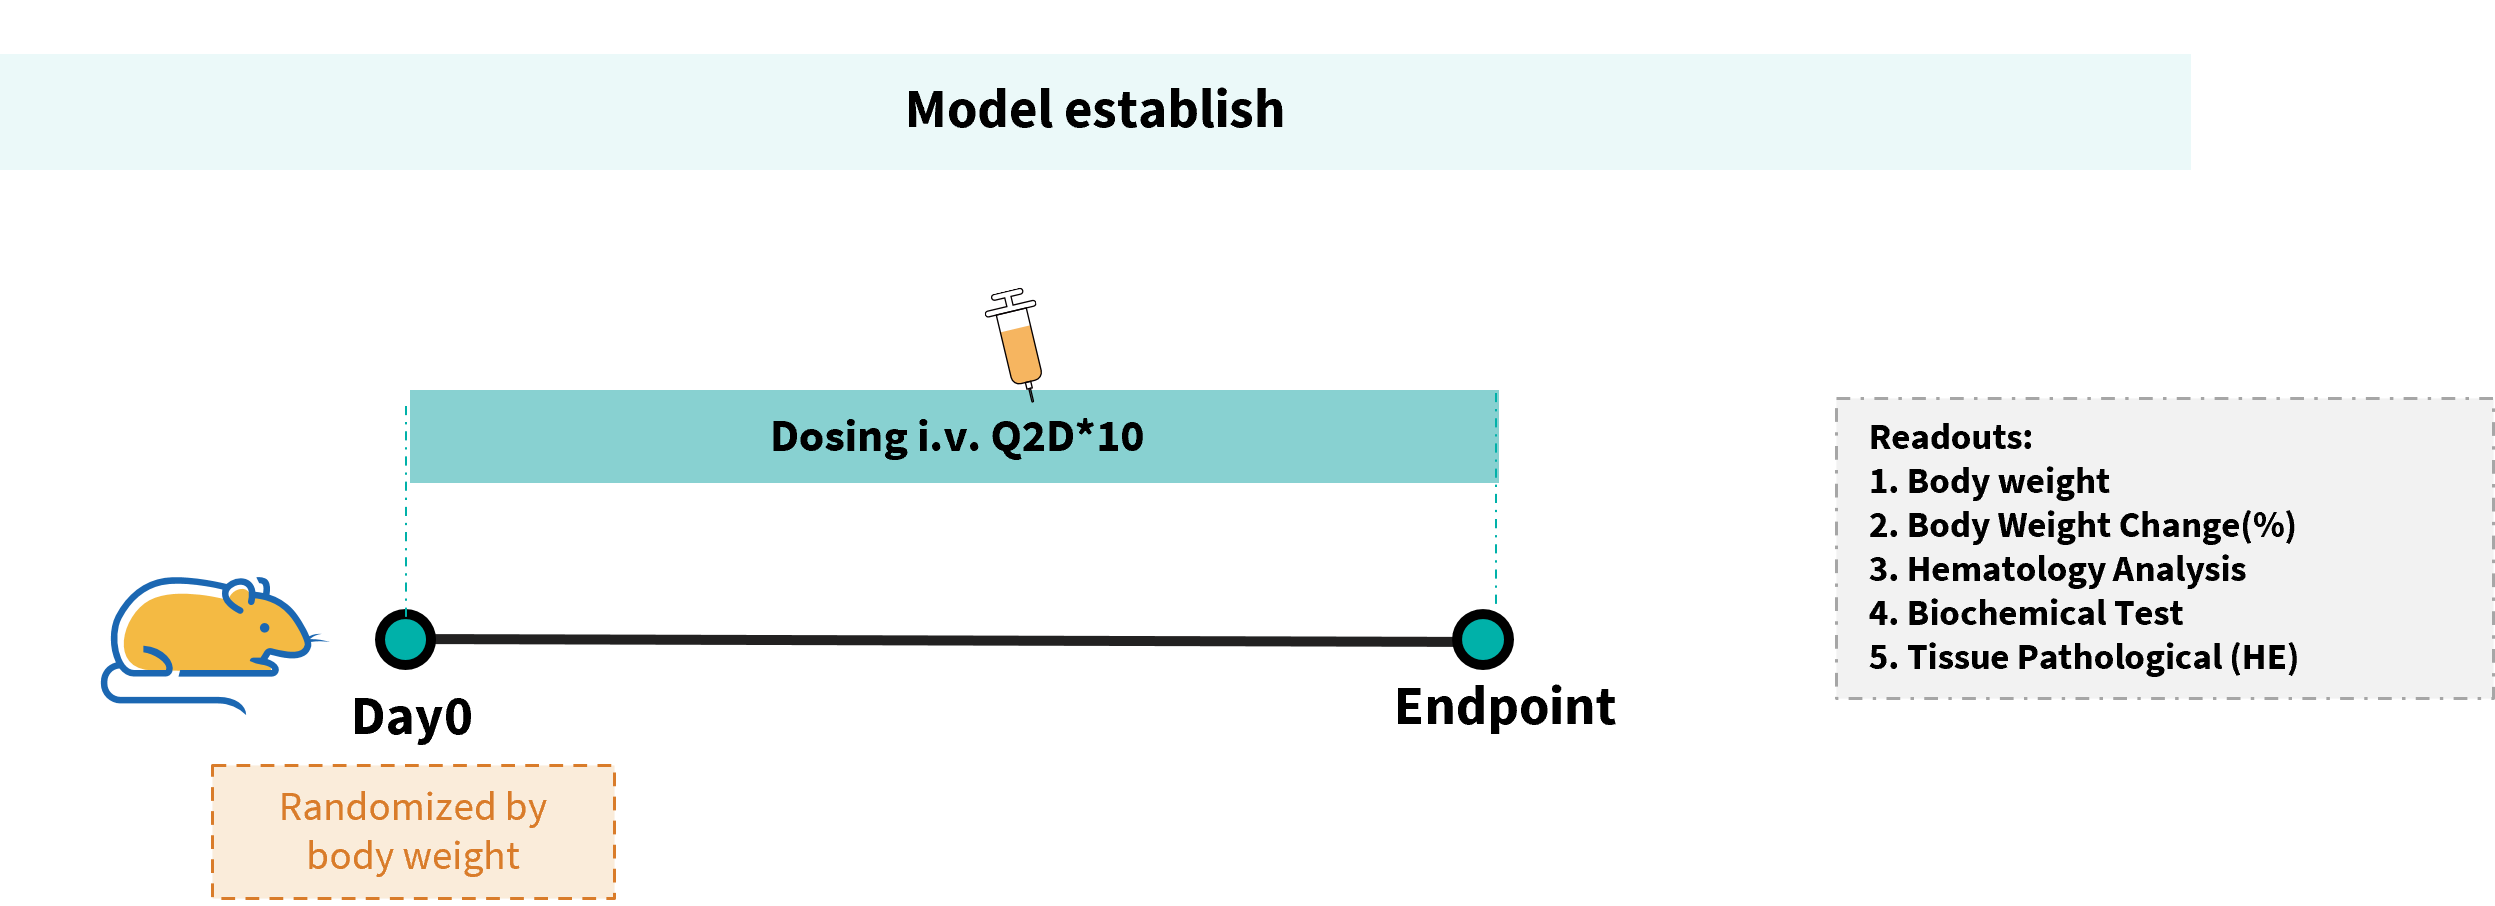
In vivo toxicity evaluation of EGFR-targeted antibody in B-hEGFR mice(C). Anti-human EGFR antibody cetuximab (Commercialized) were intravenously injected into B-hEGFR mice(C) (female, 6 weeks old, n=5). Mice were weighed every two days, and their condition was observed daily. At the end of the experiment, blood samples were collected for complete blood count test. Additionally, tissue samples were collected from the oral mucosa, muzzle skin, abdominal skin, liver, esophagus, stomach, duodenum, jejunum, ileum, uterus, and ovary, and then subjected to pathological analysis.
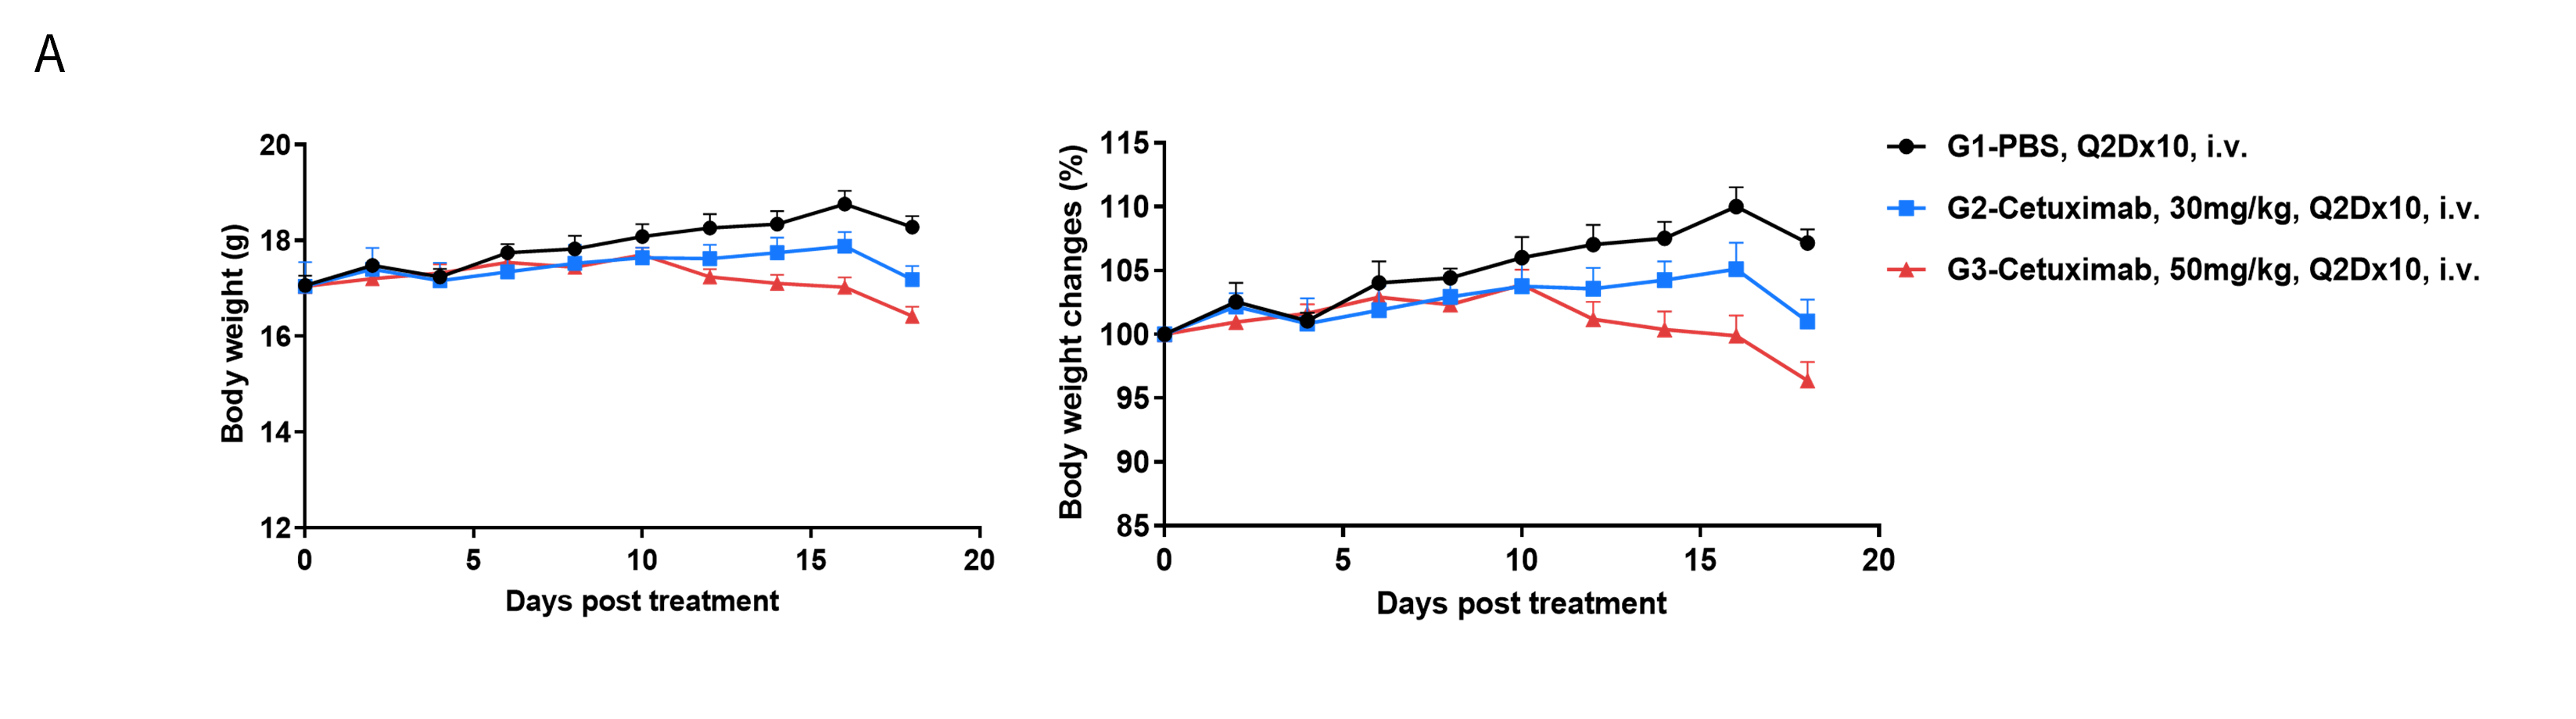
In vivo toxicity evaluation of EGFR-targeted antibody in B-hEGFR mice(C). (A) Body weight and body weight changes during treatment. The results showed decreased body weight of B-hEGFR mice(C) in the high-dose cetuximab group. Values are expressed as mean ± SEM.
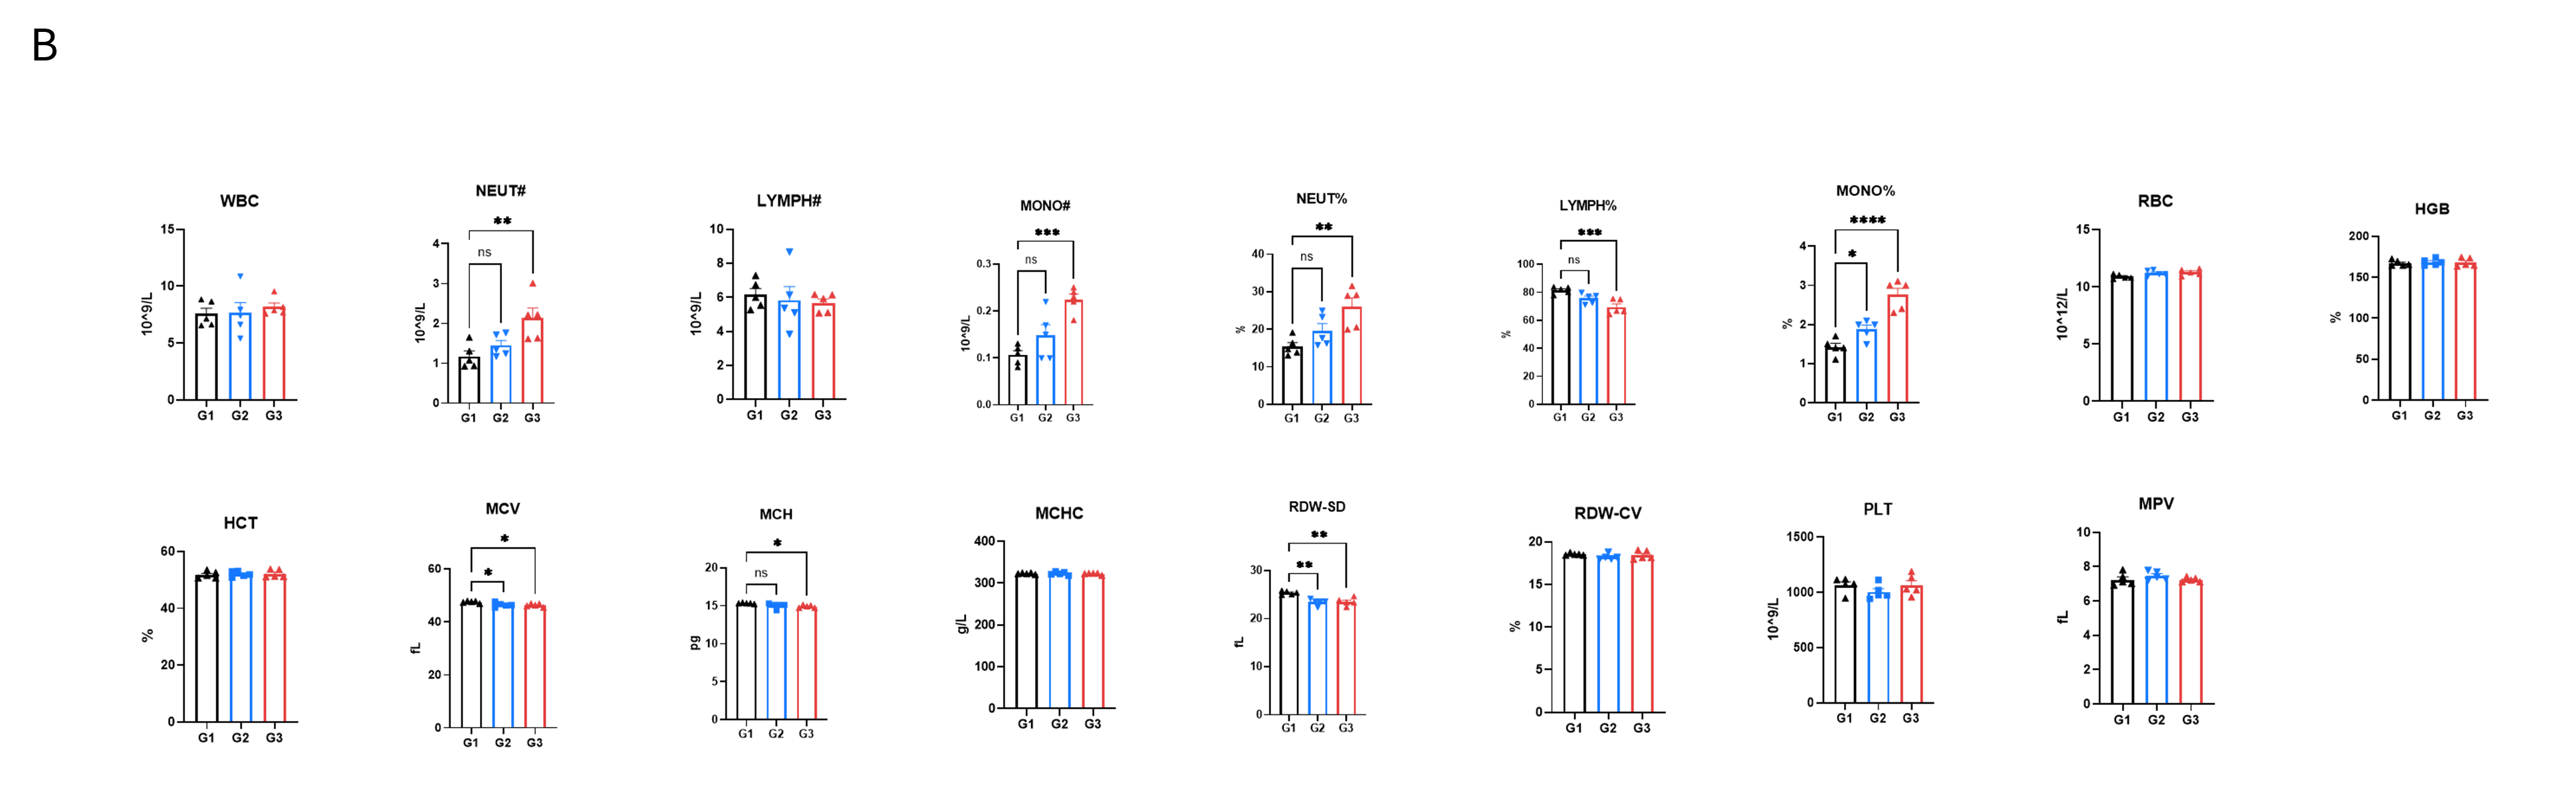
In vivo toxicity evaluation of EGFR-targeted antibody in B-hEGFR mice(C). (B) Complete blood cell count detection at the endpoint of the experiment. Administration of 30 and 50 mg/kg cetuximab resulted in an increase in peripheral blood neutrophils and monocytes. This increase may be induced by immune system activation and mild inflammatory responses following high-dose antibody treatment. The decrease in the volume of individual red blood cells (MCV) may be attributed to the impact of cetuximab on erythropoiesis. Consequently, the body compensated by increasing the red blood cell count (RBC; increased trends, *P<0.05 in unpaired T-test between G1 and G3) to maintain overall hemoglobin (HGB) levels. Values are expressed as mean ± SEM. Significant was analyzed by Ordinary one-way ANOVA (*P≤0.05, **P≤0.01, ***P≤0.001, ****P≤0.0001).
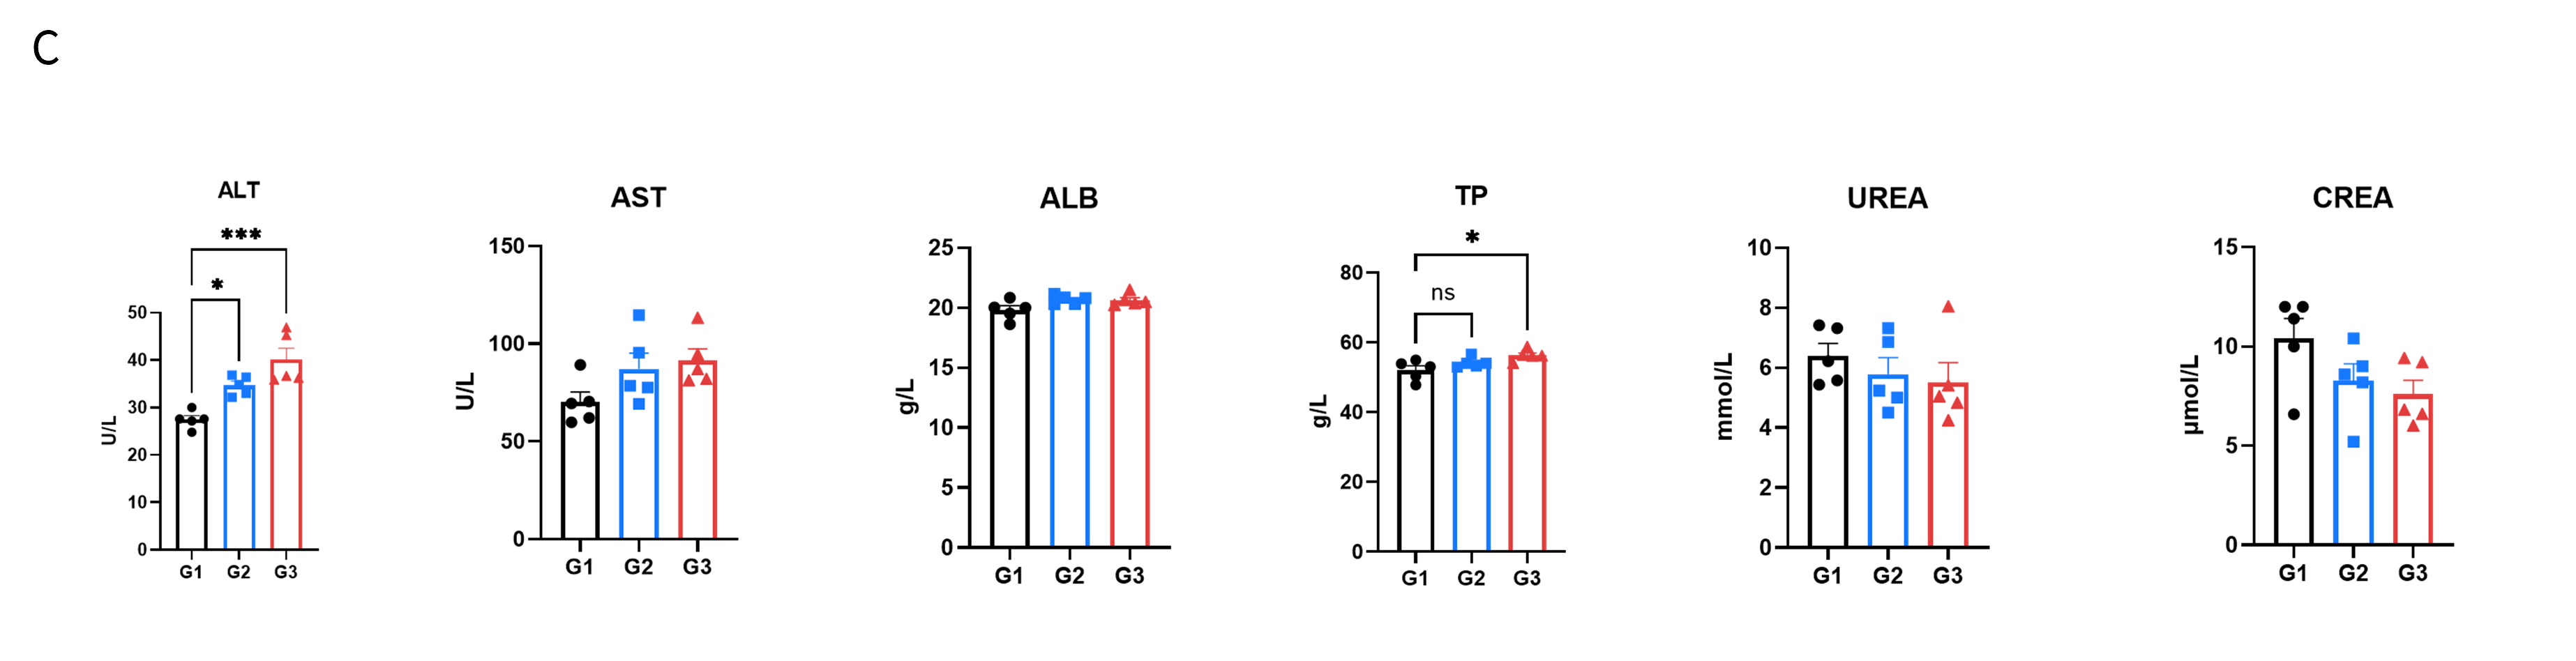
In vivo toxicity evaluation of EGFR-targeted antibody in B-hEGFR mice(C). (C) Biochemical test at the endpoint of the experiment. Elevated ALT and TP levels in peripheral blood indicate liver toxicity following high-dose antibody treatment. Values are expressed as mean ± SEM. Significant was analyzed by Ordinary one-way ANOVA (*P≤0.05, **P≤0.01, ***P≤0.001, ****P≤0.0001).
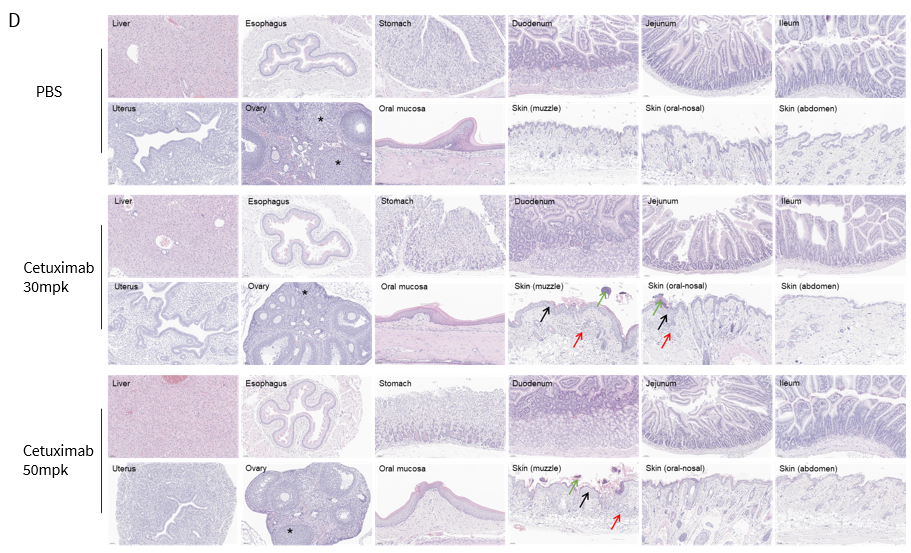
In vivo toxicity evaluation of EGFR-targeted antibody in B-hEGFR mice(C). (D) Pathological alterations in cetuximab-treated mice compared with PBS control. Cetuximab-treated mice showed epidermal hyperplasia with scab formation, and mixed inflammatory cell infiltration in the skin (muzzle), occasional in the skin (oral-nosal). Ovaries displayed a reduced number of corpora lutea. The incidence of pathological changes in the skin (around the eye) and ovaries were increased in the high dose group compared to those in the low dose group. These changes are considered related to cetuximab treatment.
Magnification: 400×;
* When publishing results obtained using this animal model, please acknowledge the source as follows: The animal model [B-hEGFR mice(C)] (Cat# 113865) was purchased from Biocytogen.