on this page
Liver fibrosis is a common consequence of liver injury caused by various chronic liver diseases and can progress to advanced conditions such as cirrhosis and hepatocellular carcinoma. Targeting key molecular pathways involved in fibrosis, such as TGF-β and PDGF, has become a promising approach for therapeutic intervention. Research into these targets aims to halt or reverse fibrosis progression, offering hope for the treatment of liver-related diseases.
Biocytogen has developed CCL4-induced, TAA-induced, and bile duct ligation-induced liver fibrosis mouse models for drug evaluation.
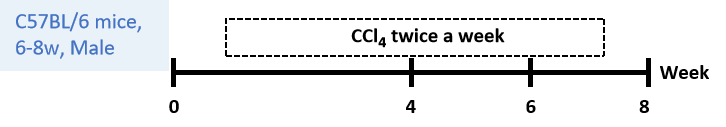
Carbon tetrachloride (CCl4)-induced hepatic fibrosis and cirrhosis in rodents is a well-established and widely accepted experimental model for the study of liver fibrosis and cirrhosis. In many aspects it mirrors the pattern of human disease associated with toxic damage. For example, the α-SMA expression, Stellate cell activation and key matrix components including collagen-1, MMPs and their inhibitors.
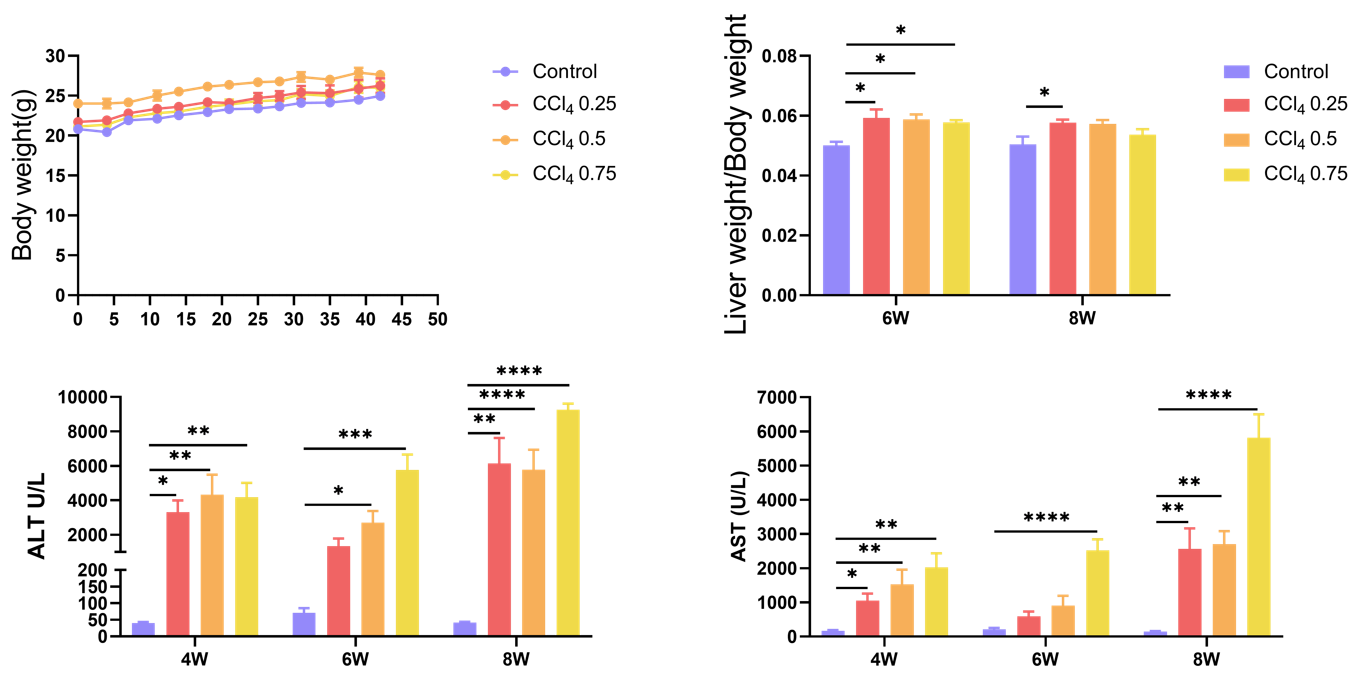
Liver weight, body weight, ALT and AST levels in serum were detected after CCl4 induction. Values are expressed as mean ± SEM. N = 6 mice per group. *p<0.05, **p<0.01, ***p<0.001, ****p<0.0001.
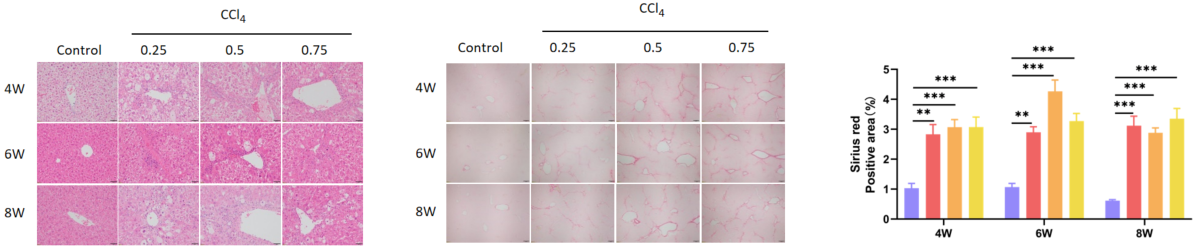
H&E staining showing inflammation infiltration and Sirius red staining showing fibrosis in liver. Values are expressed as mean ± SEM. N = 6 mice per group. **p<0.01, ***p<0.001.
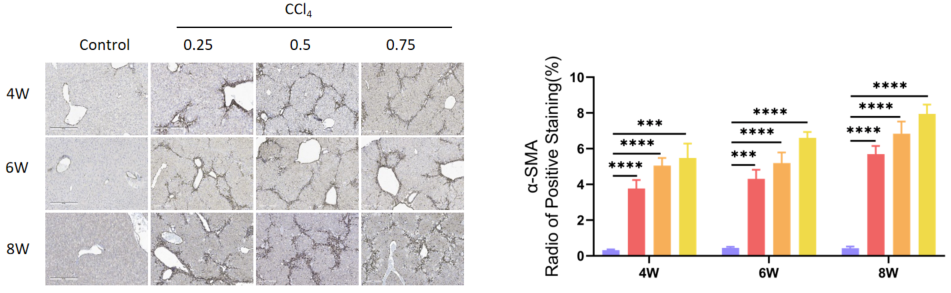
Immunohistochemistry showing fibroblast marker α-SMA in liver. Values are expressed as mean ± SEM. N = 6 mice per group .***p<0.001, ****p<0.0001.
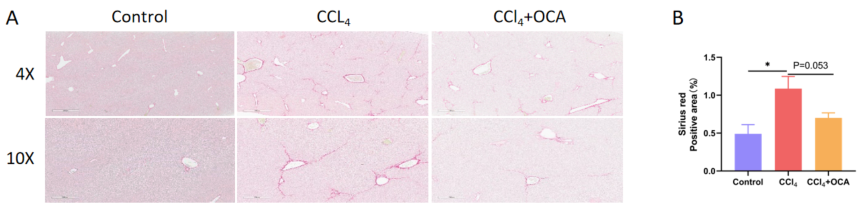
A. Representative pictures of Sirius red staining showing liver fibrosis after 3 weeks of CCl4 induction and OCA treatment. B. Statistic data of Sirius red staining. Values are expressed as mean ± SEM. N = 6 mice per group.*p<0.05.
Thioacetamide (TAA) is a compound widely used to mimic the damage produced in the pathogenesis of liver fibrosis. TAA increases the formation of reactive oxygen species (ROS) through its metabolite thioacetamide sulfur dioxide (TASO2), causing severe oxidative stress as well as lipid peroxidation and the generation of protein carbonyl and DNA adducts. The ROS produced, cause activation of hepatic stellate cells (HSCs), while induces the transdifferentiation of hepatic stellate cells into myofibroblast-like cells, leading to an imbalance of EMC synthesis and degradation and a continuous fibrotic process.
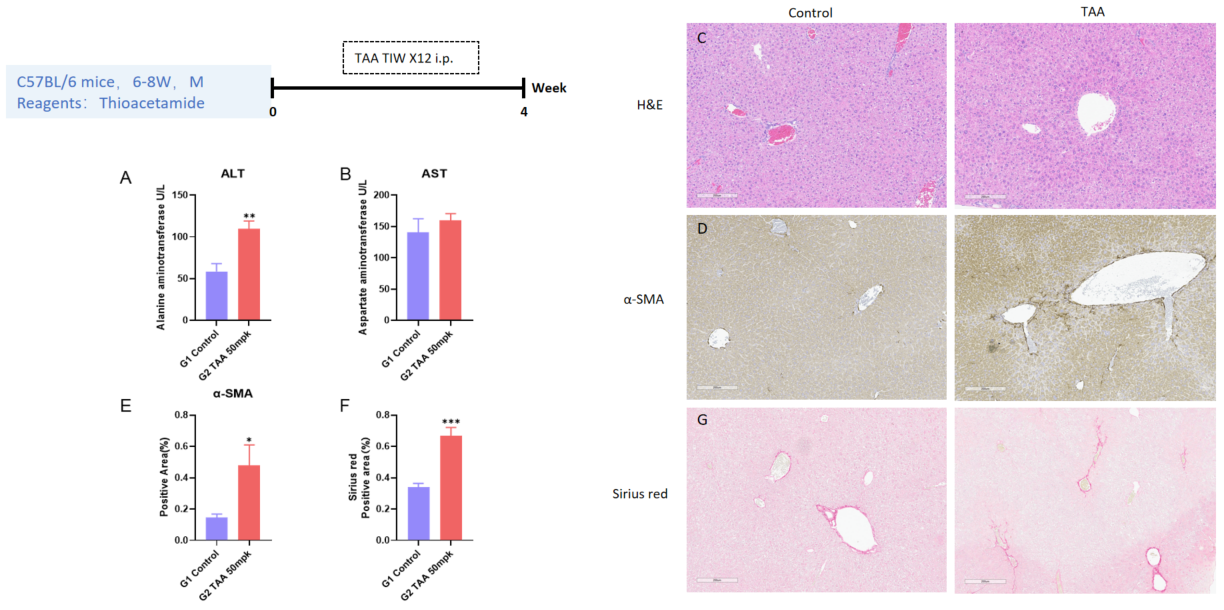
TAA induced liver fibrosis model for 4 weeks. A-B, ALT and AST levels in serum. C, Representative pictures of H&E staining. D-E, Representative images of immunohistochemical staining showing α-SMA and positive area. G-F, Representative pictures of sirius red staining showing increased liver fibrosis and positive area. N = 6 mice per group. *p<0.05, **p<0.01, ***p<0.001.
Bile duct ligation causes extrahepatic biliary obstruction, which leads to bile duct dilatation and bile stasis. When the pressure in the bile duct increases further, the intrahepatic bile ducts dilate and rupture, the intrahepatic blood vessels are compressed by both the dilated bile ducts and the extravasated bile, the hepatocytes become ischaemic and necrotic, and fibrous tissue proliferates, surrounding the liver lobules and spreading around the hepatocytes, which can eventually lead to cirrhosis.
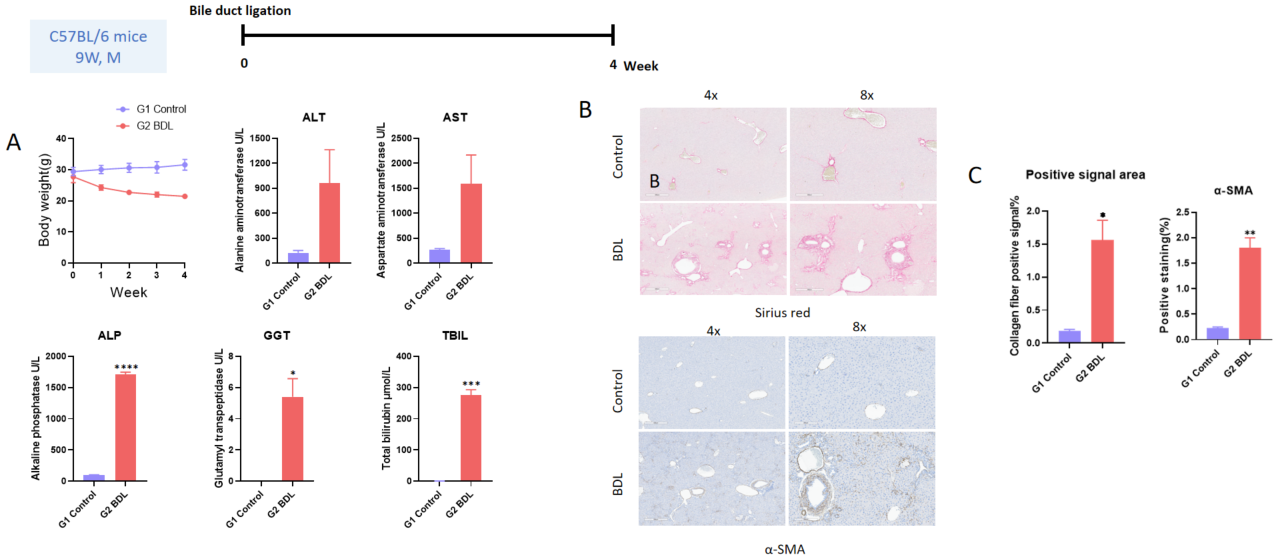
Liver fibrosis model induced by bile duct ligation for 4 weeks. A, ALT ,AST,ALP,GGT and TBIL levels in serum. B, Representative images of sirius red staining and immunohistochemical staining showing increased liver fibrosis and α-SMA positive area. C, Positive signal area of collagen fiber. N = 6 mice per group. *p<0.05, **p<0.01, ***p<0.001.