Description
GIPR: A key regulator of metabolic homeostasis and its therapeutic intervention in obesity and diabetes
- Gene Information: Glucose‐dependent insulinotropic polypeptide receptor (GIPR) is a class B G protein‐coupled receptor (GPCR) that plays a central role in mediating the metabolic actions of its cognate ligand, glucose‐dependent insulinotropic polypeptide (GIP).
- Protein Expression: GIPR exhibits prominent expression in pancreatic β-cells, with detectable expression also observed in the gastrointestinal tract, adipose tissue, and brain.
- Signaling Pathway: GIP signaling alters energy metabolism by regulating central NPY release, disrupting the AKT-mTOR pathway to decrease muscle fat oxidation, and exacerbating postprandial adipose inflammation and ectopic fat deposition.
- Therapeutic Method: GIPR serves as a versatile therapeutic target whose agonists stimulate its natural insulinotropic action for glycemic control, while its antagonists counteract its obesogenic and inflammatory effects to manage obesity.
Targeting strategy
GIPR
- The part of exon 2 to exon 14 of the mouse Gipr gene that encodes the whole molecule (ATG to STOP codon), including 3’UTR, was replaced by human GIPR CDS + human 3’UTR in B-hGIPR mice. The promoter and 5’UTR region of the mouse gene are retained. The human GIPR expression is driven by the endogenous mouse Gipr promoter, while the mouse Gipr gene transcription and translation will be disrupted.
mRNA Expression Analysis
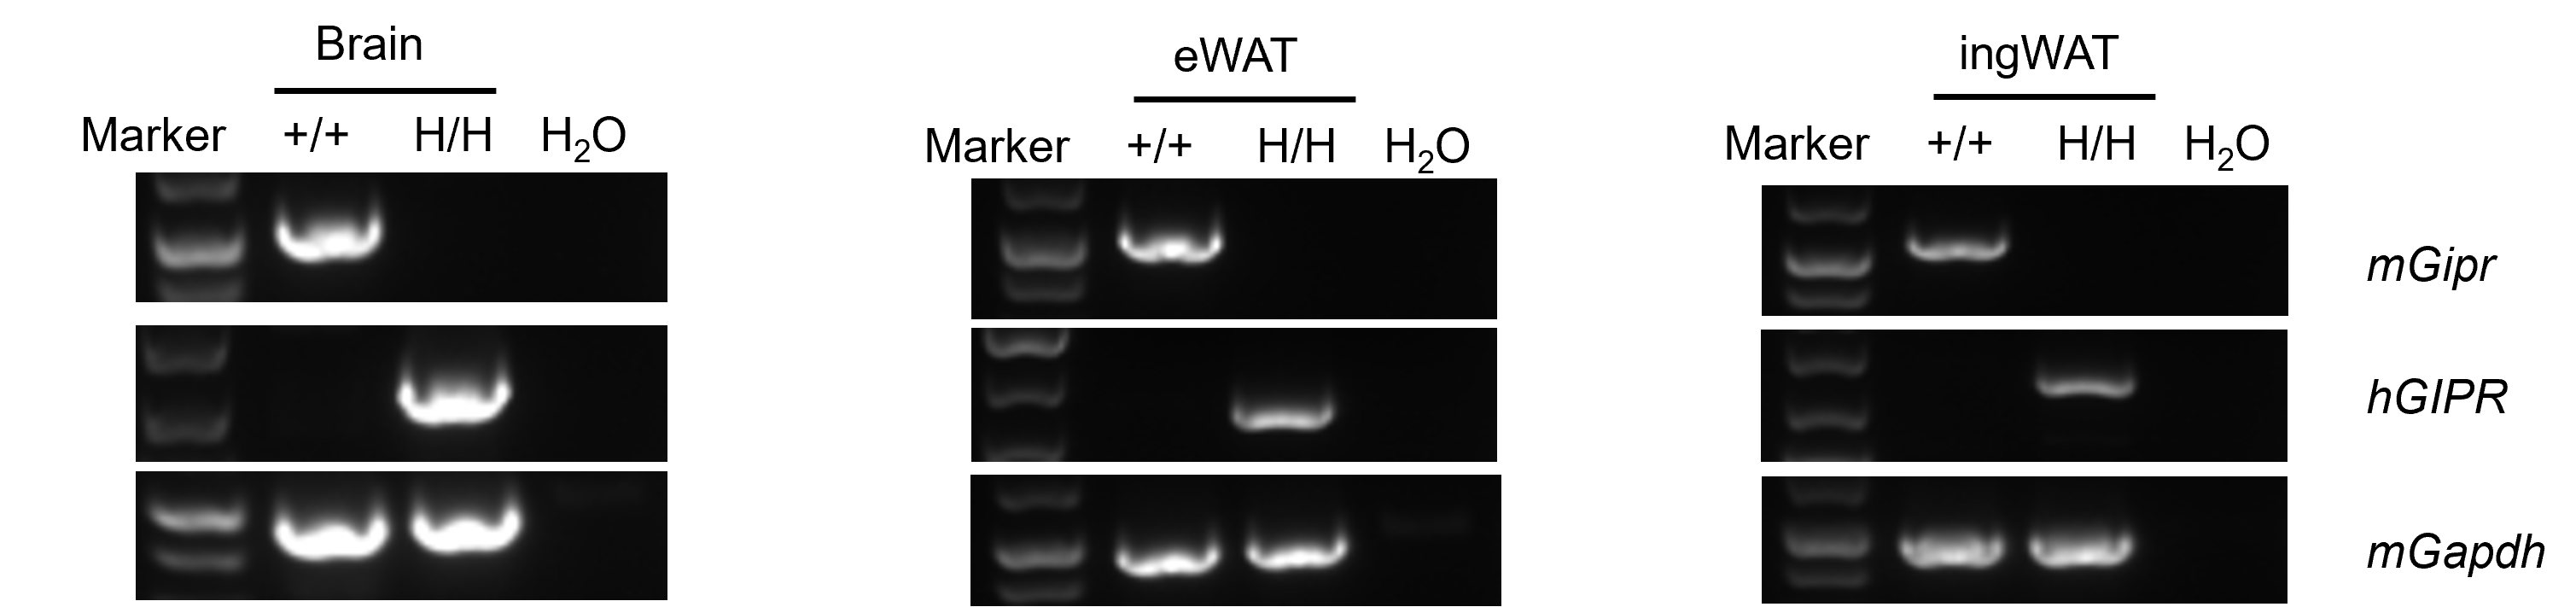
- Mouse Gipr was detected exclusively in wild-type C57BL/6JNifdc mice.
- Human GIPR was detected in homozygous B-hGIPR mice but not in wild-type mice.
Strain specific analysis of GIPR mRNA expression in wild-type C57BL/6JNifdc mice and B-hGIPR mice by RT-PCR. Brain, eWAT, and ingWAT RNA were isolated from wild-type C57BL/6JNifdc mice (+/+) and homozygous B-hGIPR mice (H/H), then cDNA libraries were synthesized by reverse transcription, followed by PCR with mouse or human GIPR primers. Mouse Gipr mRNA was detectable only in wild-type C57BL/6JNifdc mice. Human GIPR mRNA was detectable only in homozygous B-hGIPR mice but not in wild-type mice. eWAT, epididymal white adipose tissue; ingWAT, inguinal white adipose tissue.
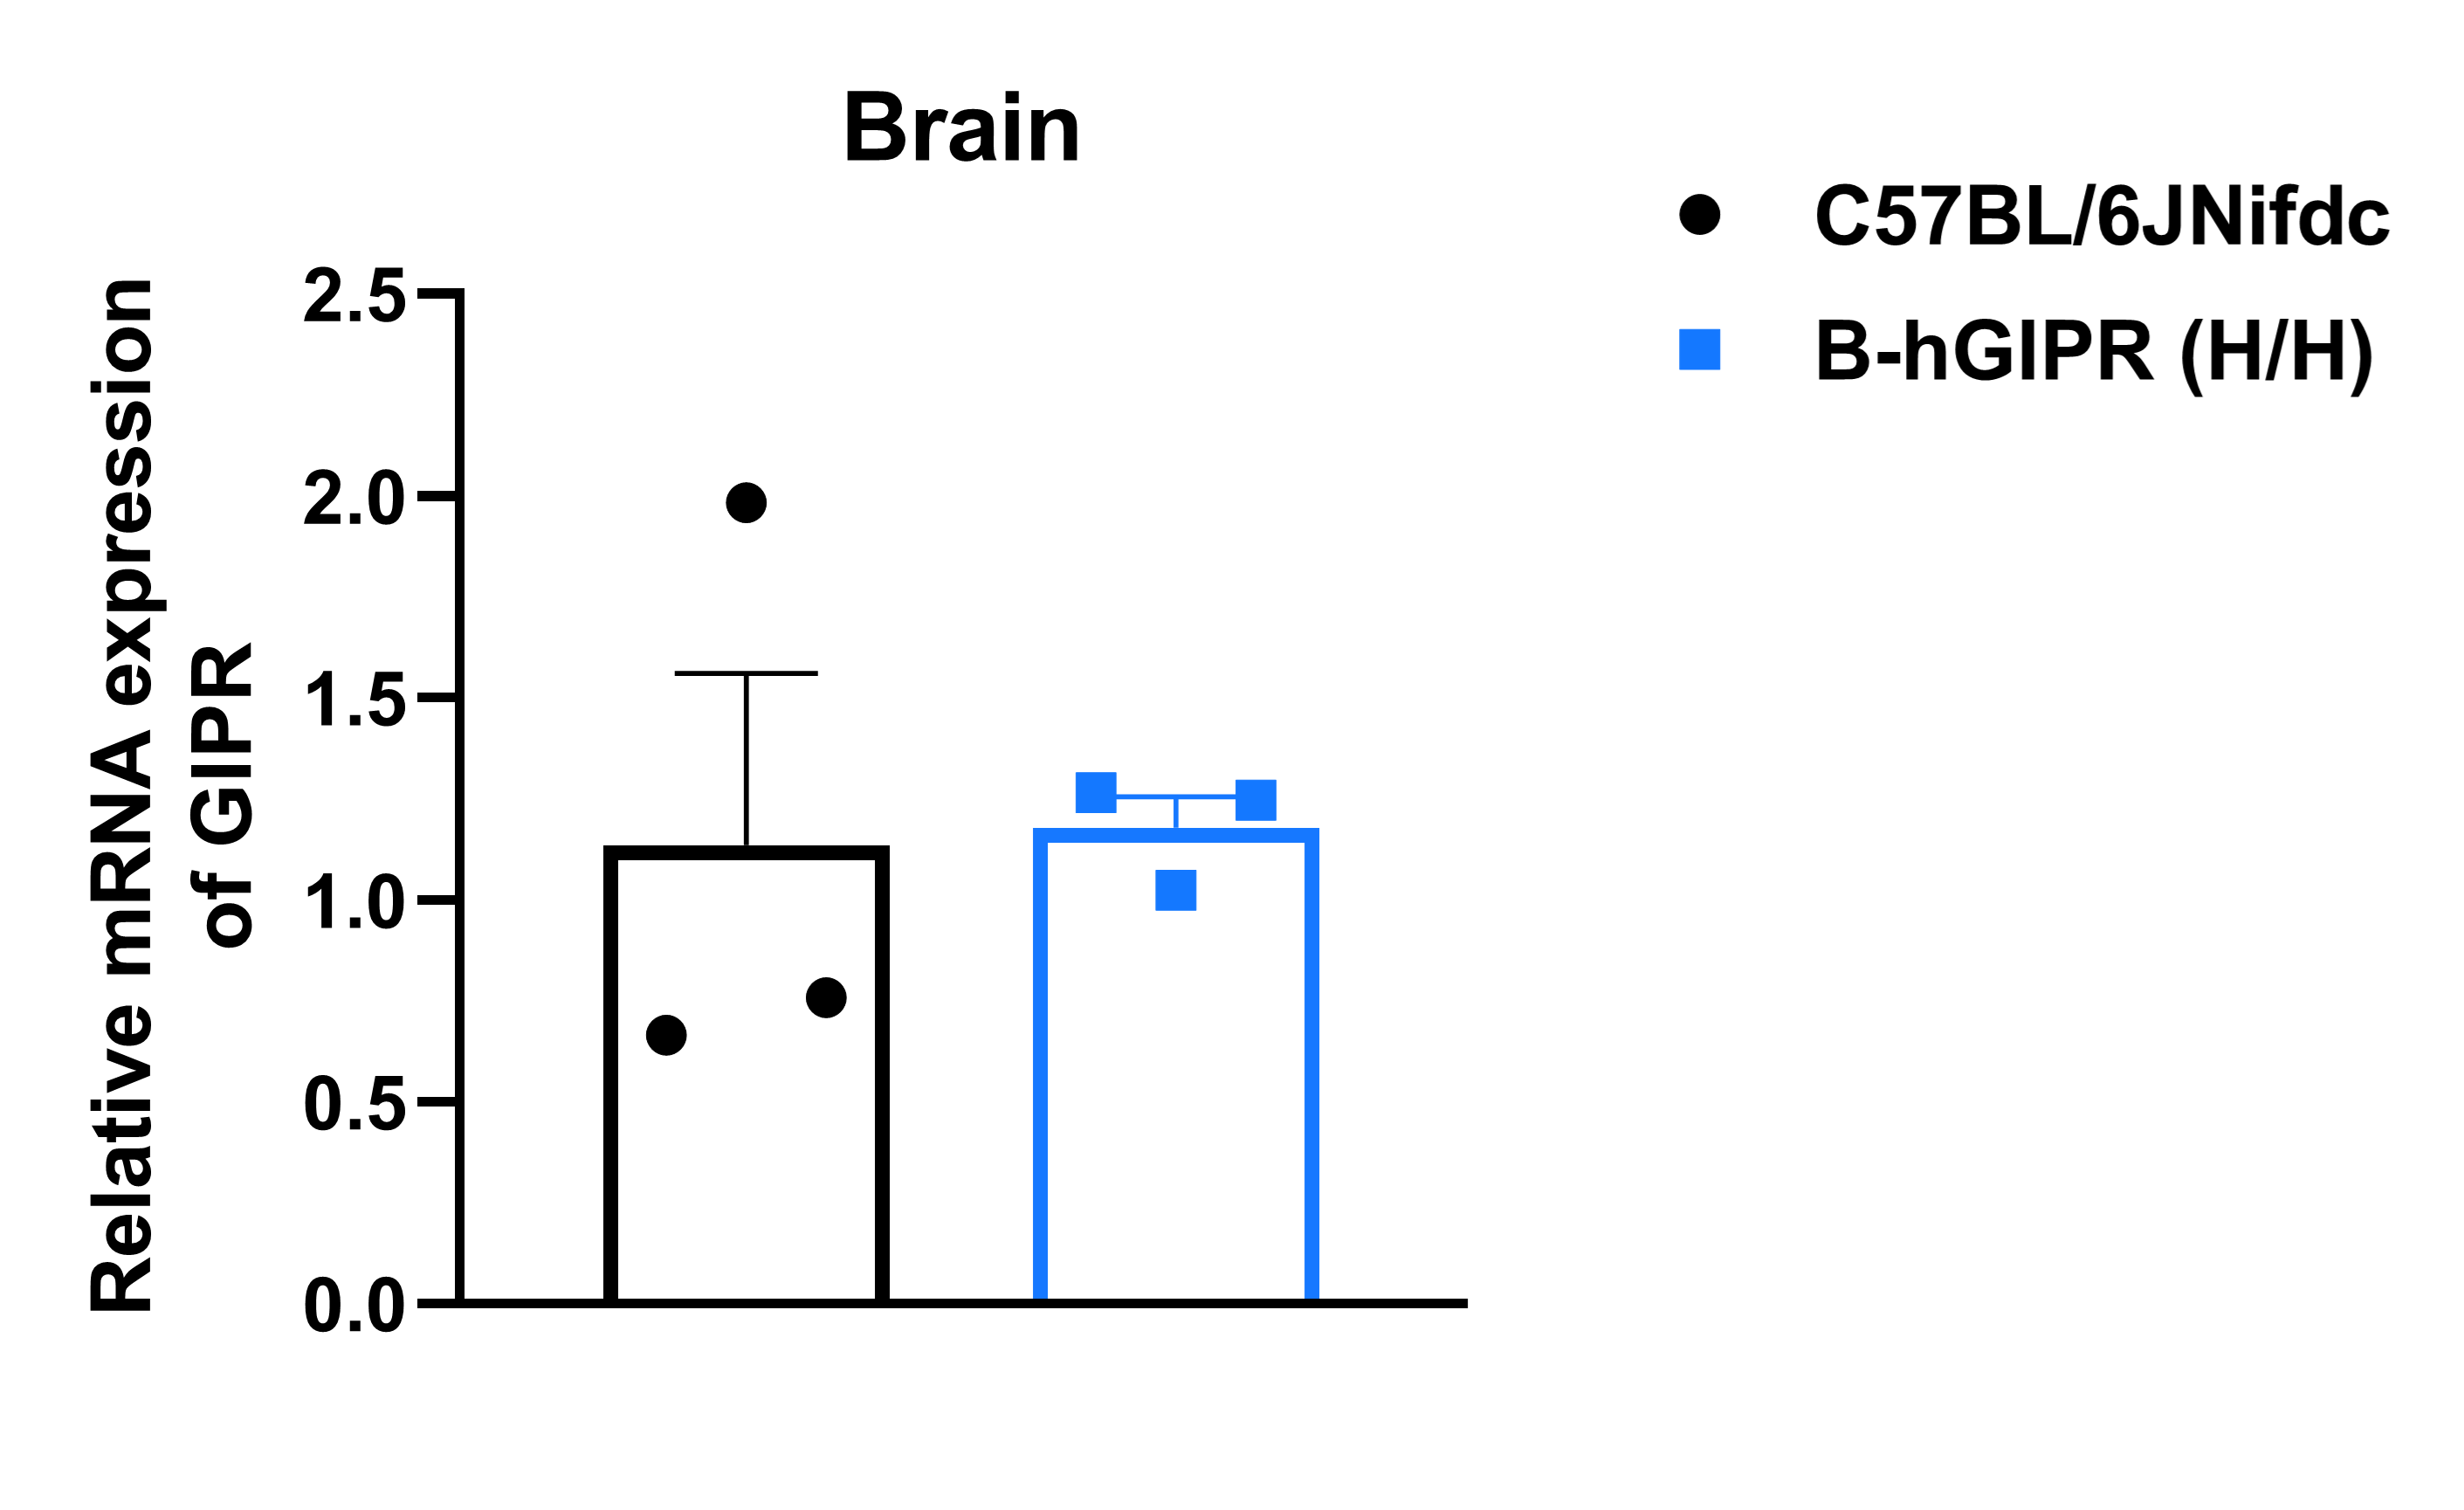
- The mRNA expression level of GIPR was similar in wild-type C57BL/6JNifdc mice and B-hGIPR mice.
Analysis of GIPR mRNA expression in wild-type C57BL/6JNifdc and B-hGIPR mice by RT-qPCR. RNA was isolated from wild-type C57BL/6JNifdc (+/+) and homozygous B-hGIPR mice (H/H), then cDNA libraries were synthesized by reverse transcription, followed by PCR with GIPR primers. Values are expressed as mean ± SEM. (The primer pair was designed in the 5’UTR to amplify both mouse and human GIPR mRNA.)
Functional Validation
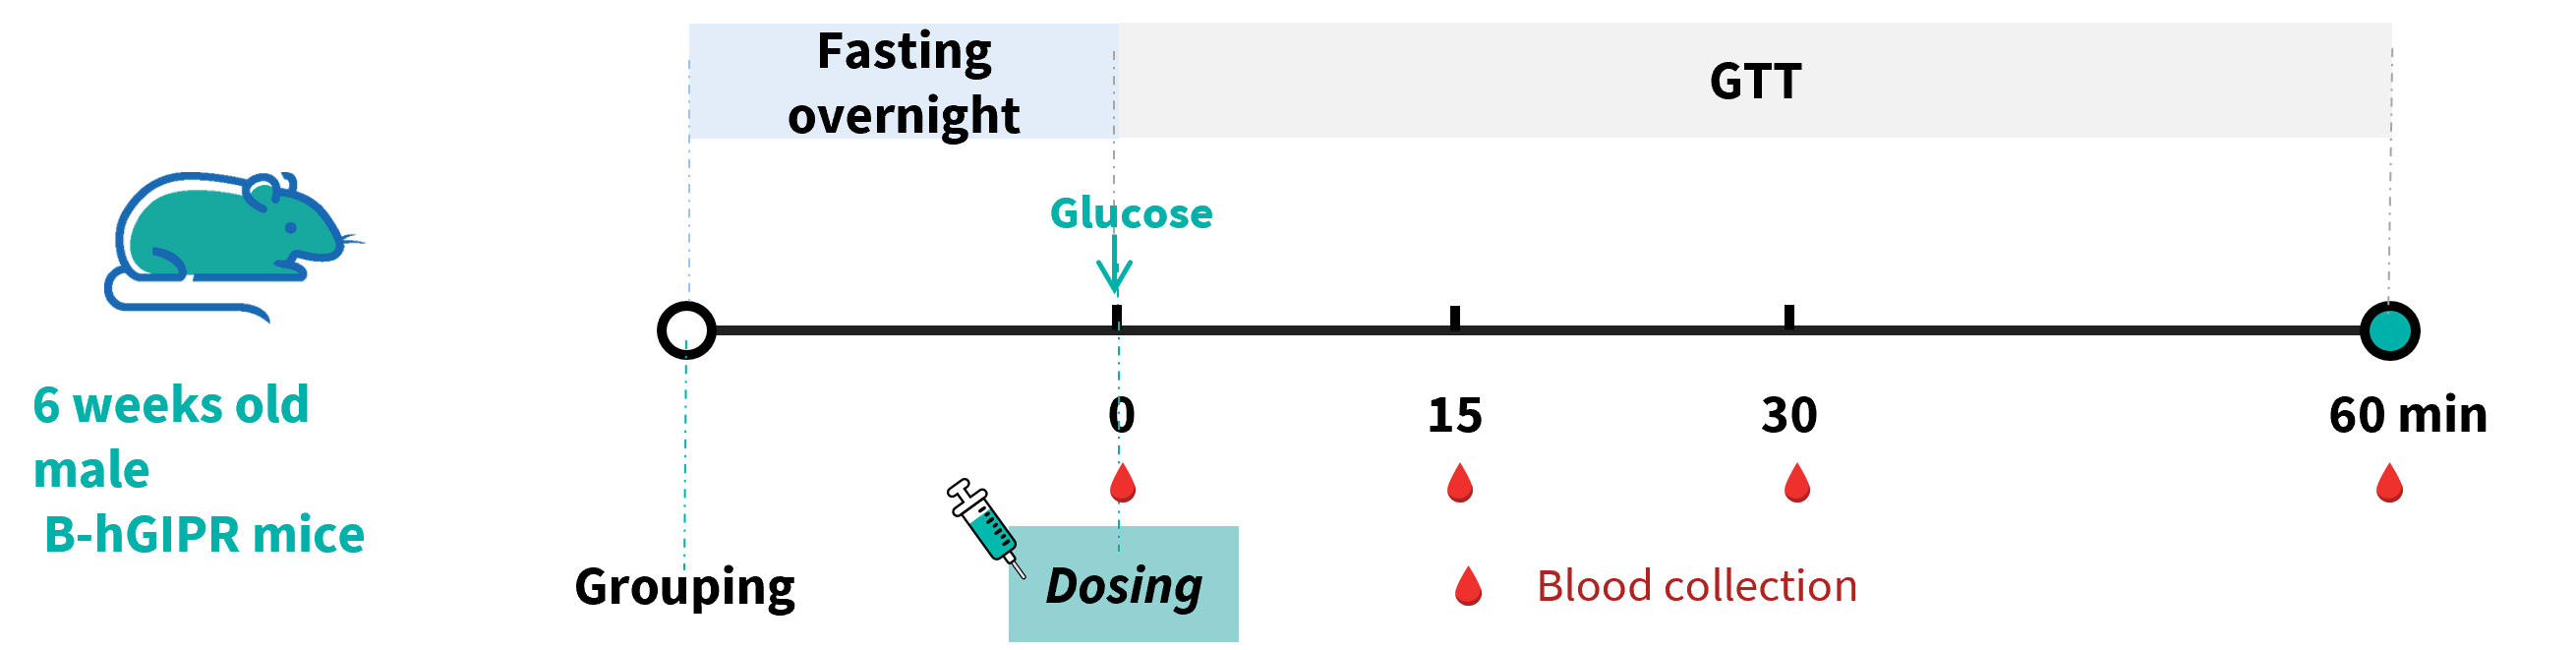
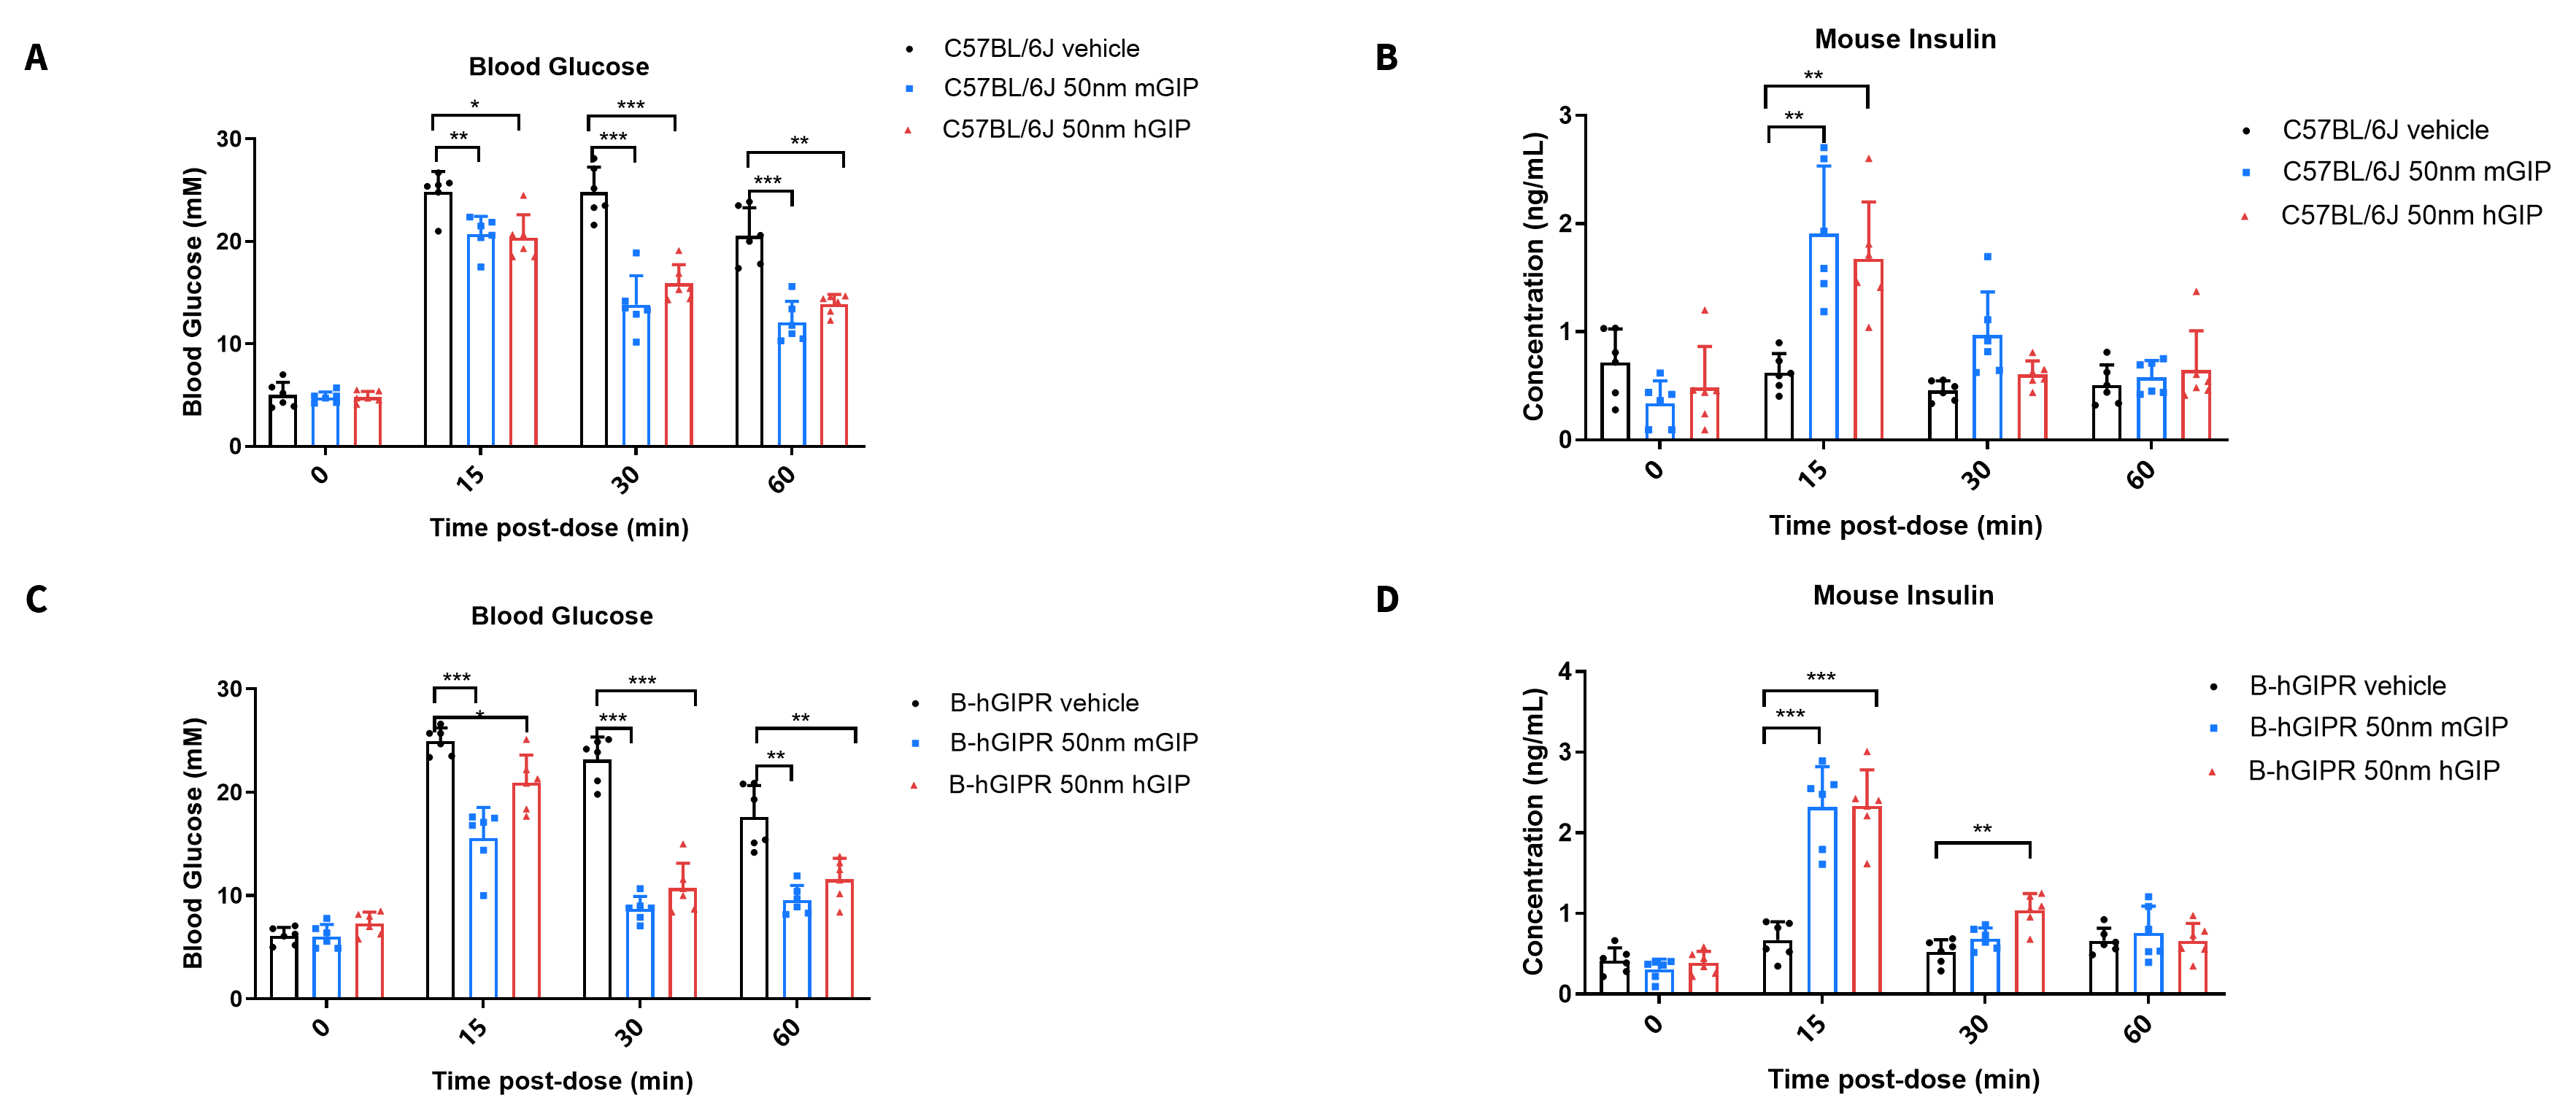
In vivo function of m/hGIP during IPGTT. Wild-type C57BL/6JNifdc mice and B-hGIPR mice (male, 6-week-old, n=6) were treated i.p. with mouse GIP (Cat. HY-P77948, MCE) or human GIP (Cat. HY-P0276, MCE) at 0.25 mg/kg. Then the Intraperitoneal Glucose Tolerance Test (IPGTT) was performed for 2 g/kg D-glucose (40% solution, 5 μL/g).
- In vivo administration of m/hGIP significantly improved glucose tolerance and stimulated insulin secretion in B-hGIPR mice.
In vivo function of m/hGIP during IPGTT. Wild-type C57BL/6JNifdc mice and B-hGIPR mice (male, 6-week-old, n=6) were treated i.p. with mouse GIP (Cat. HY-P77948, MCE) or human GIP (Cat. HY-P0276, MCE) at 0.25 mg/kg. Then the IPGTT was performed for 2 g/kg D-glucose (40% solution, 5 μL/g). (A, C) Plasma glucose during IPGTT. (B, D) Mouse insulin during IPGTT. Data represent means ± SEM. Analyzed by 2way-ANOVA,*P<0.05, **P<0.01, ***P<0.001.
In vivo efficacy in HFD induced B-hGIPR mice
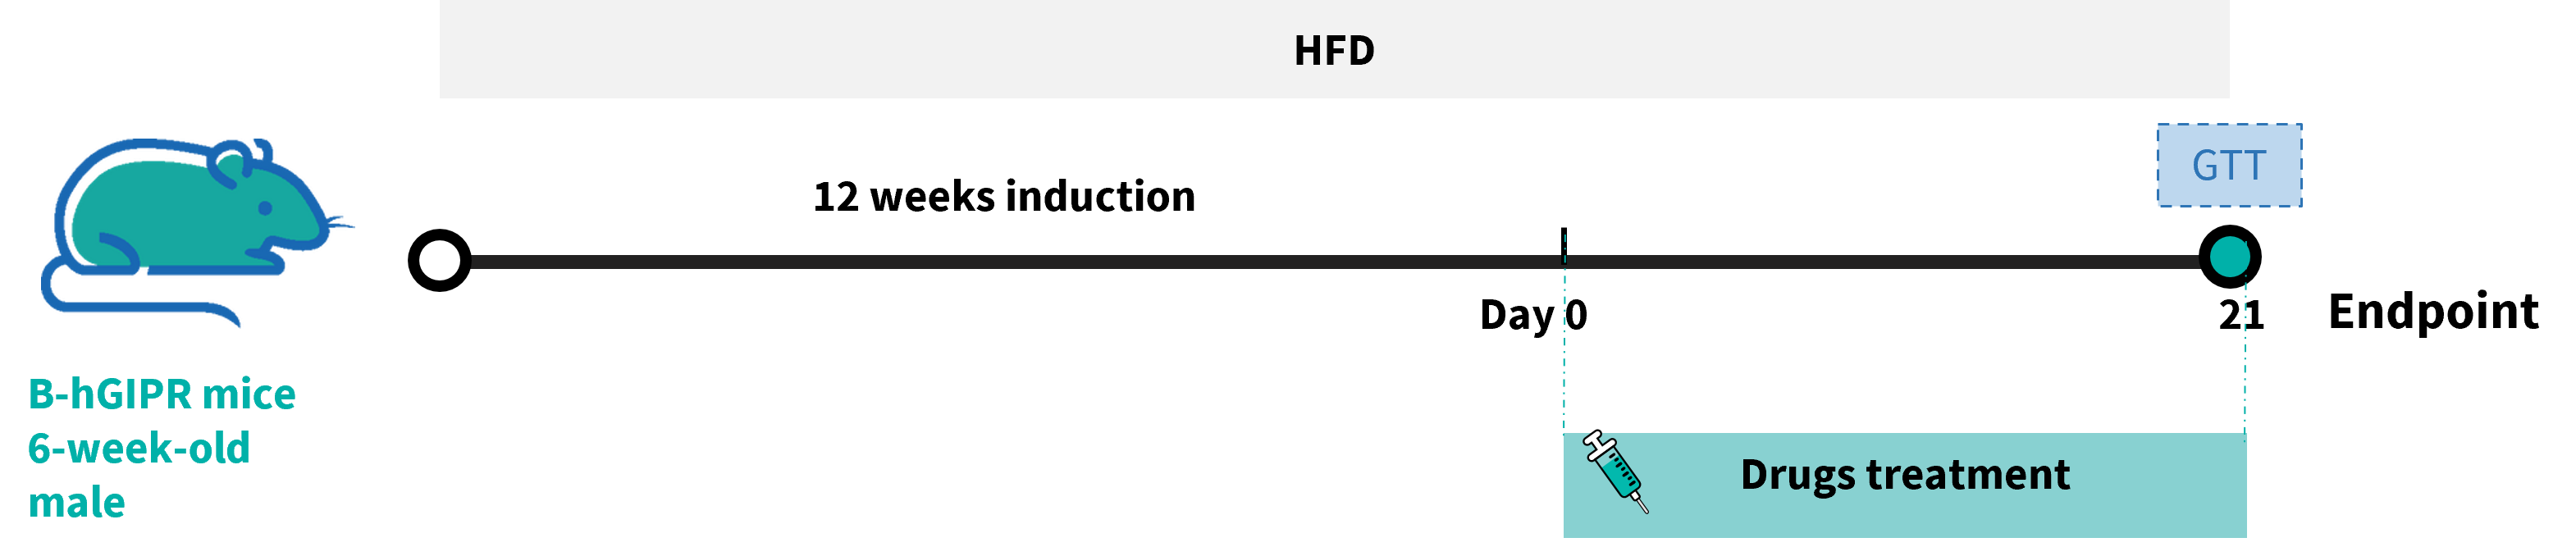
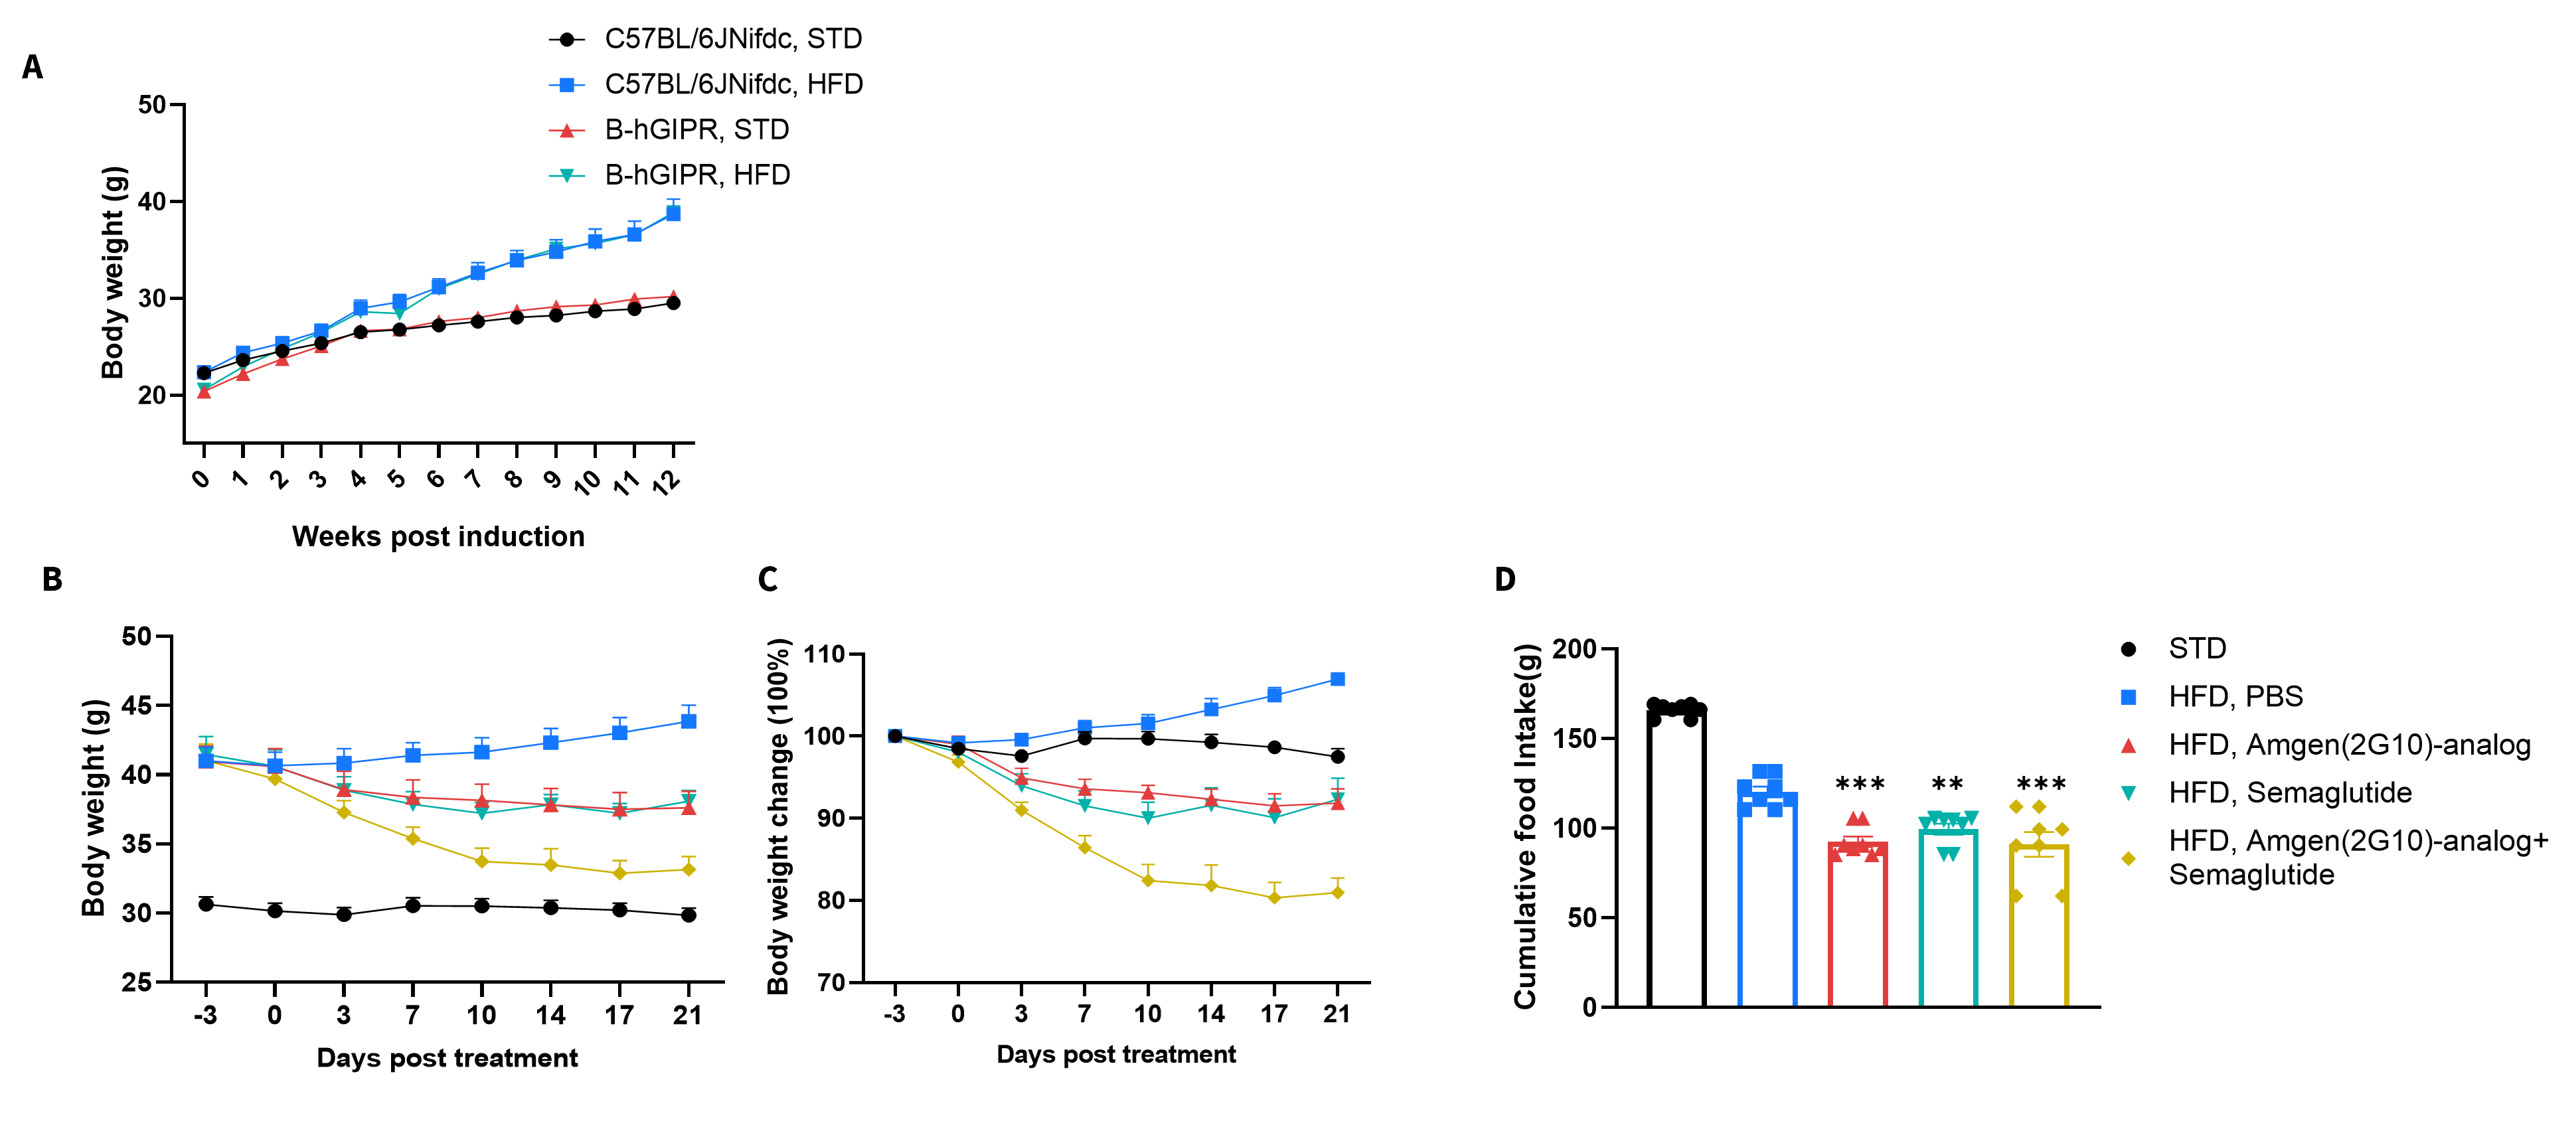
Efficacy study in HFD induced B-hGIPR mice. B-hGIPR mice were fed with a high-fat diet (HFD) for 12 weeks to induce obesity in the mice.
- GIPR-antibody and Semaglutide can reduce body weight and food intake in HFD B-hGIPR mice.
Efficacy study in HFD induced B-hGIPR mice. B-hGIPR mice were fed with a high-fat diet for 12 weeks to induce mice obesity. (A) Body weight change after HFD induction. (B-C) Body weight change after hGIPR-antibody Amgen (2G10) analog (in house), Semaglutide, and combination treatment. (D) Effect of hGIPR-antibody Amgen (2G10), Semaglutide, and combination treatment on food intake on Day 21. Values are expressed as mean ± SEM. Significance was determined by the Ordinary one-way ANOVA compared with HFD PBS group. *p<0.05, **p<0.01,***p<0.001.
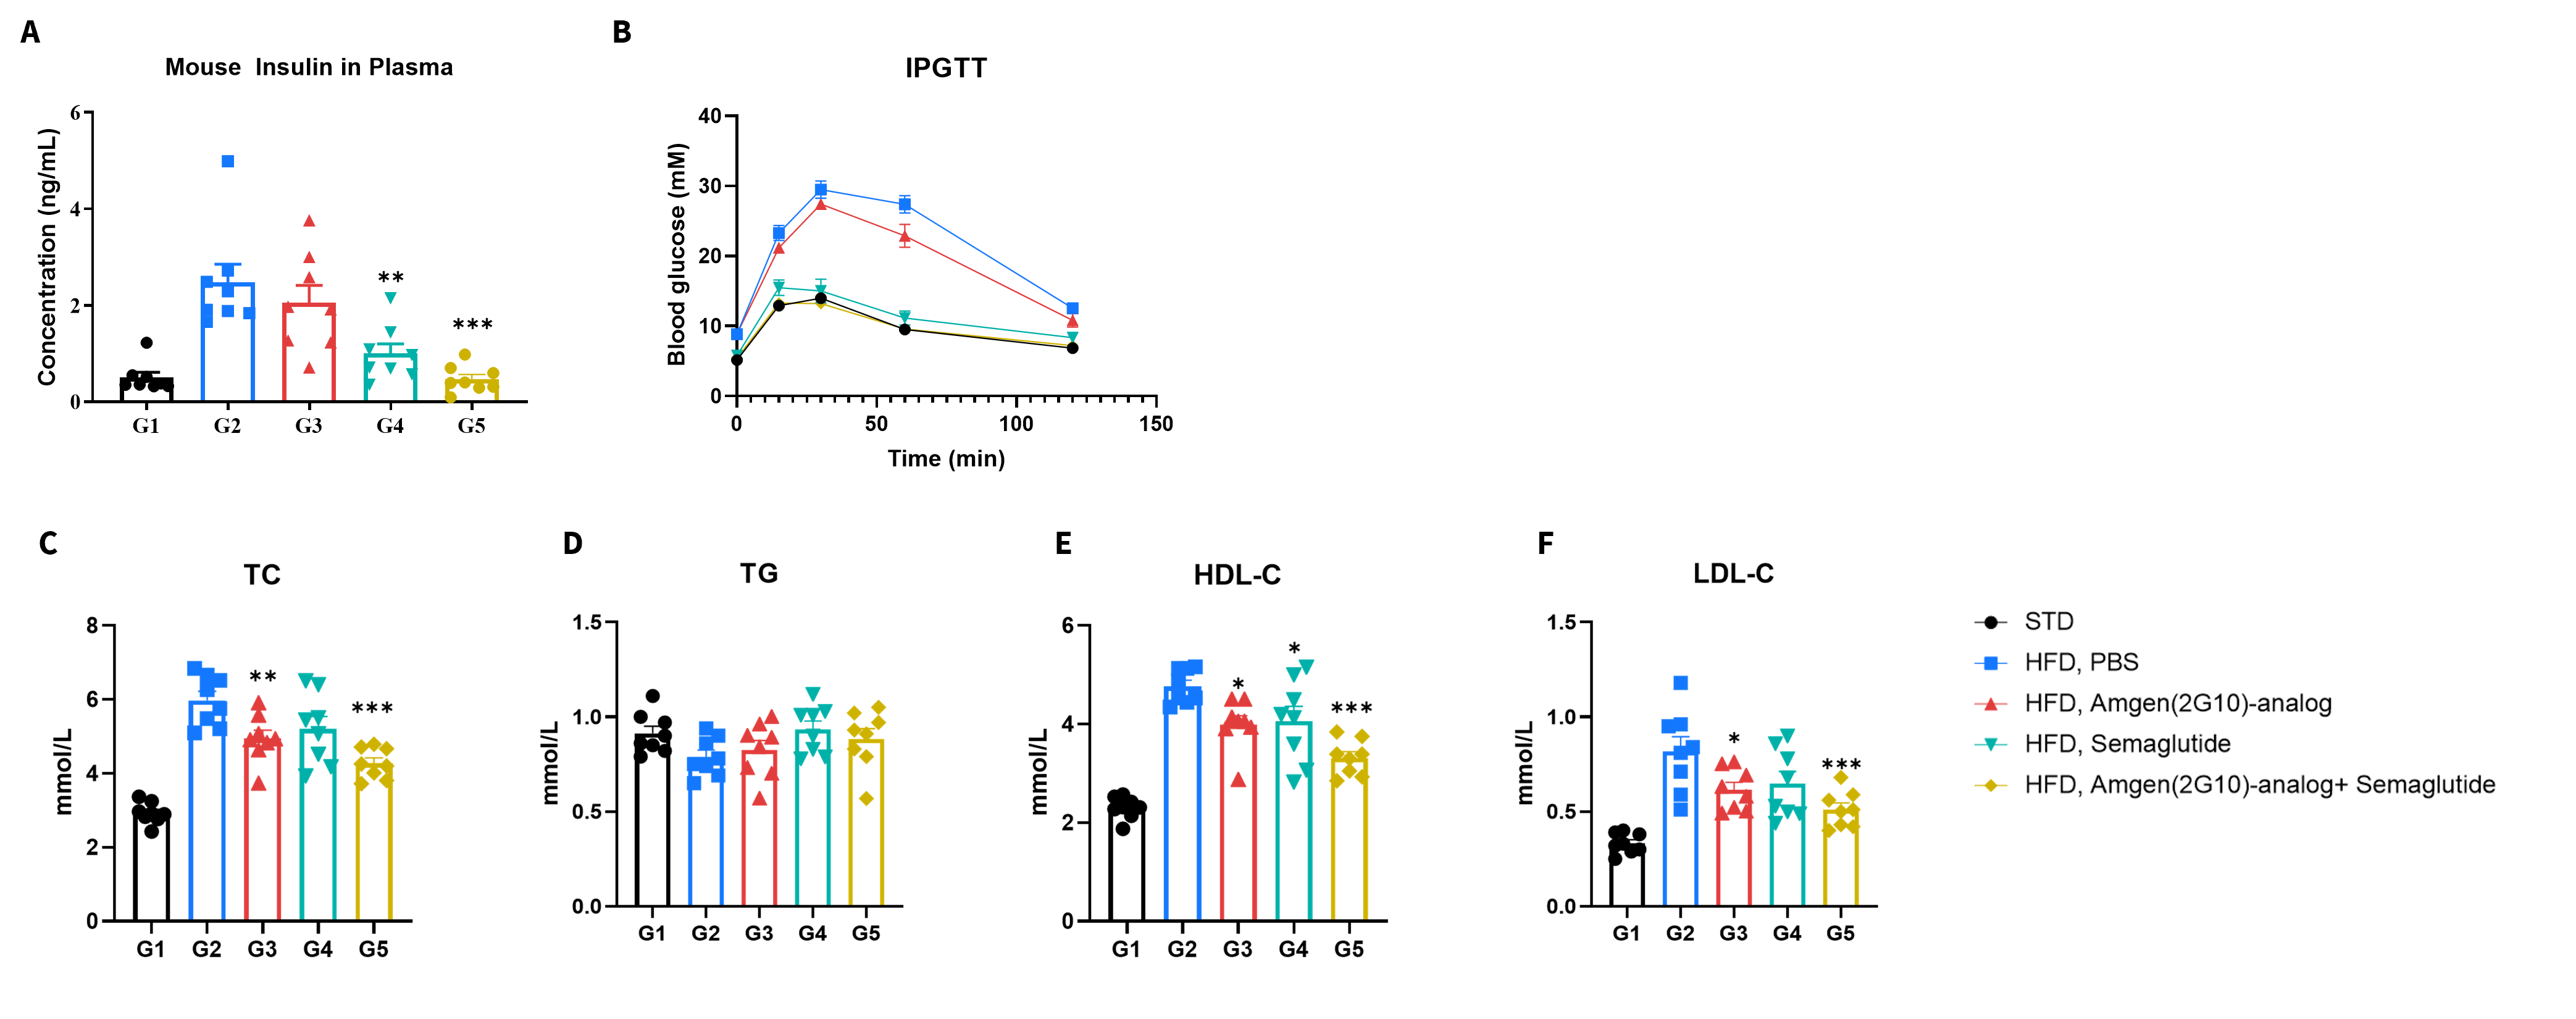
- Semaglutide improved glucose tolerance and helped combat insulin resistance in HFD B-hGIPR mice.
- GIPR-antibody reduced the LDL-C in HFD B-hGIPR mice.
Efficacy study in HFD induced B-hGIPR mice. (A) Fasting insulin after treatment in plasma after 6 hours of fasting. (B) After fasting for 6 hours, mice were intraperitoneally injected with 1.5 g/kg D-glucose (15% solution, 10 μL/g) for Glucose Tolerance Tests after treatment. (C-F) Blood biochemical analysis after treatment. Values are expressed as mean ± SEM. The Ordinary one-way ANOVA determined significance compared with the HFD PBS group. *p<0.05, **p<0.01,***p<0.001.
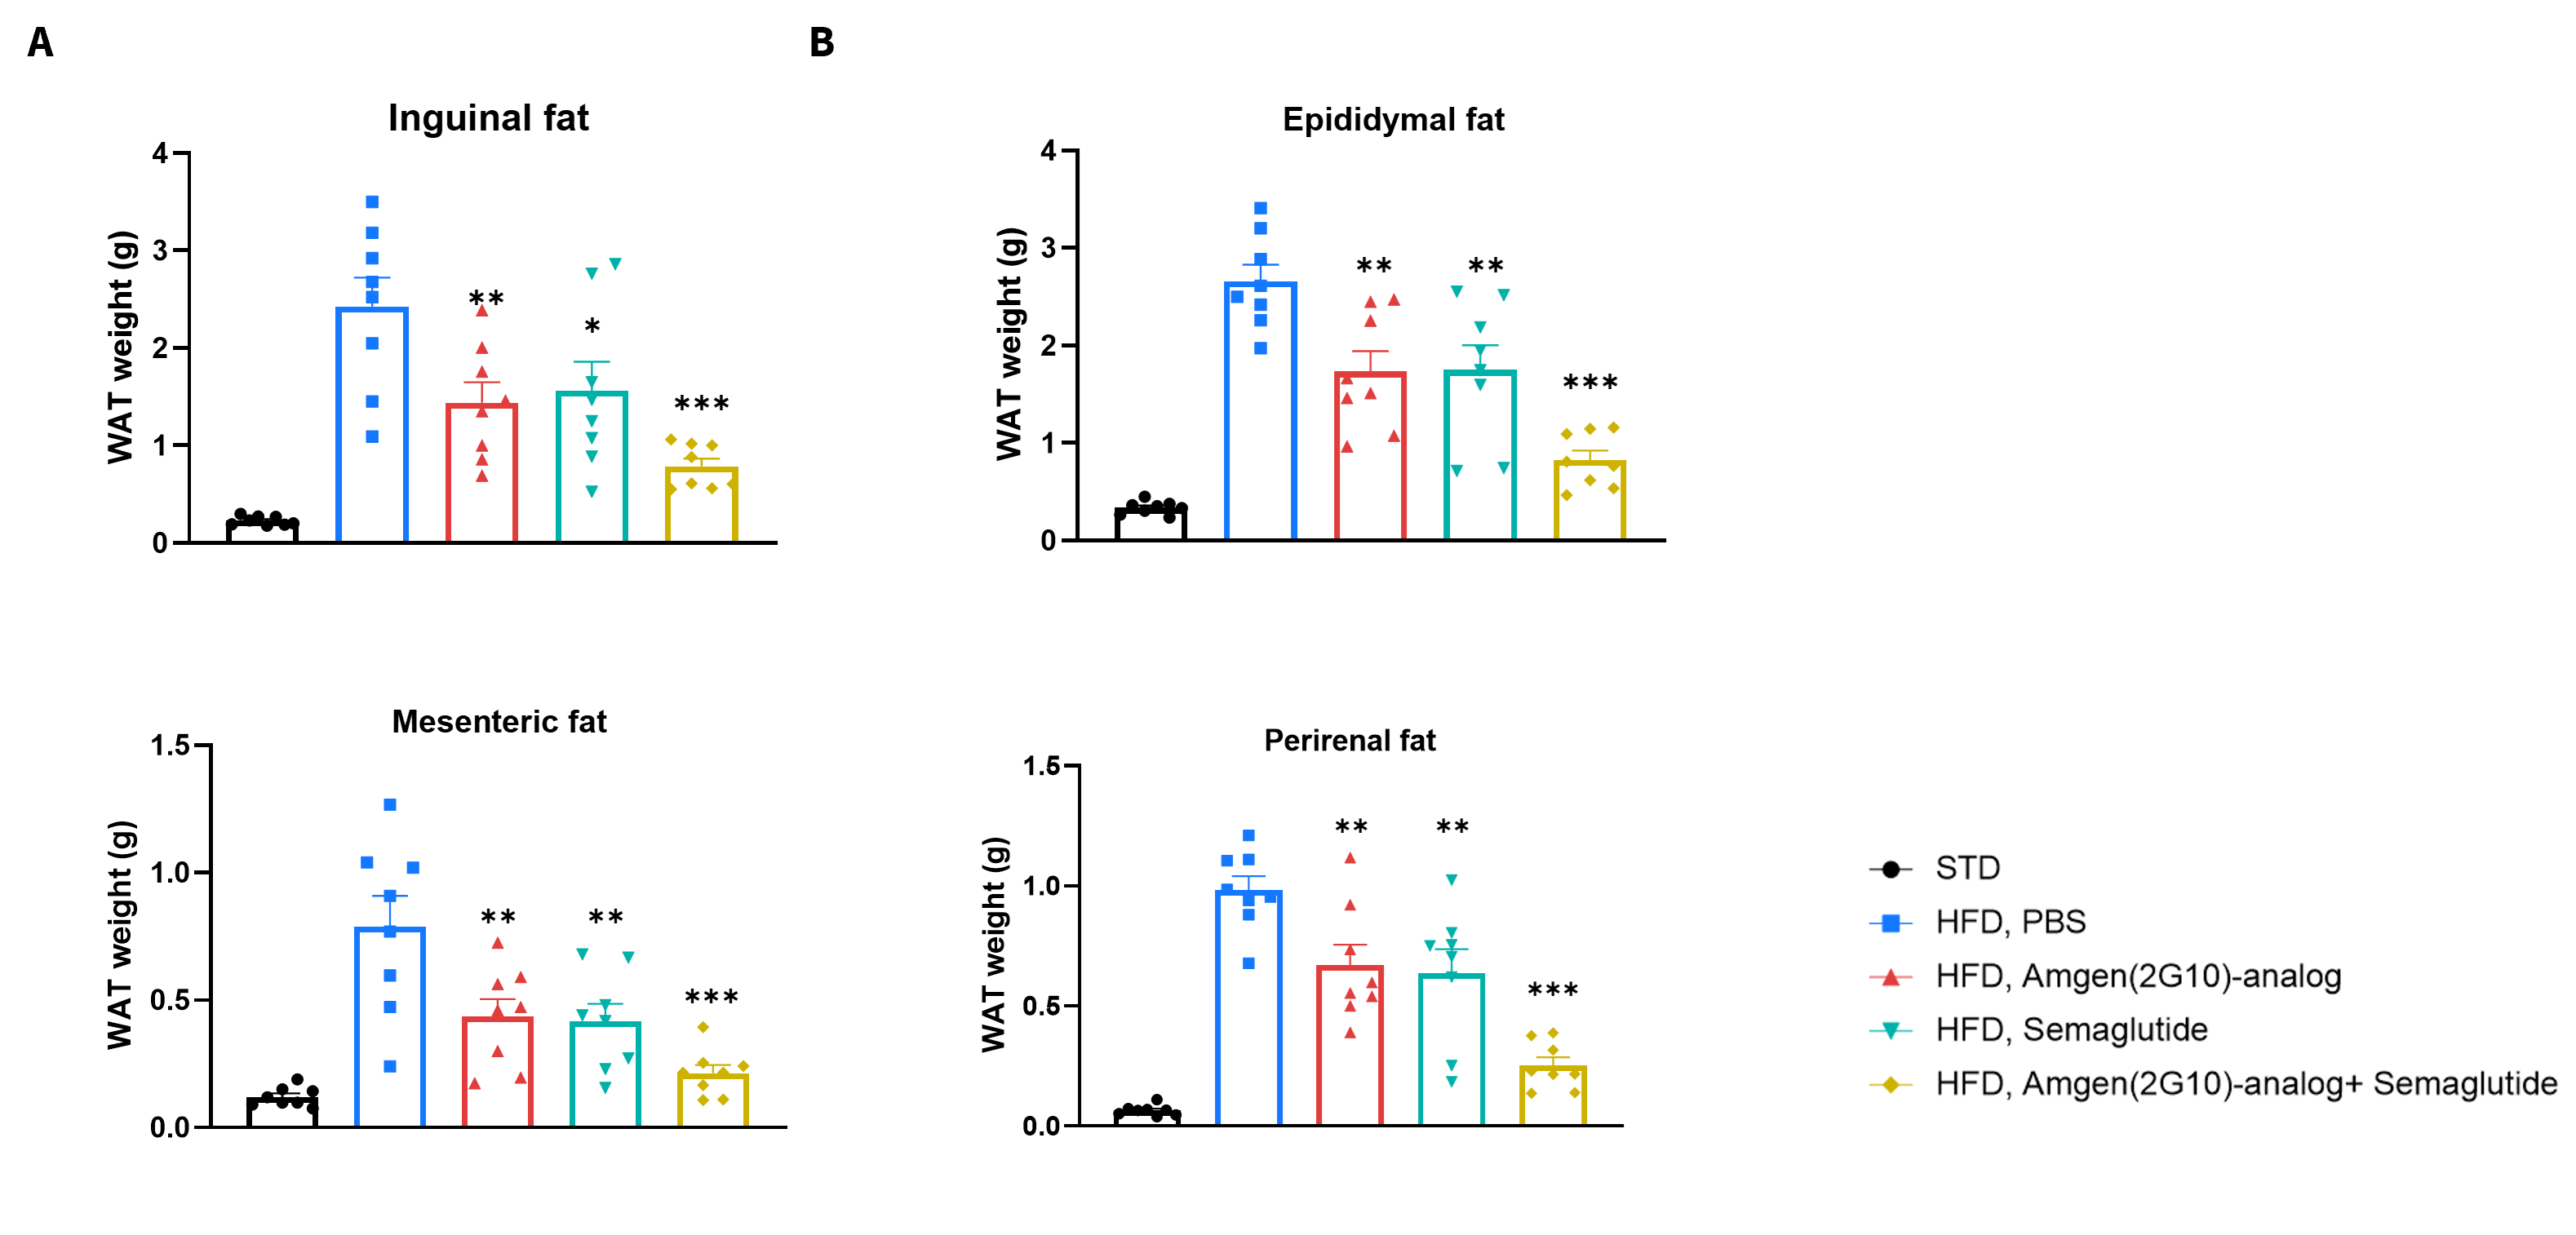
- GIPR-antibody and Semaglutide can reduce white adipose tissue in HFD B-hGIPR mice.
Efficacy study in HFD induced B-hGIPR mice. (A-D) Weight of white adipose tissue at the end of the treatment. Values are expressed as mean ± SEM. Significance was determined by the Ordinary one-way ANOVA compared with HFD PBS group. *p<0.05, **p<0.01,***p<0.001 .
In vivo function of hGIP and GIPR-antibody in HFD induced B-hGIPR mice
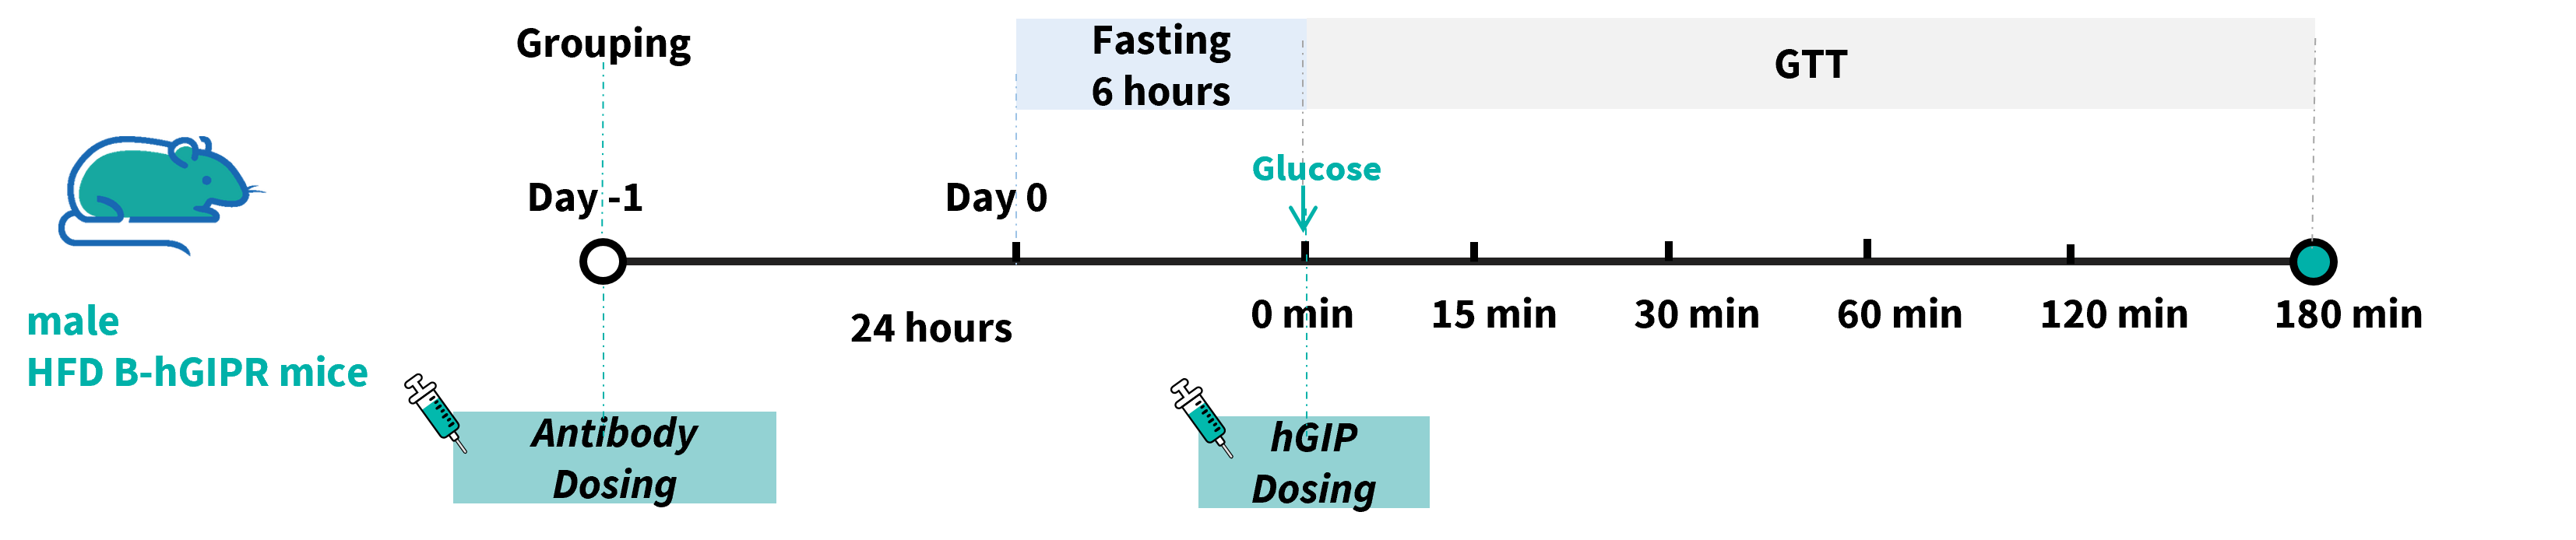
In vivo function of hGIP and GIPR-antibody in HFD induced B-hGIPR mice. B-hGIPR mice were fed with a high-fat diet for 12 weeks to induce obesity in the mice and were randomized into groups and received vehicle or GIPR antibody Amgen (2G10) analog (in house). Approximately 24 hours later, saline or 0.25 mg/kg human GIP (Cat. HY-P0276, MCE) was given via i.p. injection, then immediately followed by an IPGTT at 1.5 g/kg (30% solution, 5 μL/g).
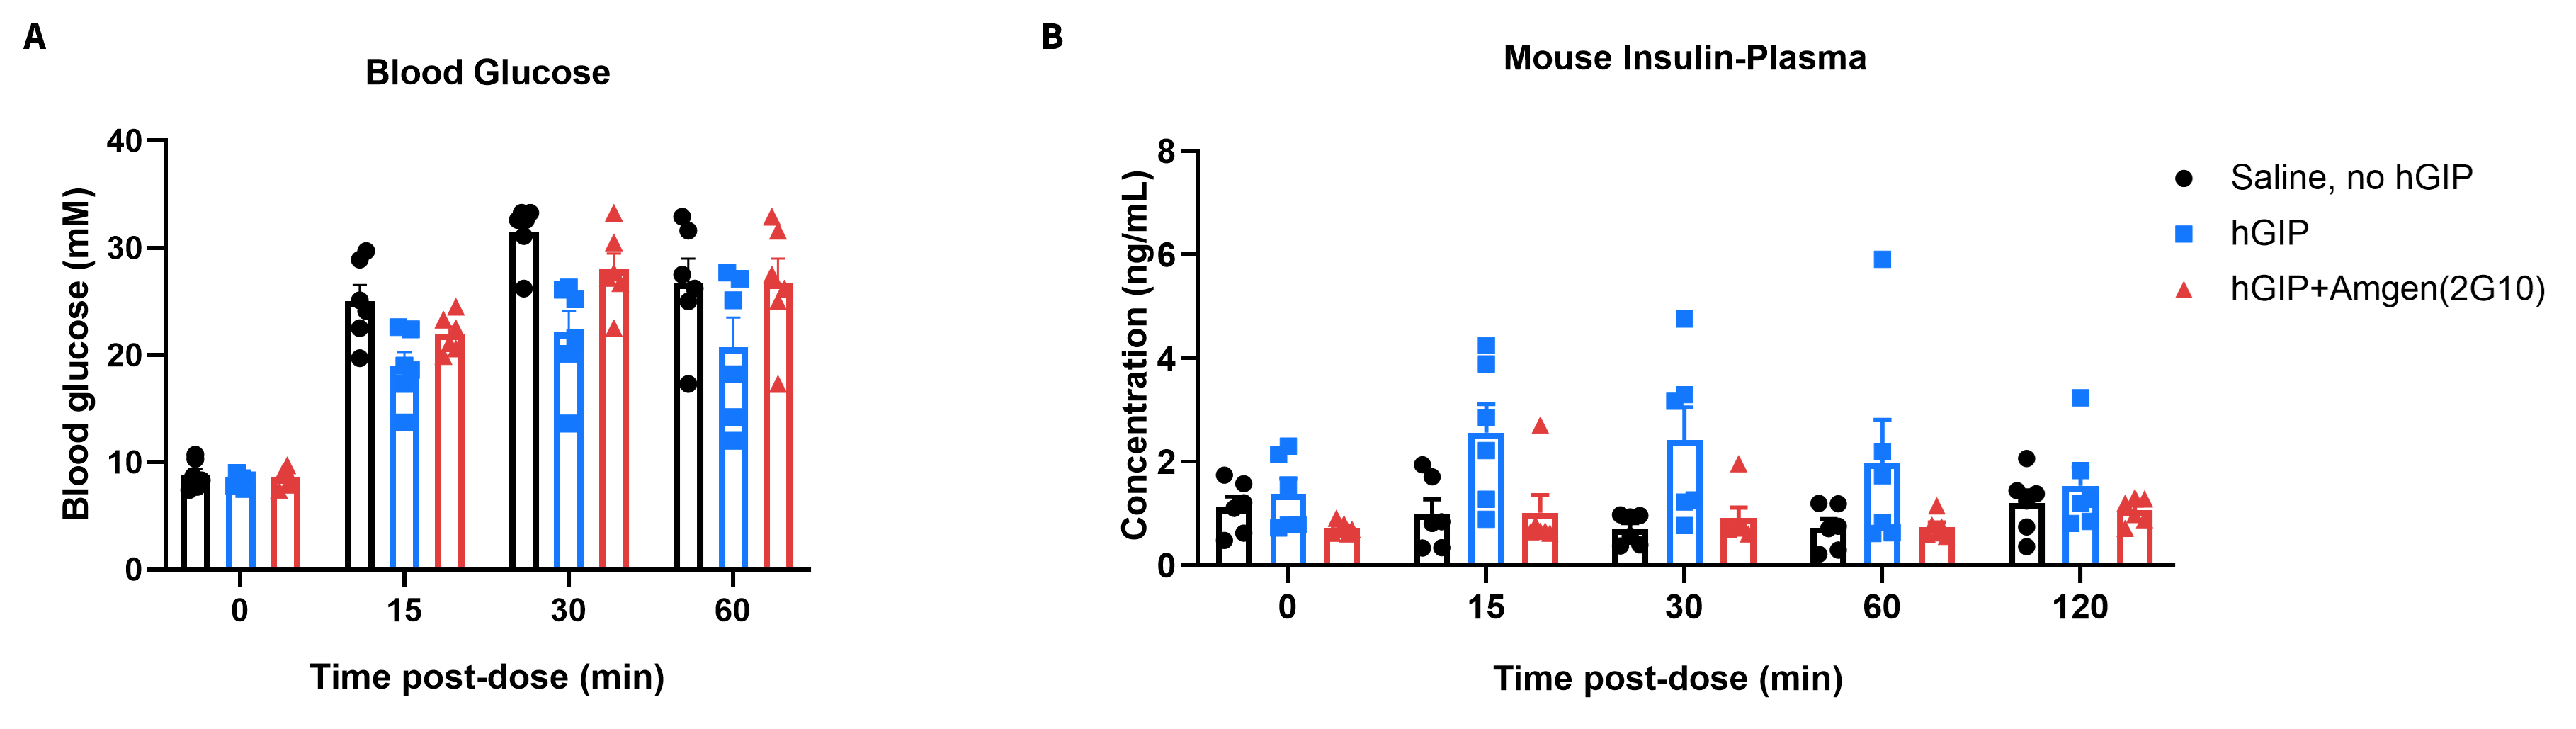
- The insulin secretion effects of hGIP were blocked by a GIPR antibody.
In vivo function of hGIP and GIPR-antibody in HFD induced B-hGIPR mice. B-hGIPR mice were fed with a high-fat diet for 12 weeks to induce obesity in the mice and were randomized into groups and received vehicle or GIPR antibody Amgen (2G10) analog (in house). Approximately 24 hours later, saline or 0.25 mg/kg human GIP (Cat. HY-P0276, MCE) was given via i.p. injection, then immediately followed by an IPGTT at 1.5 g/kg (30% solution, 5 μL/g). (A) Blood glucose and (B) plasma insulin were measured during IPGTT. Data represent means ± SEM.
* When publishing results obtained using this animal model, please acknowledge the source as follows: The animal model [B-hGIPR mice] (Cat# 112714) was purchased from Biocytogen.