GLP1R Protein Expression Analysis
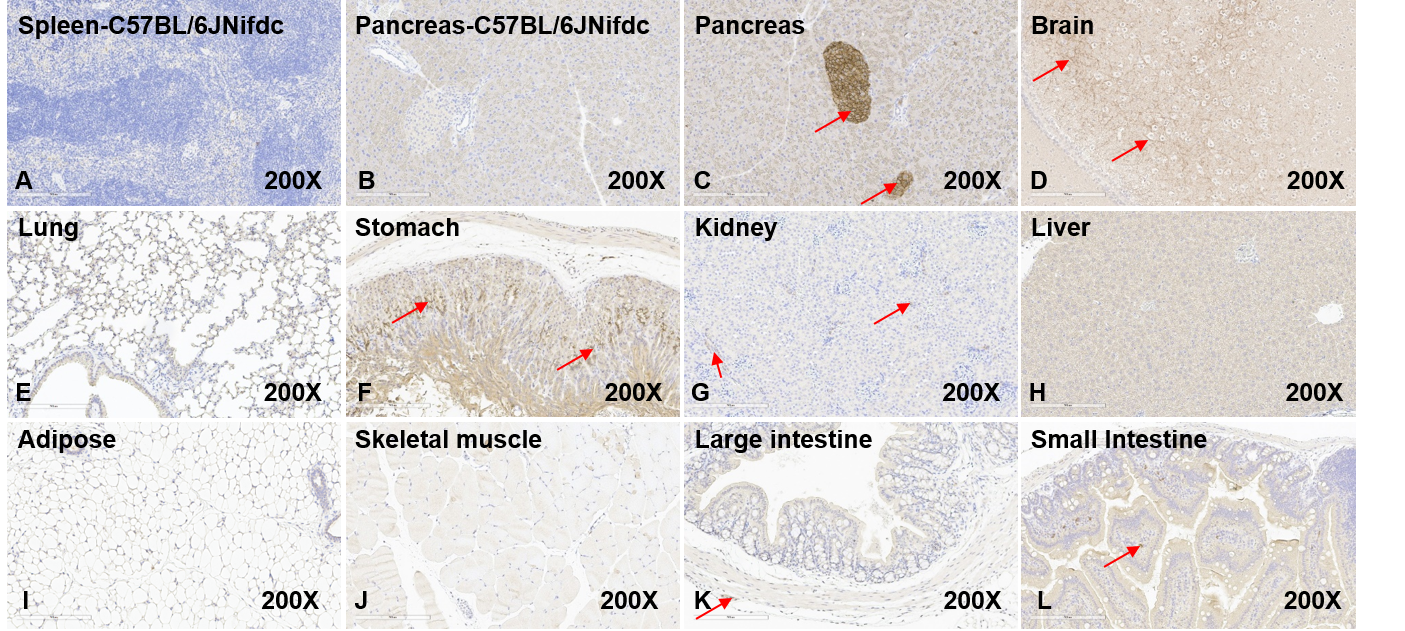
- Human GLP1R was detected in homozygous B-hGLP1R mice, but not in wild-type mice.
Human GLP1R expression in different tissues of B-hGLP1R mice by IHC. Tissues were stained with human-specific antibodies GLP1R (Anti-GLP1R antibody, abcam, ab254352) (B-L). (A) The spleen of wild-type C57BL/6JNifdc mice was a tissue-negative control. (B) The Pancreas of C57BL/6JNifdc mice showed human GLP1R negative. (C, D, F, G, K, L) The pancreas, brain, stomach, kidney, large intestine, and small intestine of B-hGLP1R mice showed human GLP1R positivity. (E, H, I, J) Lung, liver, adipose, and skeletal muscle of B-hGLP1R mice show human GLP1R negative. Original magnification ×200. Abbreviations: IHC, immunohistochemistry.
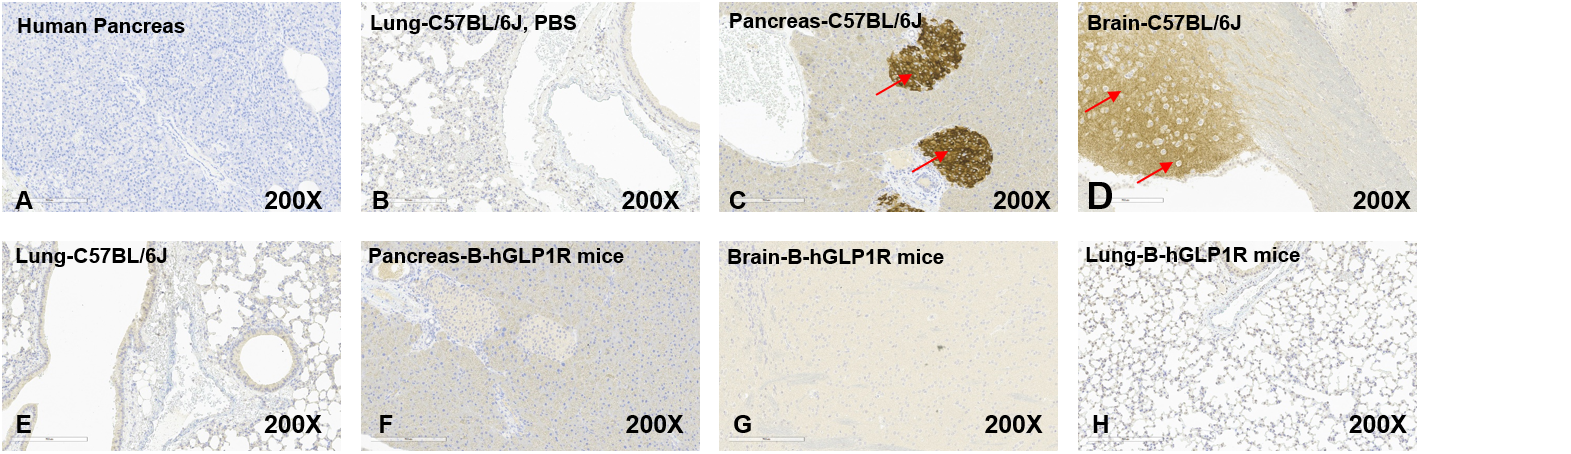
- Mouse GLP1R detectable only in wild-type C57BL/6JNifdc mice but not in homozygous B-hGLP1R mice.
Mouse GLP1R expression in different tissues of B-hGLP1R mice by IHC. Tissues were stained with mouse-specific antibodies GLP1R (Anti-GLP-1R antibody, ab218532) (B-H). (A) The human pancreas tissue was a tissue-negative control. (C, D) The pancreas and brain of wild-type C57BL/6JNifdc mice showed mouse GLP1R positive. (E) The lung tissue of wild-type C57BL/6JNifdc mice showed mouse GLP1R negative. (F, G, H) The pancreas, brain, and lung of B-hGLP1R mice showed mouse GLP1R negative. Original magnification ×200. Abbreviations: IHC, immunohistochemistry.
Analysis of Leukocyte Subpopulations
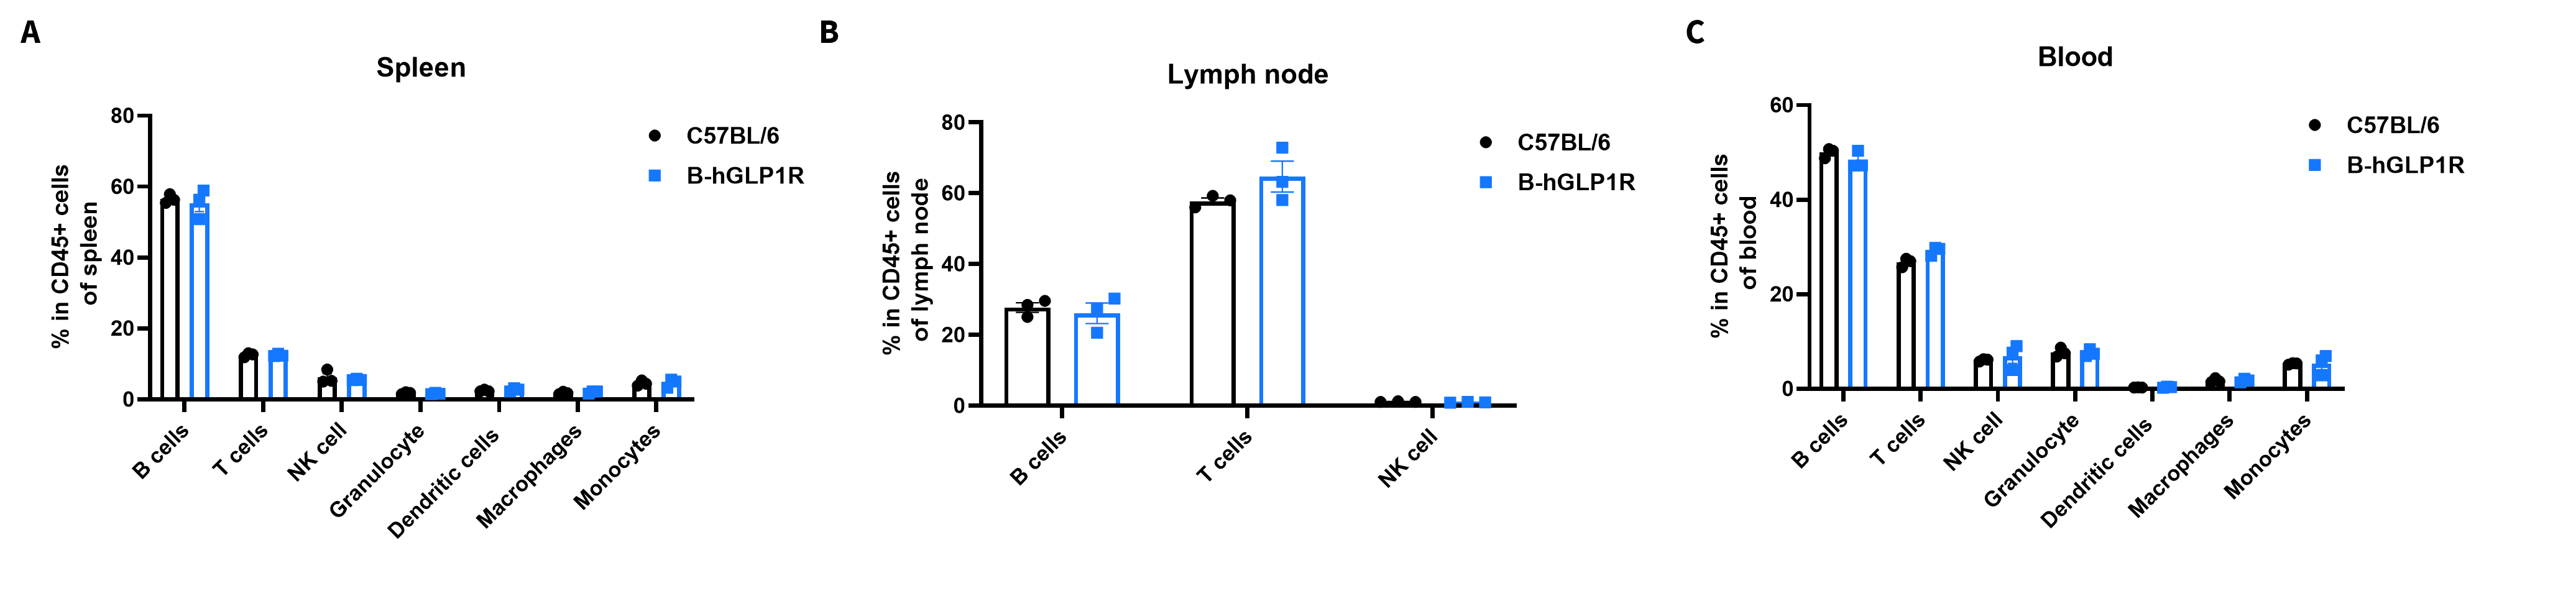
- The frequencies of T cells, B cells, NK cells, DCs, neutrophils, monocytes, and macrophages in homozygous B-hGLP1R mice were similar to those in C57BL/6 mice
- Humanization of GLP1R does not affect normal immune cell development or distribution.
Analysis of leukocyte subpopulations by flow cytometry in immune organs and blood. Splenocytes, peripheral blood, and lymph nodes were isolated from C57BL/6 and B-hGLP1R mice (female, 9-week-old, n = 3). Single live cells were gated on the CD45⁺ population and analyzed by flow cytometry as indicated. Values are expressed as mean ± SEM.
Analysis of T Cell Subpopulations
- The proportions of CD4⁺ T cells, CD8⁺ T cells, and Tregs in homozygous B-hGLP1R mice were comparable to those in C57BL/6 mice
- Humanization of GLP1R does not affect normal T cell development, differentiation, or distribution.
Analysis of T-cell subpopulations by flow cytometry in immune organs and blood. Splenocytes, peripheral blood, and lymph nodes were isolated from C57BL/6 and B-hGLP1R mice (female, 9-week-old, n = 3). Single live cells were gated on the CD3⁺ T-cell population and analyzed by flow cytometry as indicated. Values are expressed as mean ± SEM.
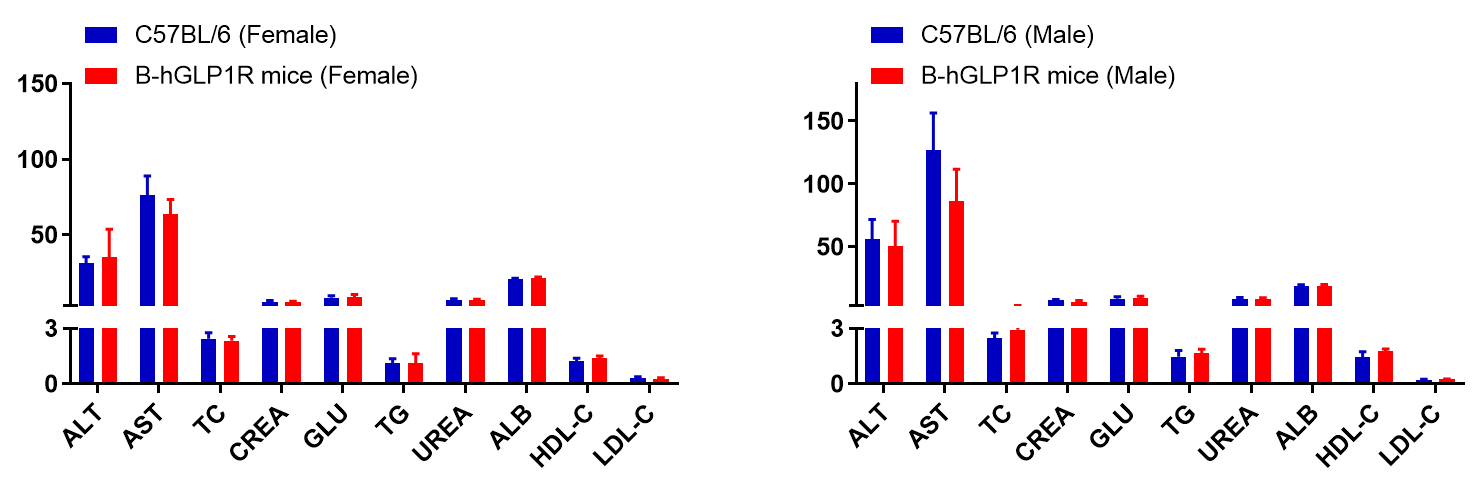
Blood Biochemical Analysis
- No significant differences were observed compared with wild-type mice.
Blood biochemical parameters of B-hGLP1R mice are shown. Values are expressed as mean ± SD.
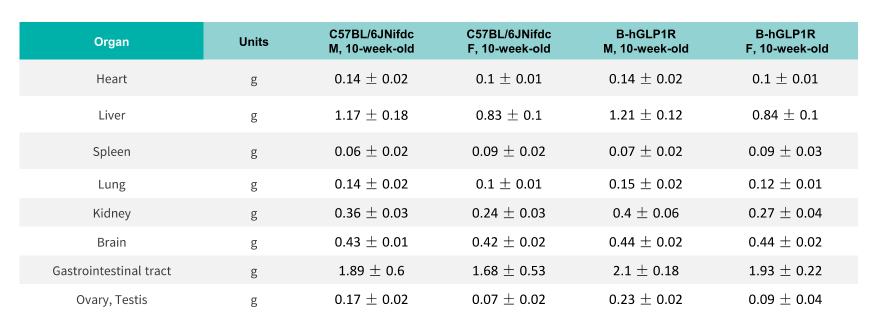
Organ Weight
Average weights of major organs in B-hGLP1R mice.
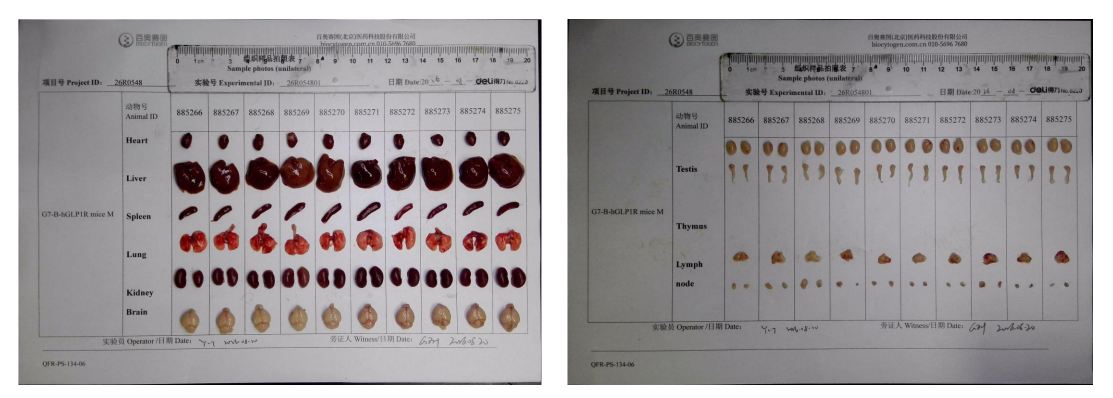
Gross Organ Anatomy (Male)
Organs of female B-hGLP1R mice (10-week-old, n = 10).
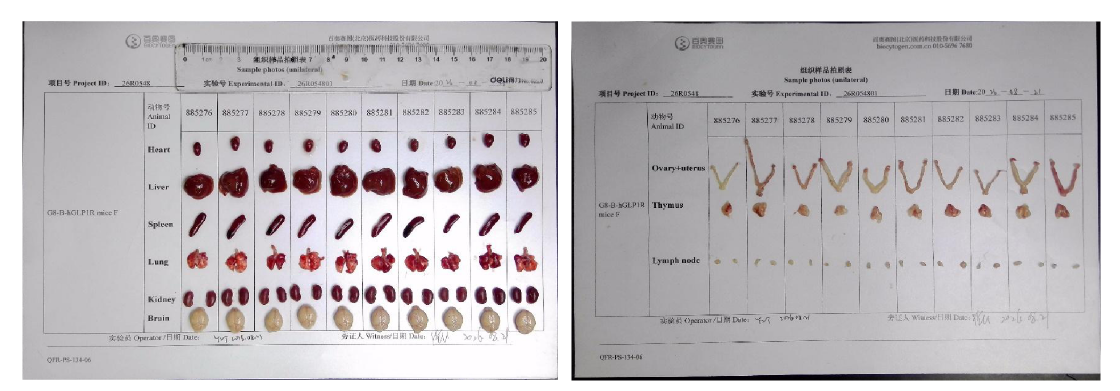
Gross Organ Anatomy (Female)
Organs of female B-hGLP1R mice (10-week-old, n = 10).
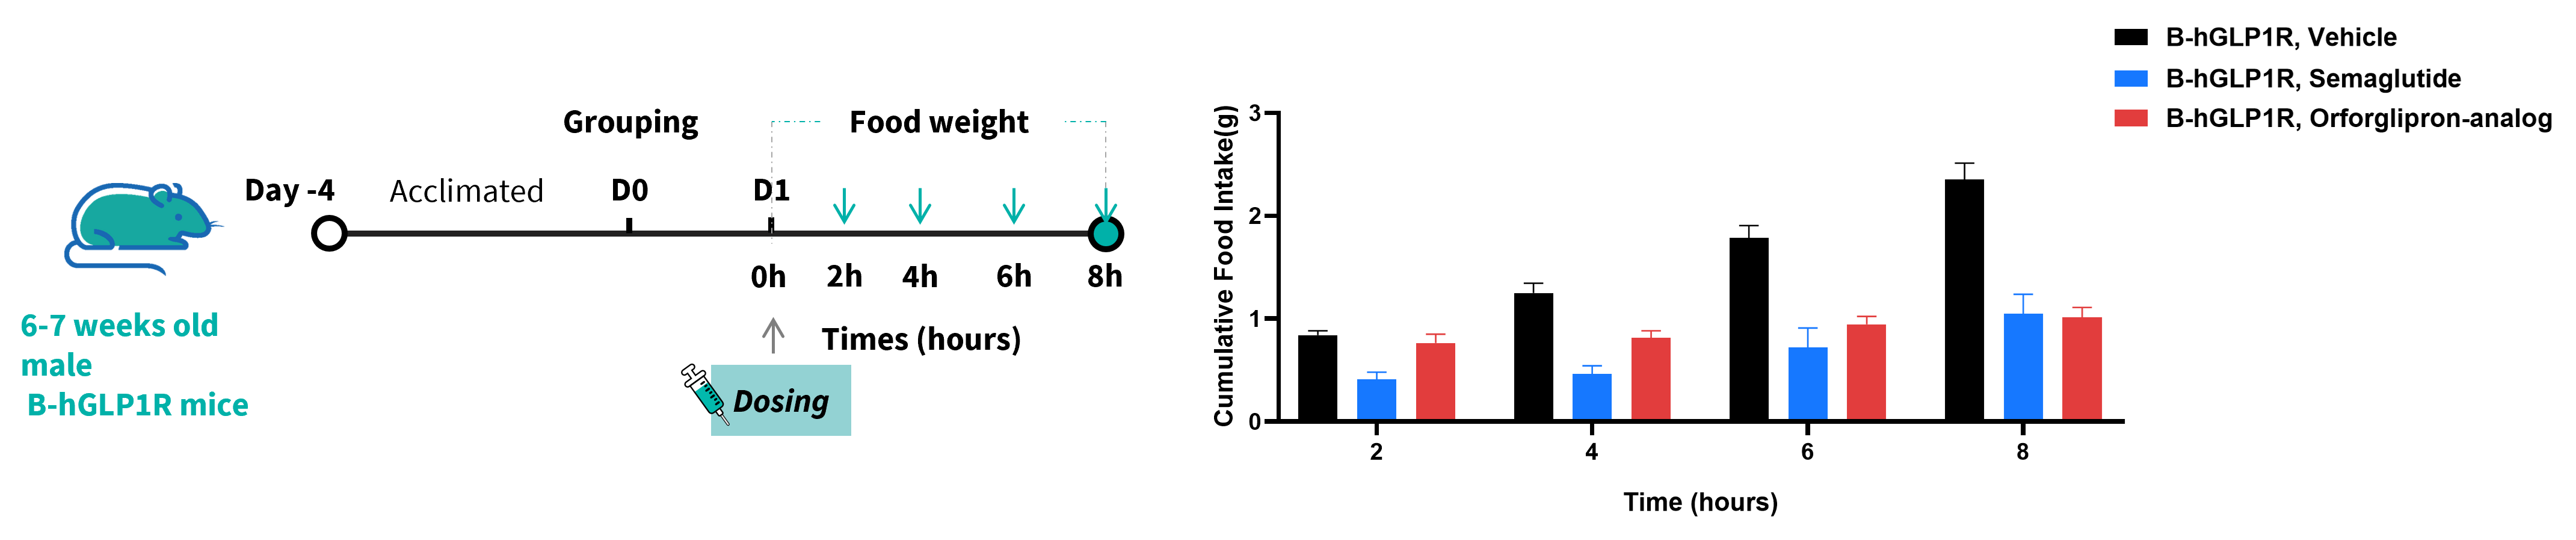
Efficacy of Orforglipron and Semaglutide on Food Intake
- Orforglipron and Semaglutide reduced the food intake in B-hGLP1R mice.
Food intake study of orforglipron and semaglutide in B-hGLP1R mice. B-hGLP1R mice (6–7 weeks old) were acclimated to once-daily oral dosing with vehicle for 4 days and then grouped based on body weight and daily food intake. Mice were fasted overnight and dosed with vehicle or test compound in the morning (before 10 AM). Food was returned 15 minutes post-dosing, and the remaining food was measured at 2, 4, 6, and 8 hours post-dosing. Values are presented as mean ± SEM.
Efficacy of PF-06882961 on IPGTT
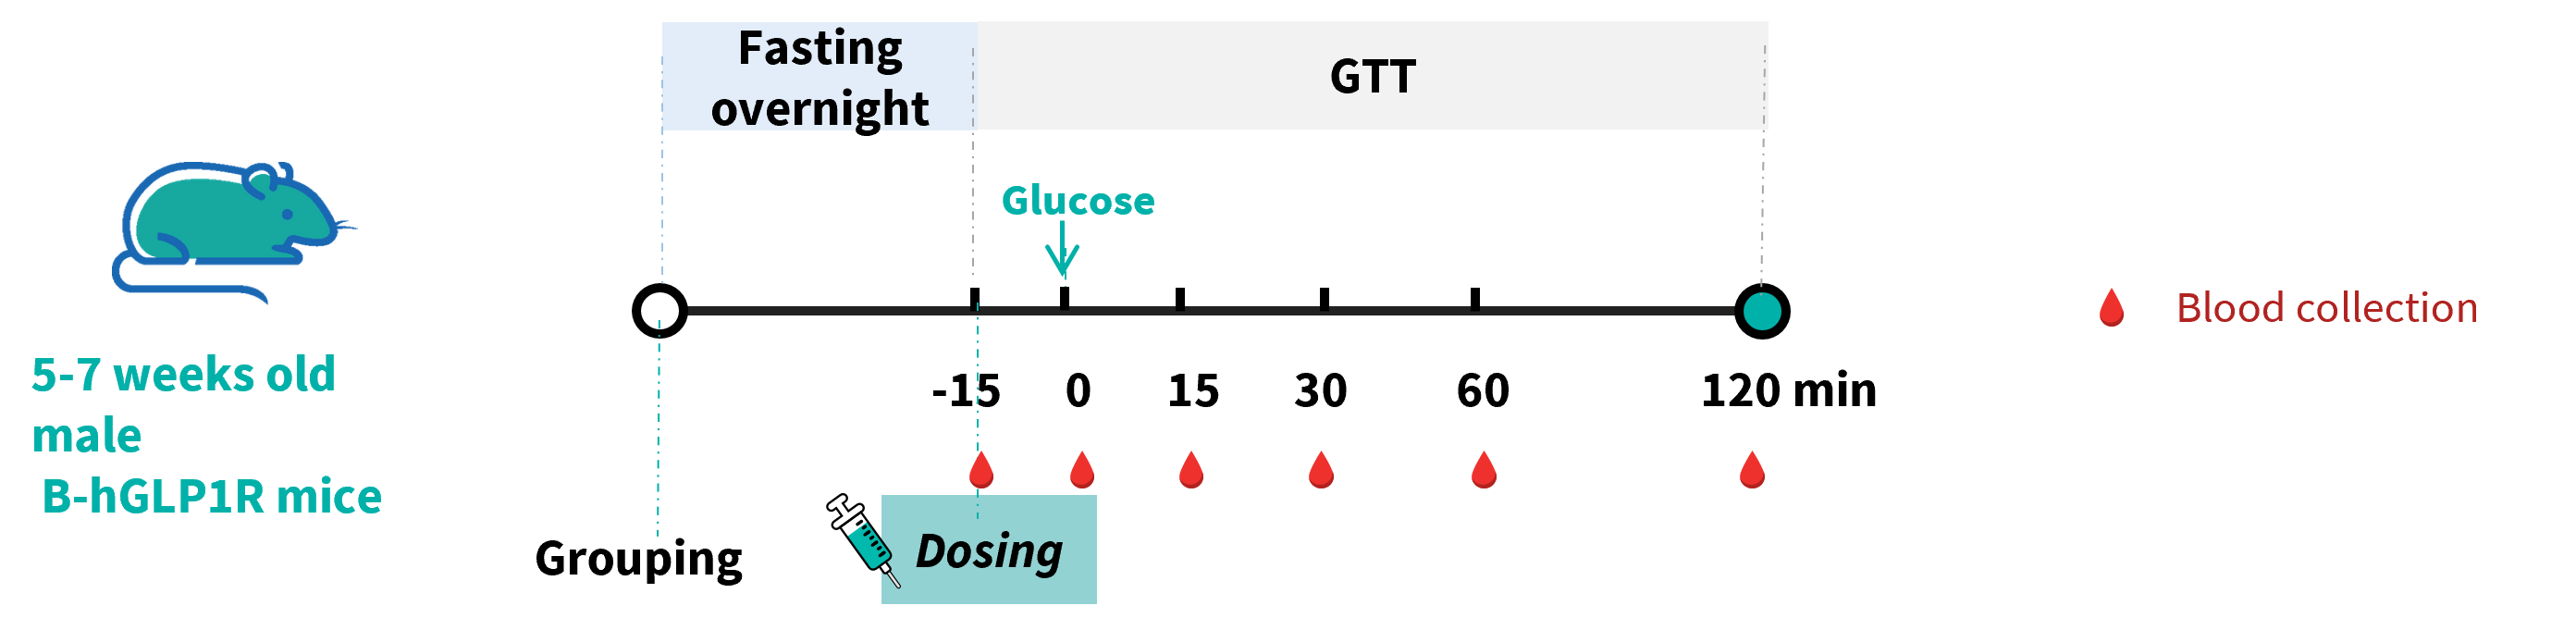
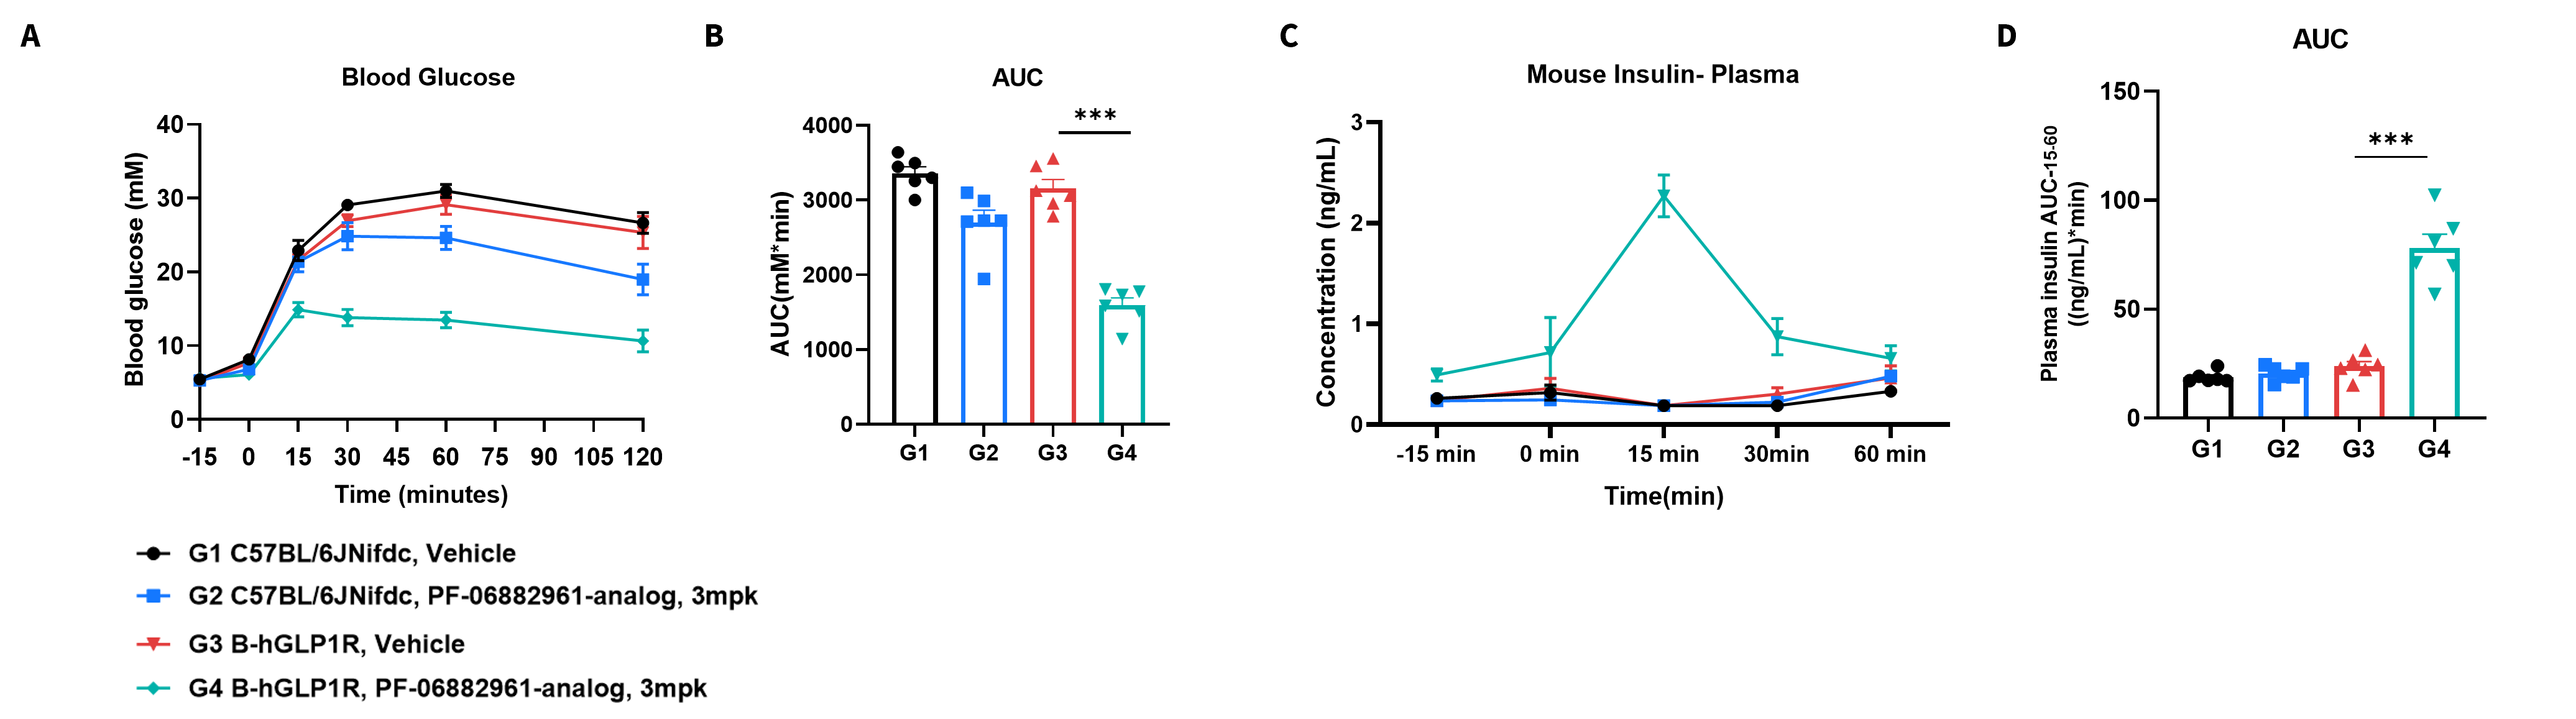
PF-06882961 improved glucose tolerance and promoted insulin secretion in B-hGLP1R mice. Wild-type C57BL/6JNifdc mice and B-hGLP1R mice (5–7 weeks old) were treated with PF-06882961 at 3 mg/kg. Then the Intraperitoneal Glucose Tolerance Test (IPGTT) was performed in C57BL/6JNifdc and B-hGLP1R mice for 2g/kg D-Glucose (20% Glucose, 10 μL/g).
- PF-06882961 improved glucose tolerance and promoted insulin secretion in B-hGLP1R mice but not in wild-type C57BL/6JNifdc mice.
PF-06882961 improved glucose tolerance and promoted insulin secretion in B-hGLP1R mice. Wild-type C57BL/6JNifdc mice and B-hGLP1R mice (5–7 weeks old) were treated with PF-06882961 at 3 mg/kg. Then the IPGTT was performed in C57BL/6JNifdc and B-hGLP1R mice for 2g/kg D-Glucose (20% Glucose, 10 μL/g). (A) Blood glucose. (B) Area under the curve (AUC) for IPGTT. (C) Plasma insulin. (D) Area under the curve (AUC) for the plasma insulin. Values are expressed as mean ± SEM. Significance was determined by the unpaired t-test. (*P < 0.05, **P < 0.01, ***P < 0.001)
Efficacy of Orforglipron on IPGTT
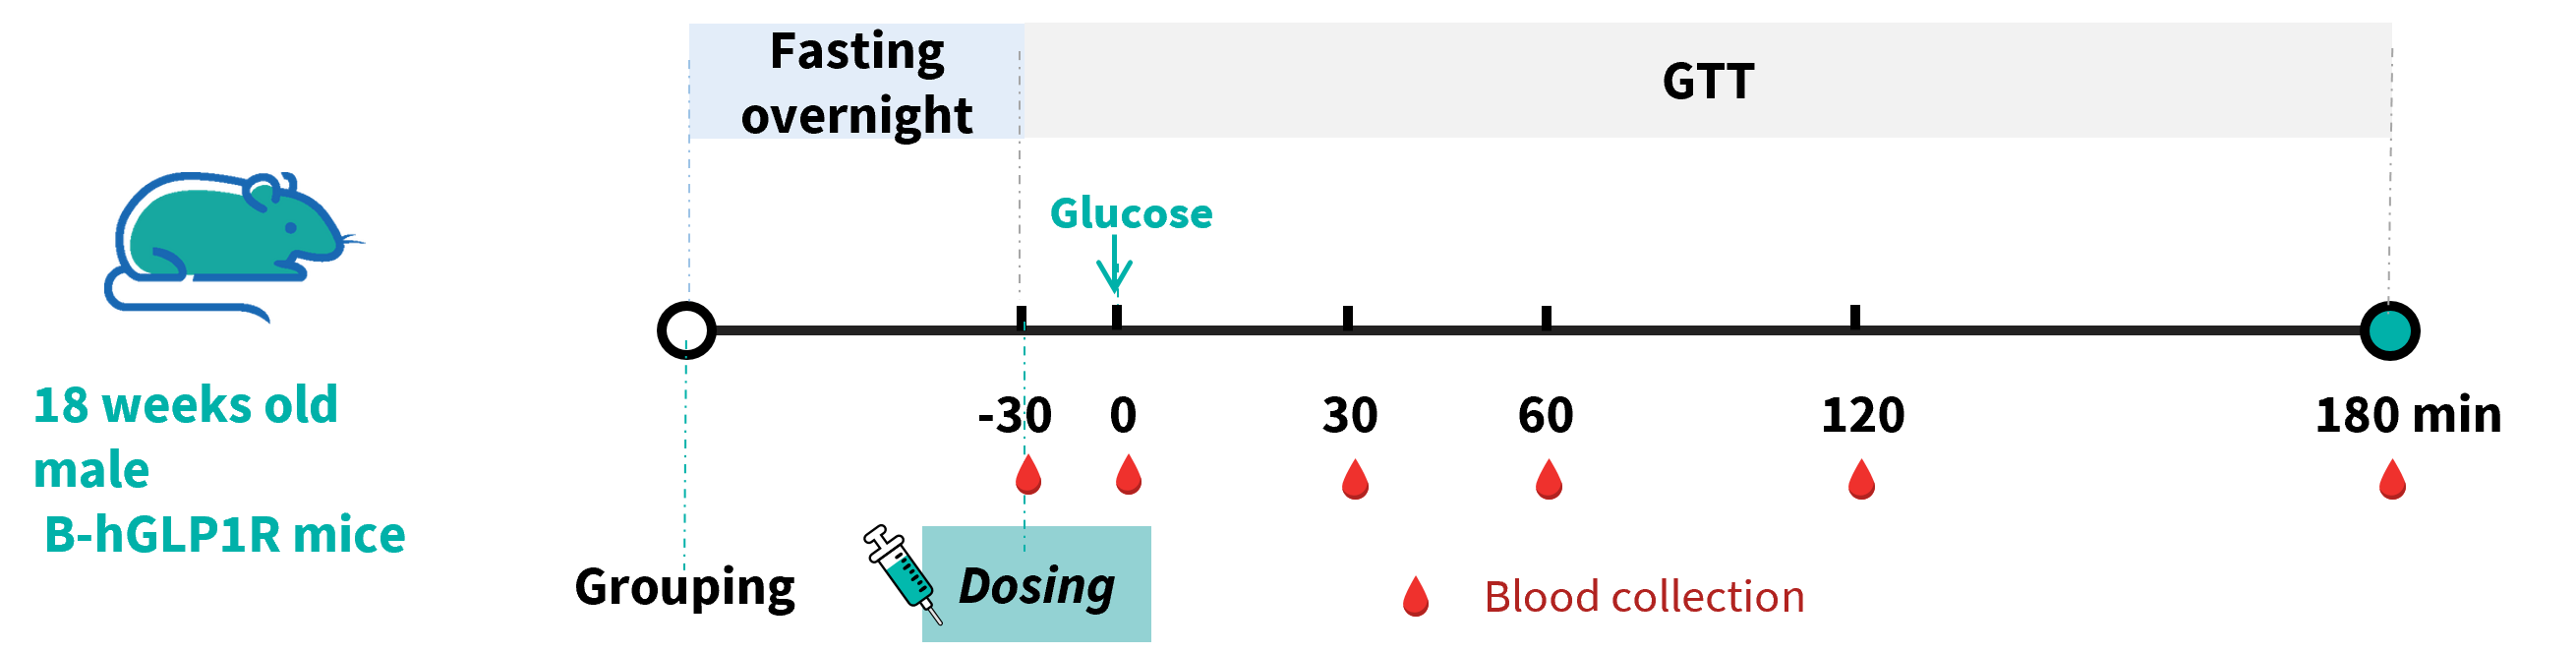
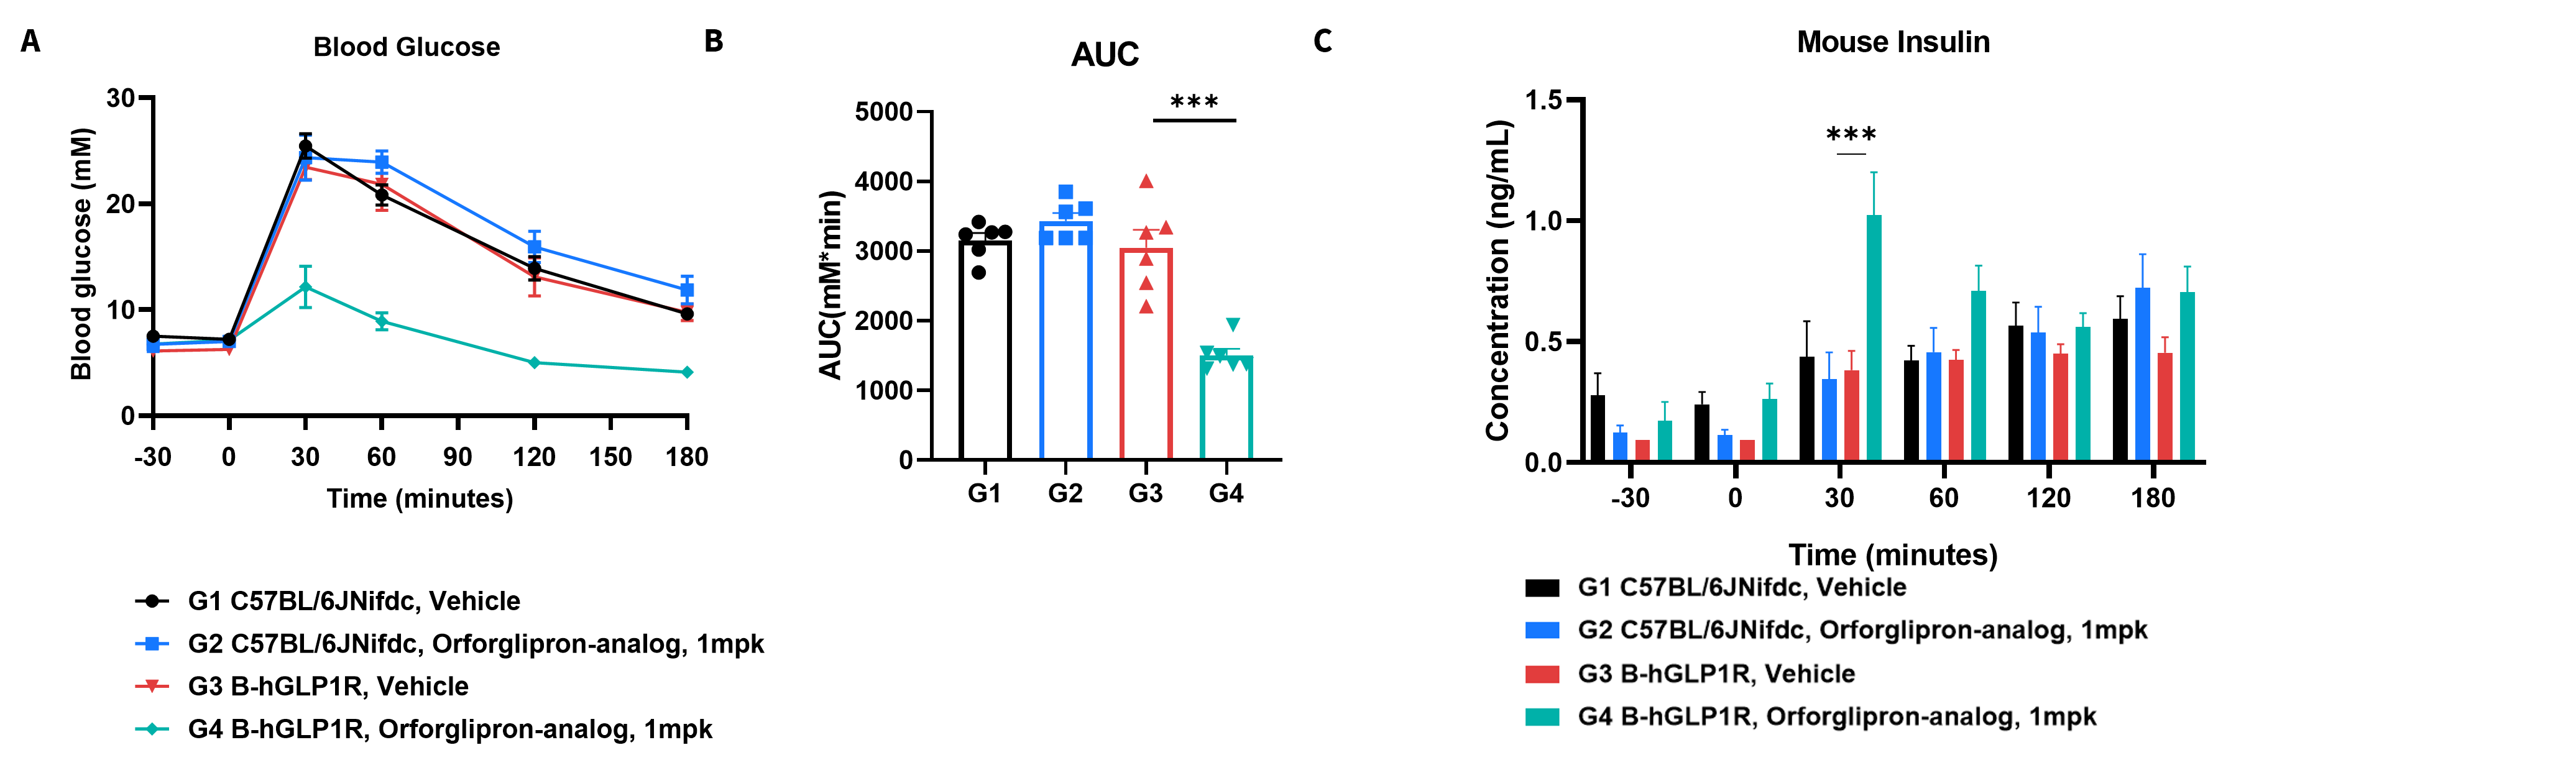
Orforglipron improved glucose tolerance and promoted insulin secretion in B-hGLP1R mice. Wild-type C57BL/6JNifdc mice and B-hGLP1R mice (18 weeks old) were treated with Orforglipron at 1 mg/kg. Then the Intraperitoneal Glucose Tolerance Test (IPGTT) was performed in C57BL/6JNifdc and B-hGLP1R mice for 2g/kg D-Glucose (40% Glucose, 5 μL/g).
- Orforglipron improved glucose tolerance and promoted insulin secretion in B-hGLP1R mice but not in wild-type C57BL/6JNifdc mice.
Orforglipron improved glucose tolerance and promoted insulin secretion in B-hGLP1R mice. Wild-type C57BL/6JNifdc mice and B-hGLP1R mice (18 weeks old) were treated with Orforglipron at 1 mg/kg. Then the IPGTT was performed in C57BL/6JNifdc and B-hGLP1R mice for 2g/kg D-Glucose (20% Glucose, 10 μL/g). (A) Blood glucose. (B) Area under the curve (AUC) for IPGTT. (C) Plasma insulin. Values are expressed as mean ± SEM. Significance was determined by the unpaired t-test. (*P < 0.05, **P < 0.01, ***P < 0.001)
Efficacy of Semaglutide in HFD-Induced Model
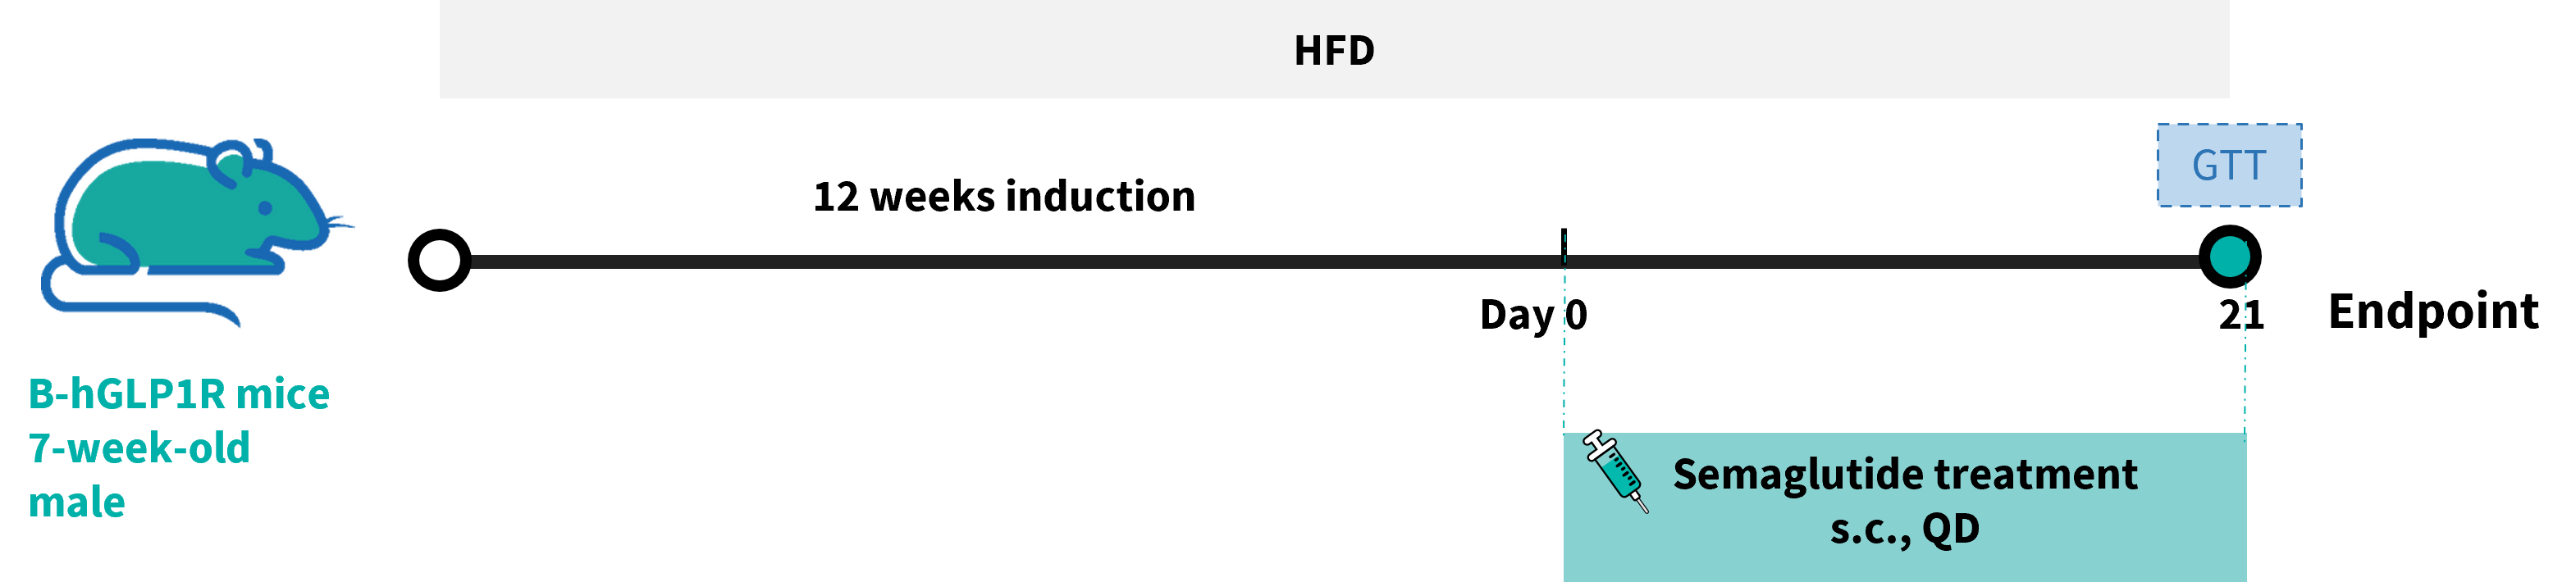
Efficacy of semaglutide in HFD-induced B-hGLP1R mice. B-hGLP1R mice were fed with a high-fat diet (HFD) for 12 weeks to induce obesity. Semaglutide and PBS were administered to the mice individually.
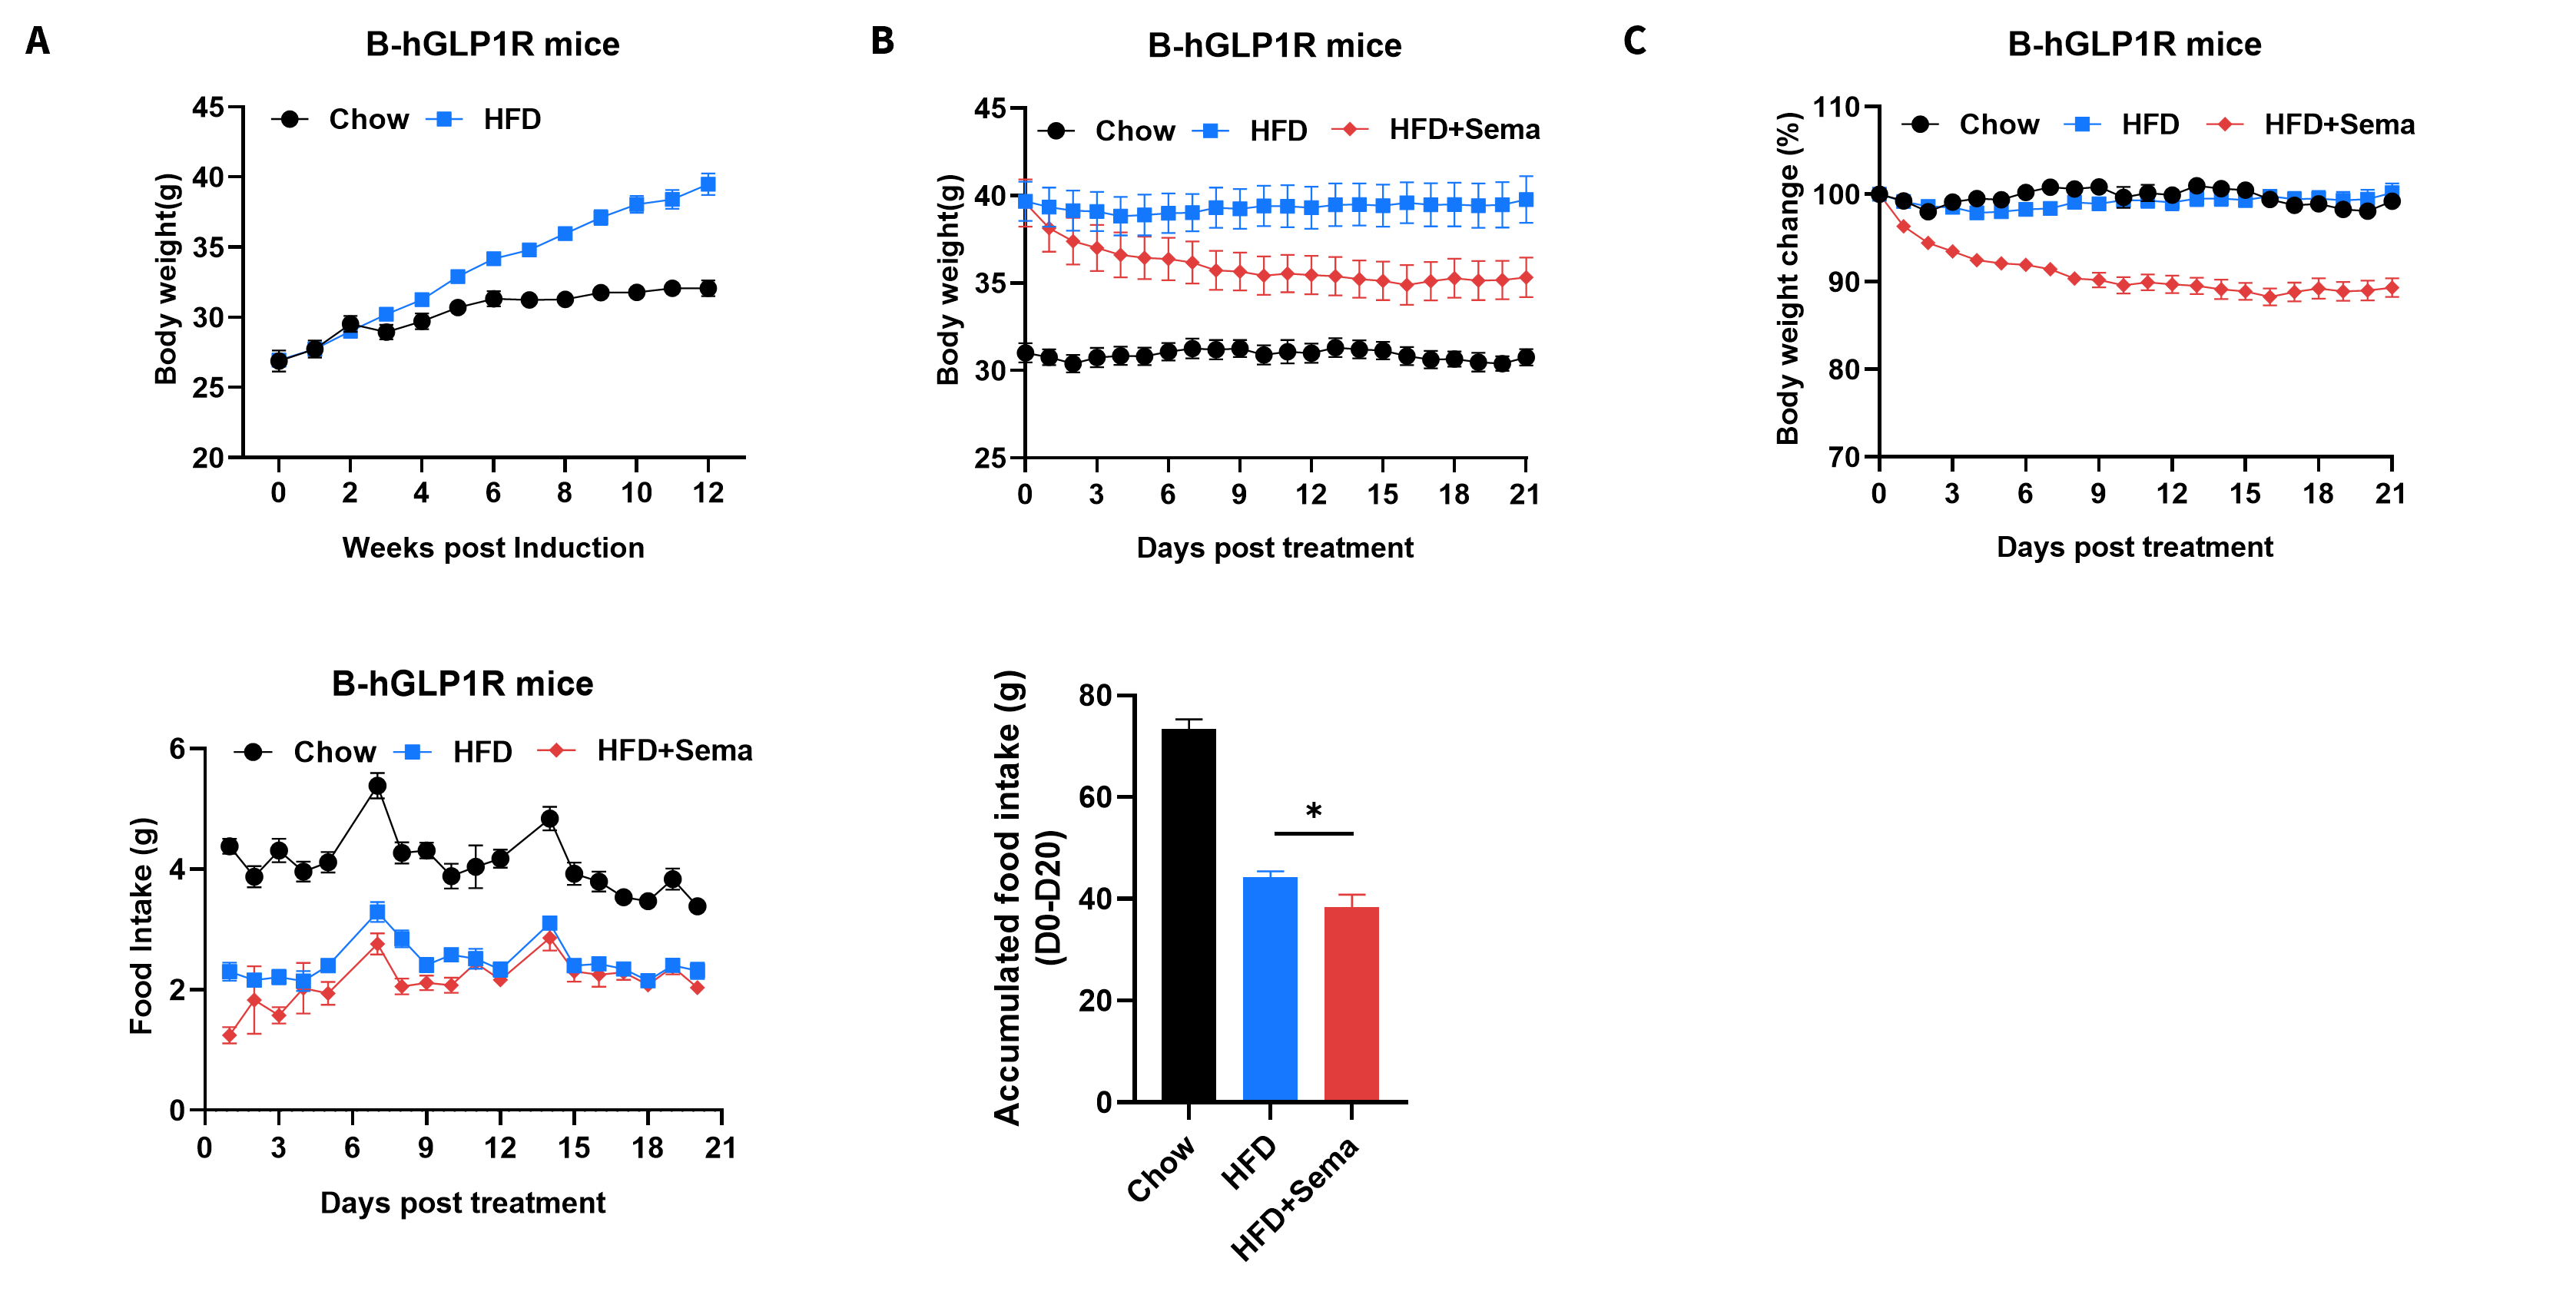
- Semaglutide can reduce body weight and food intake in HFD B-hGLP1R mice.
Efficacy of semaglutide in HFD-induced B-hGLP1R mice. B-hGLP1R mice were fed with a high-fat diet (HFD) for 12 weeks to induce obesity. (A) Body weight changes following HFD induction. (B–C) Body weight changes after semaglutide treatment. (D–E) Effects of semaglutide on food intake. 8–10 mice per group. Values are presented as mean ± SEM. Statistical significance was determined by ordinary one-way ANOVA.*p<0.05, **p<0.01,***p<0.001.
In Vivo Efficacy of Semaglutide in HFD-Induced B-hGLP1R Mice
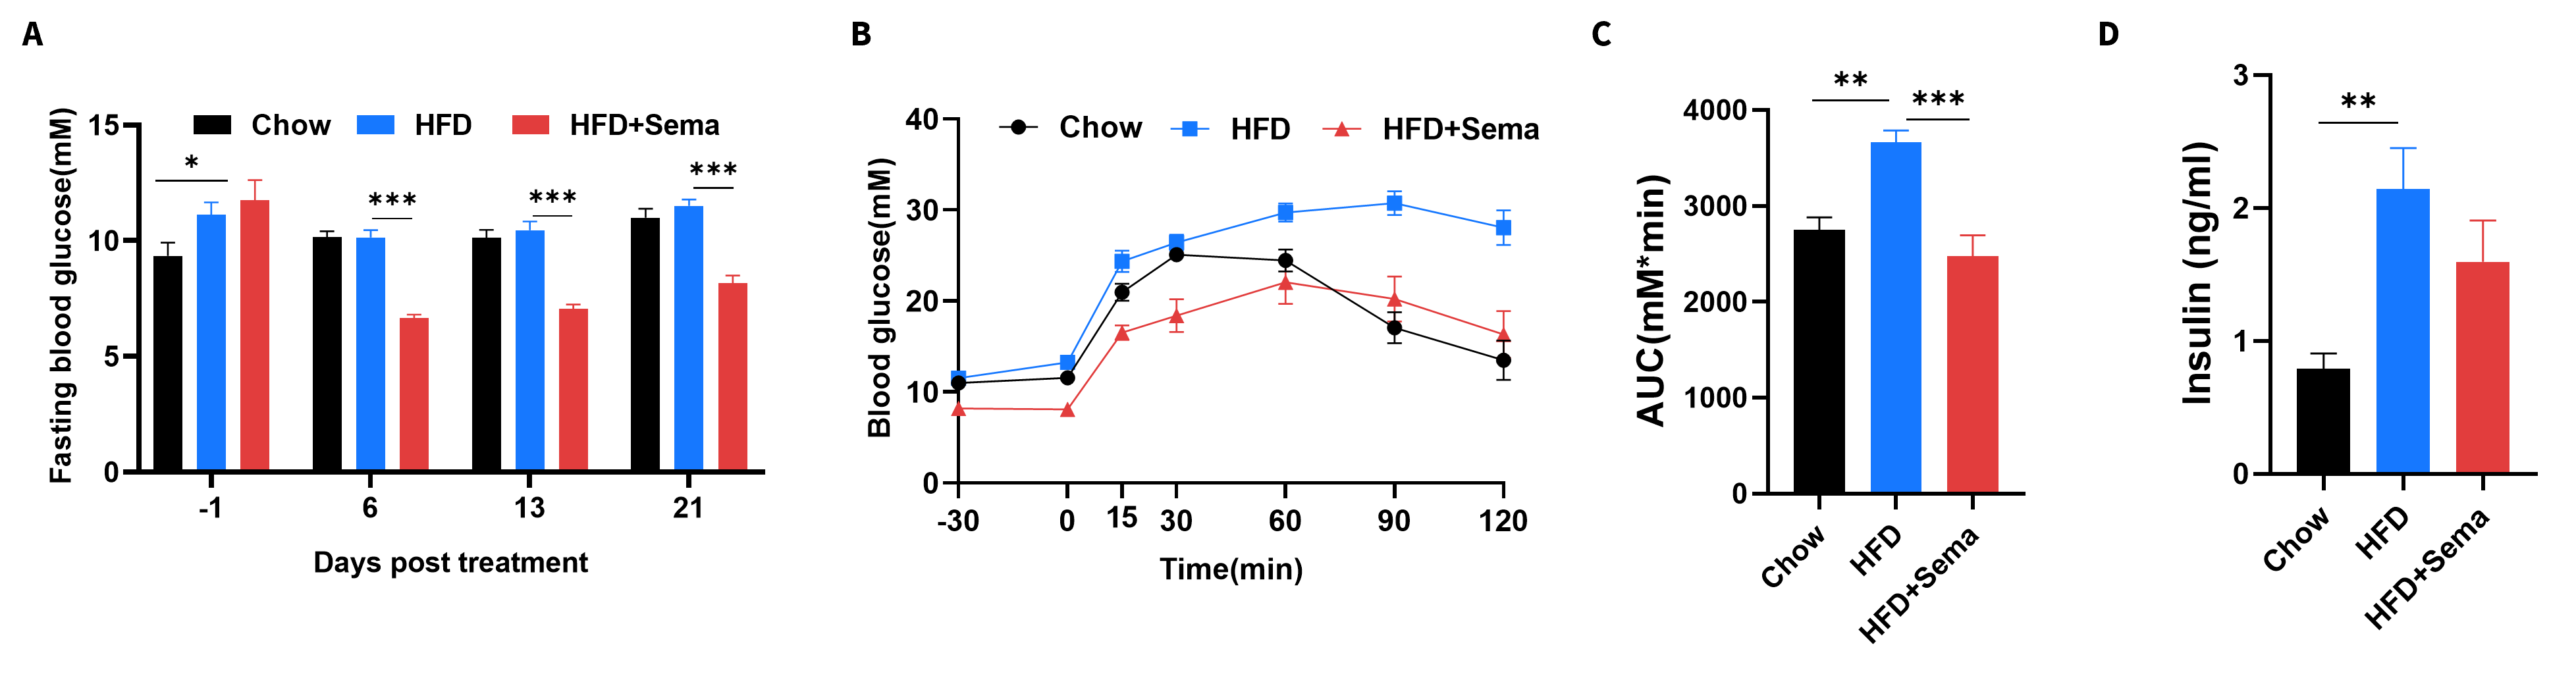
- Semaglutide improved glucose tolerance and helped combat insulin resistance in HFD B-hGLP1R mice.
Efficacy of semaglutide in HFD-induced B-hGLP1R mice. (A) Blood glucose change after Semaglutide treatment. (B) Blood glucose for IPGTT. (C) Area under the curve (AUC) for the IPGTT. 8-10 mice per group. Values are expressed as mean ± SEM. Significance was determined by the Ordinary one-way ANOVA. *p<0.05, **p<0.01,***p<0.001.
Efficacy of Semaglutide in HFD-Induced Model
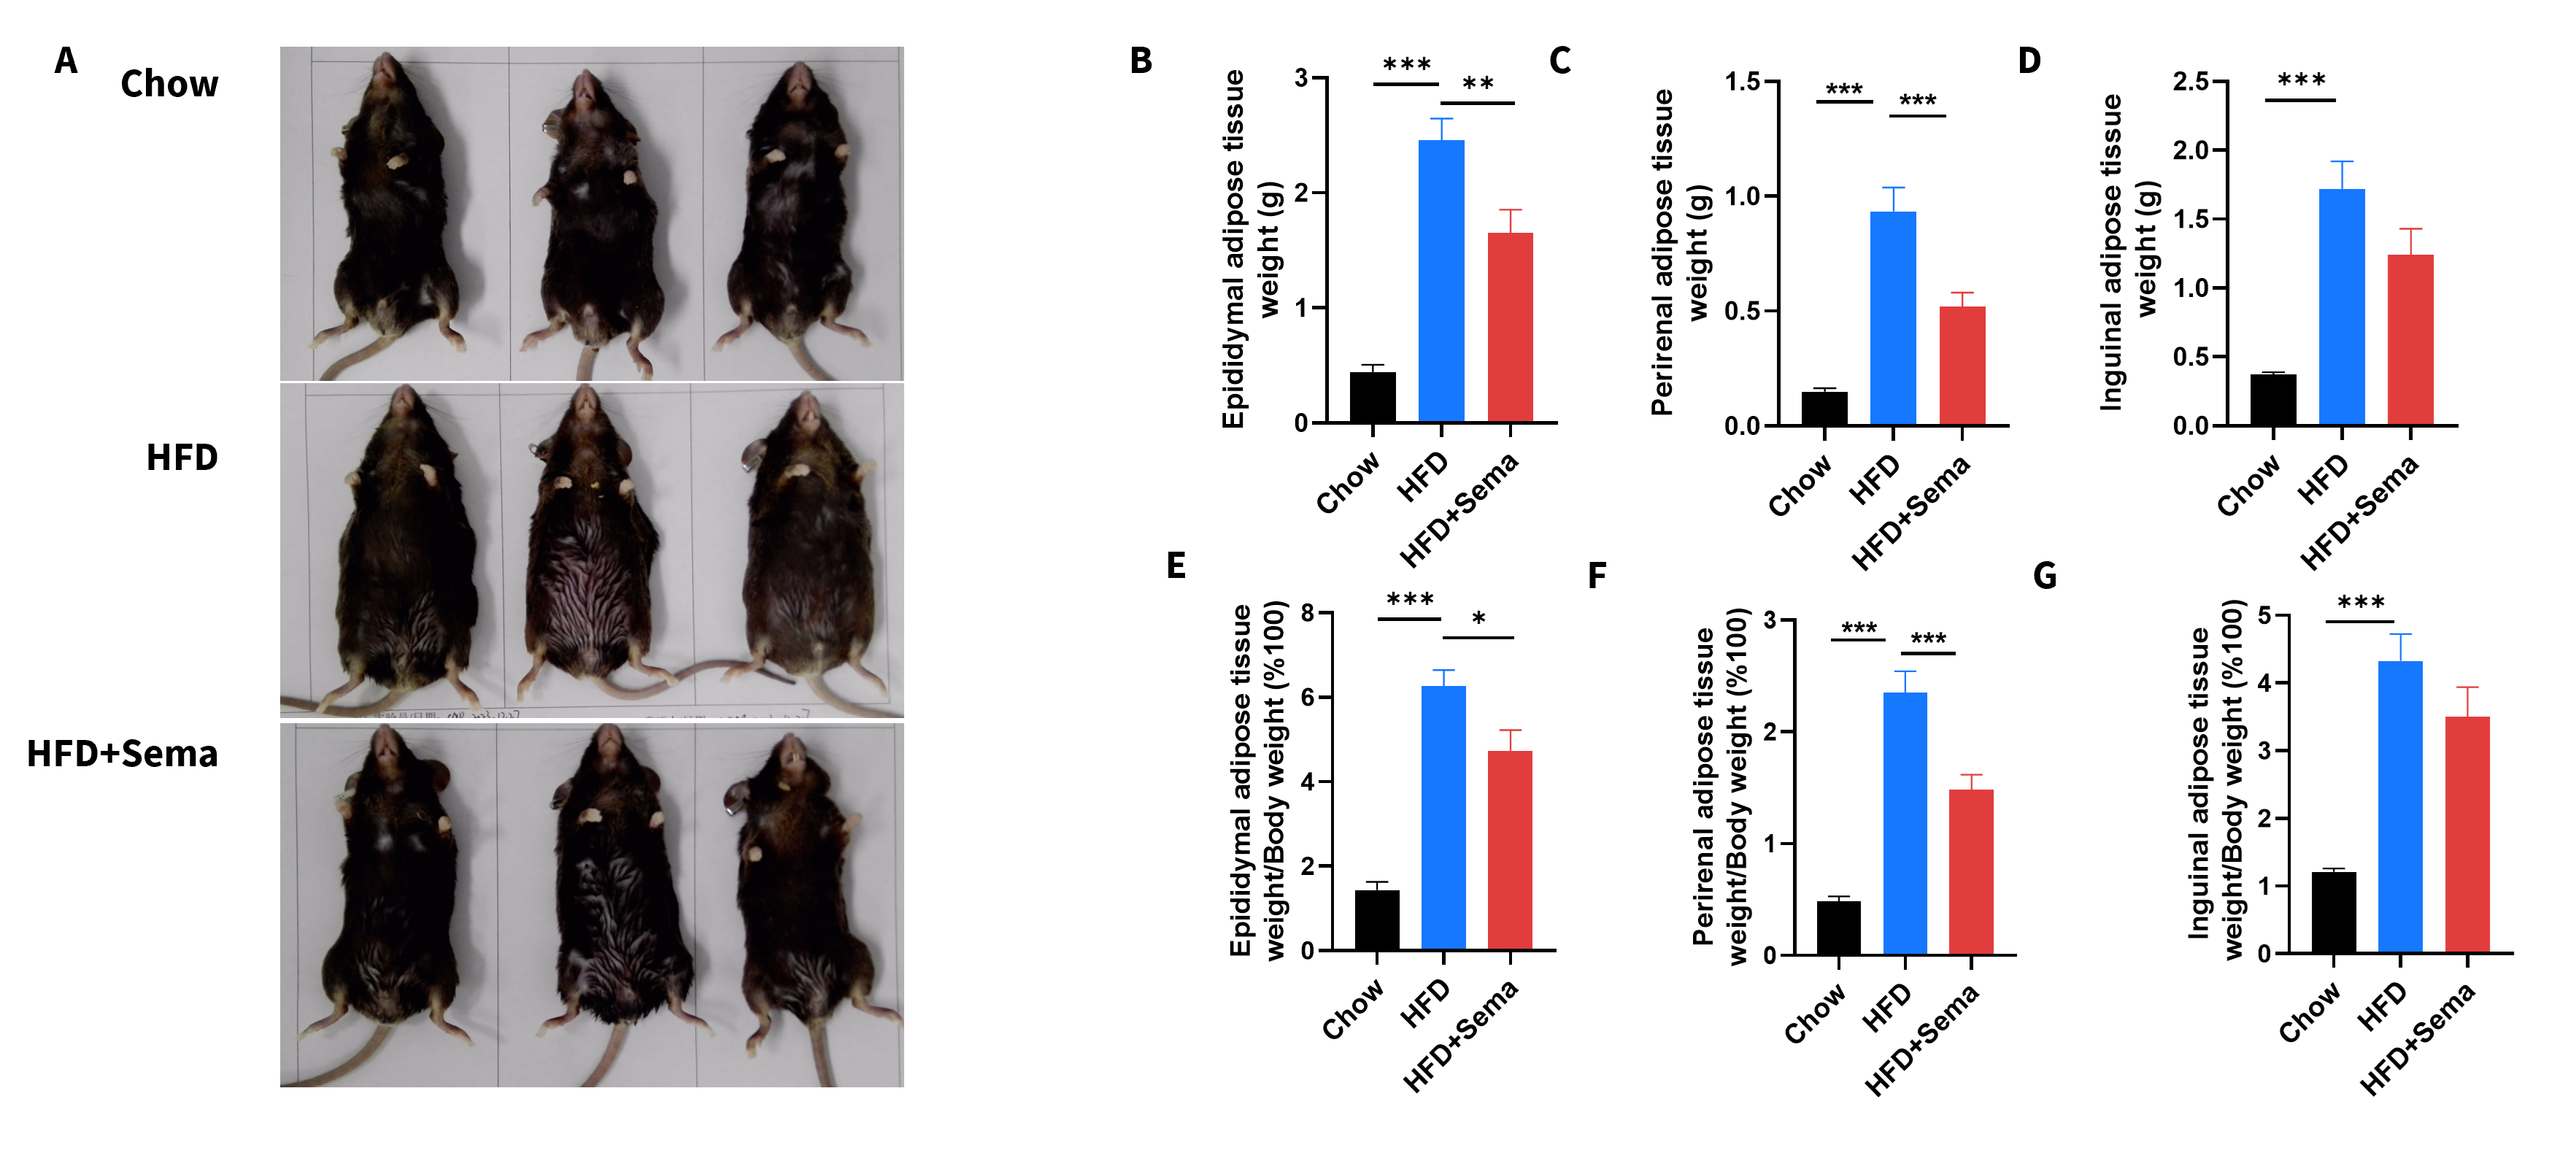
- Semaglutide can reduce body weight and adipose tissue weight in HFD B-hGLP1R mice.
Efficacy of semaglutide in HFD-induced B-hGLP1R mice. (A) Representative pictures of different groups at termination. (B-D) Adipose tissue weights after treatment. (E-G) Ratios of adipose tissue weight and body weight. Data are expressed as mean ± SEM. Significance was determined by the Ordinary one-way ANOVA. *p<0.05, **p<0.01,***p<0.001.
In vivo Efficacy in CDAA-HFD MASH Model
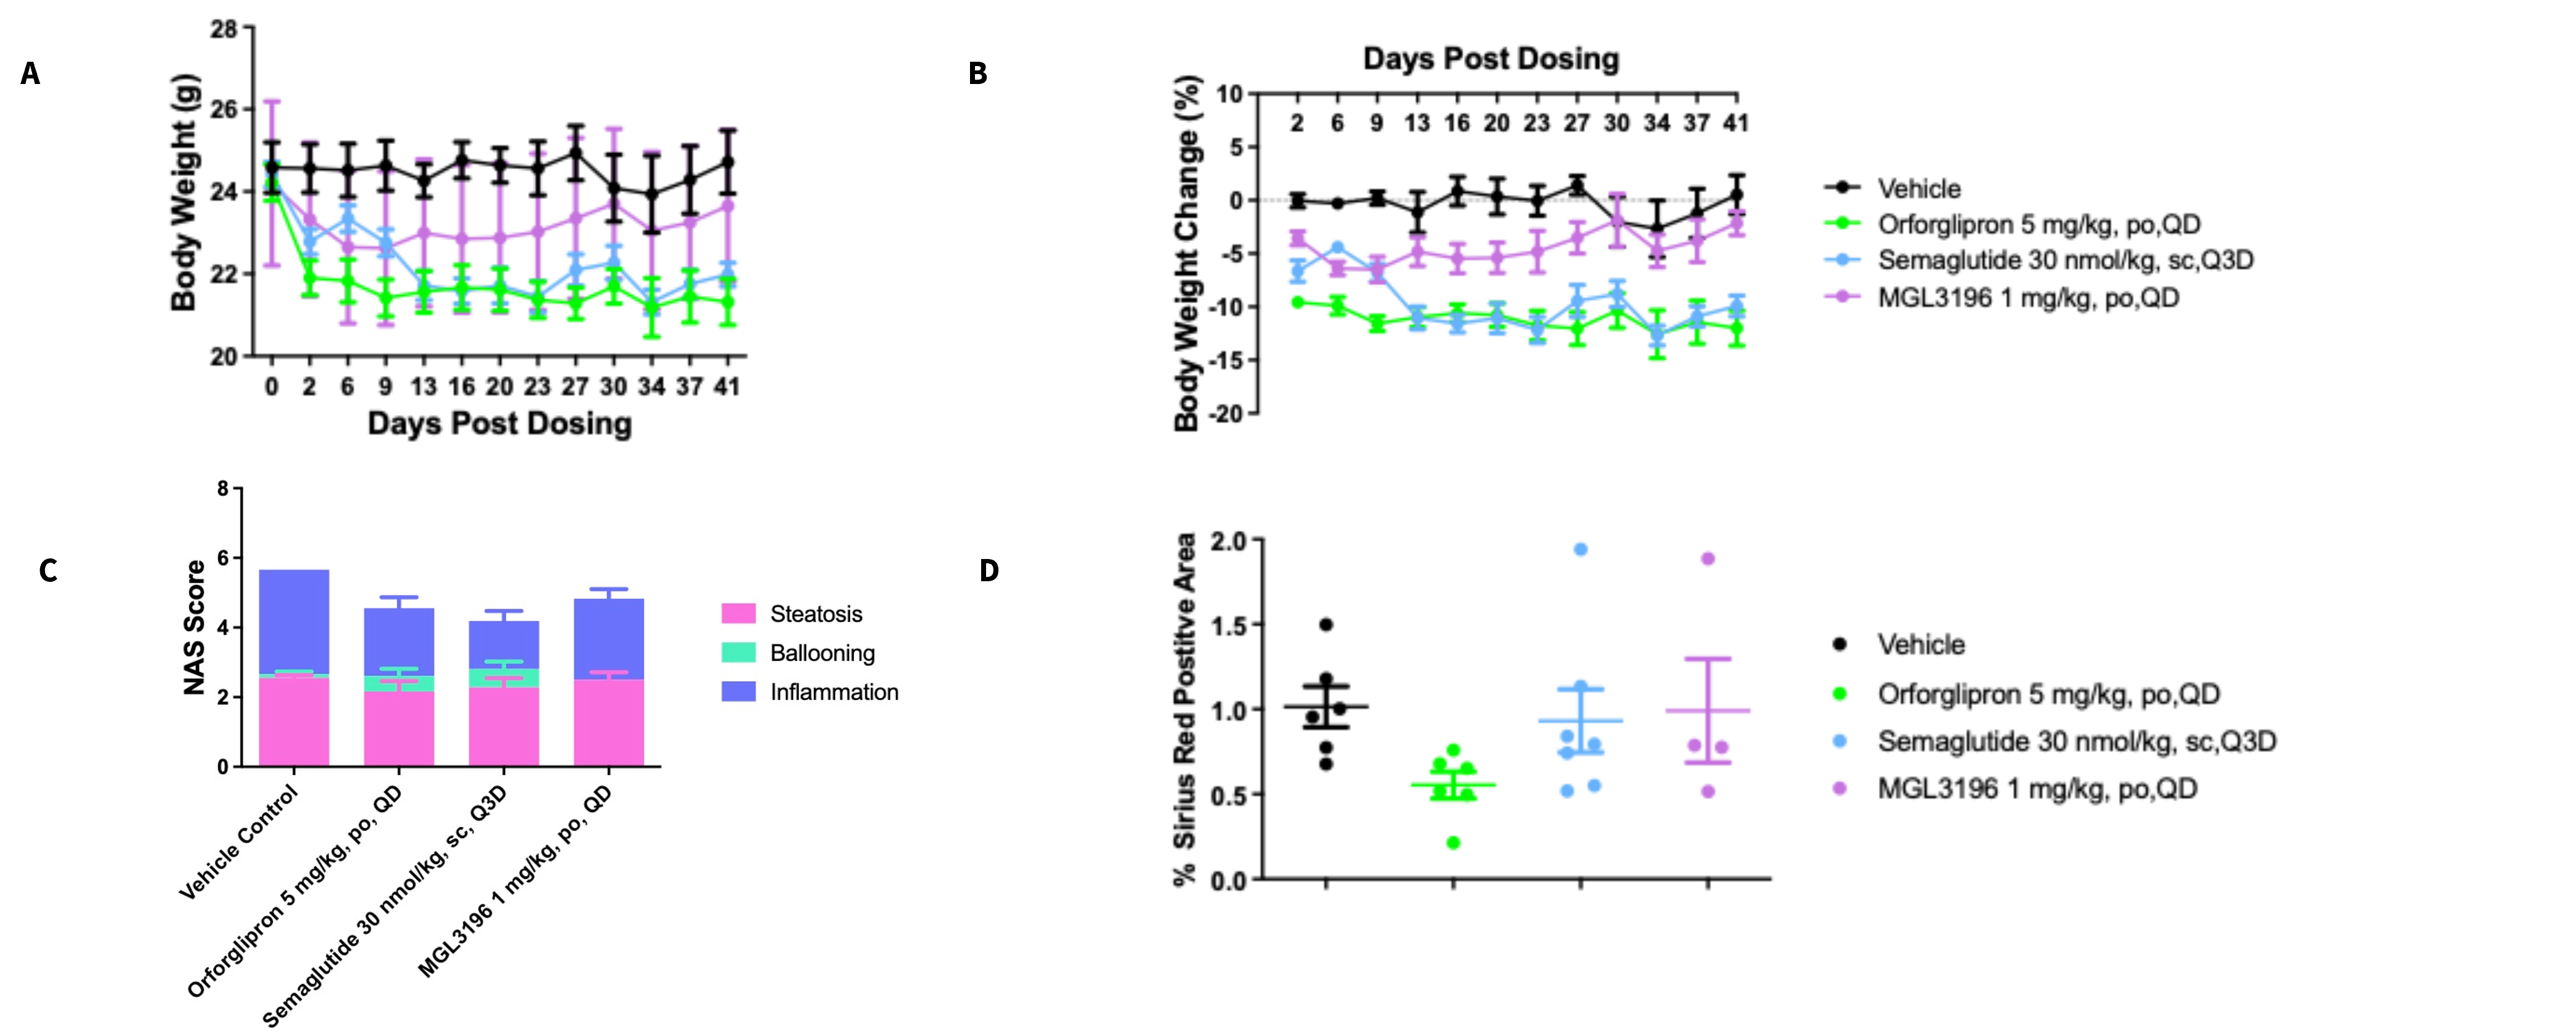
In vivo Efficacy in B-hGLP1R mice CDAA-HFD MASH Model. B-hGLP1R mice were fed a CDAA-HFD (the choline-deficient, 0.1% Methionine, 60% High-Fat Diet) to induce Metabolically Dysfunctional-Associated Steatohepatitis (MASH). Note: Data are shared upon the client's approval.
Efficacy of Semaglutide in HFD-Induced Model
In vivo Efficacy in B-hGLP1R mice CDAA-HFD MASH Model. (A-B) Body weight changes after treatment. (C) Histological assessment of the NAFLD activity score (NAS). (D) Sirius Red Positive Area after treatment. Note: Data are shared upon the client's approval.
* When publishing results obtained using this animal model, please acknowledge the source as follows: The animal model [B-hGLP1R mice] (Cat# 170164) was purchased from Biocytogen.