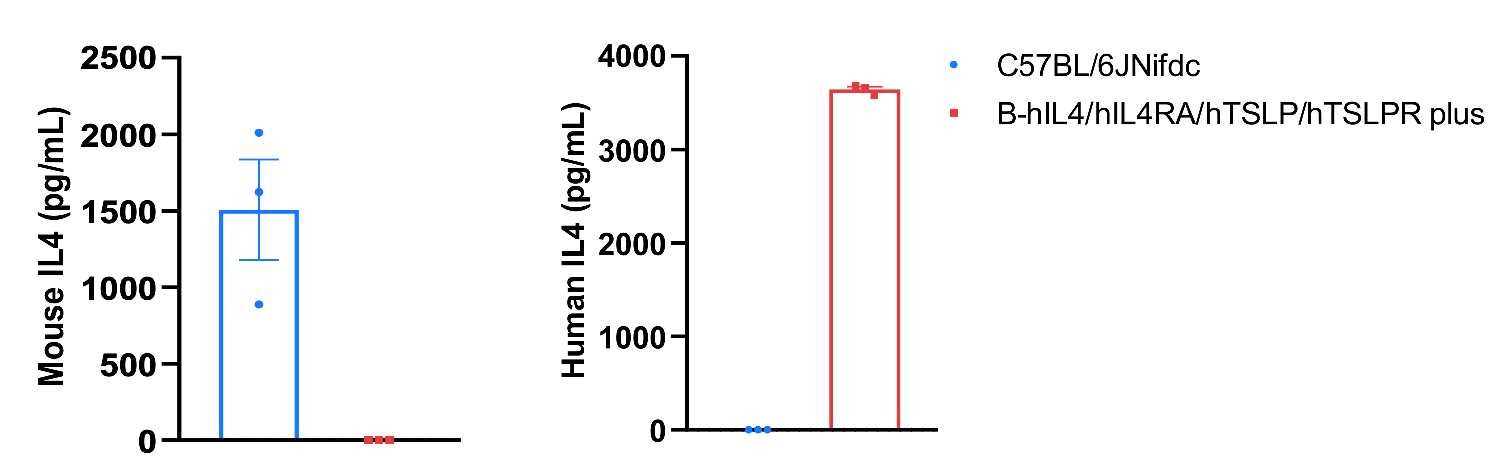
Protein expression analysis-IL4
Strain specific IL4 expression analysis in wild-type C57BL/6JNifdc mice and homozygous B-hIL4/hIL4RA/hTSLP/hTSLPR plus mice by ELISA. Serum was collected from wild-type C57BL/6JNifdc mice (n=3, 8-week-old, male) and homozygous B-hIL4/hIL4RA/hTSLP/hTSLPR plus mice(n=3, 8-week-old, male) that stimulated with anti-mouse CD3ε (7.5 μg/mice, i.p.) in vivo for 4 hrs, and analyzed by ELISA with species-specific IL4 ELISA kit (mIL4 kit: BioLegend 431104; hIL4 kit:BioLegend 430304). Mouse IL4 was only detectable in wild-type C57BL/6JNifdc mice. Human IL4 was only detectable in homozygous B-hIL4/hIL4RA/hTSLP/hTSLPR plus mice. Values are expressed as mean ± SEM.
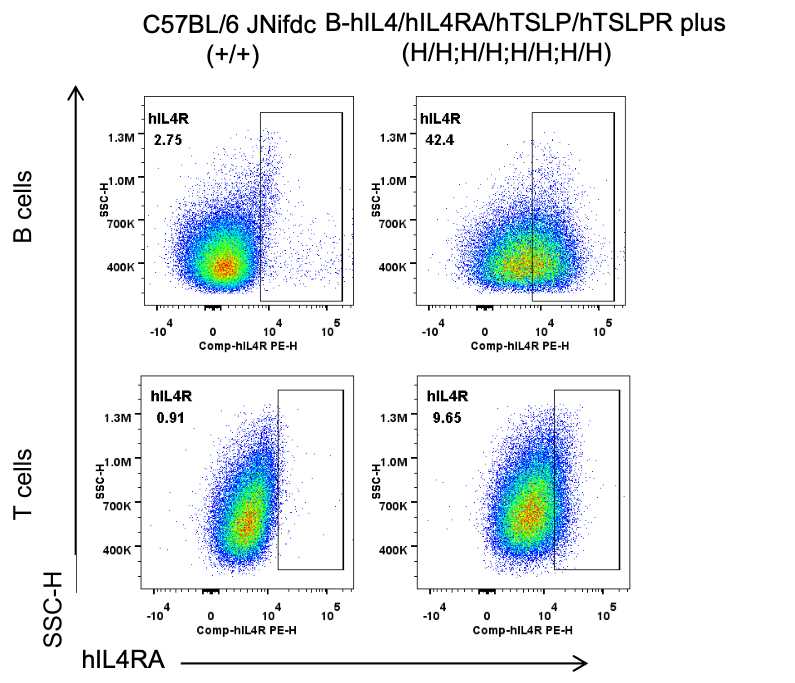
Protein expression analysis in spleen-IL4RA
Strain specific IL4RA expression analysis in wild-type C57BL/6JNifdc mice and homozygous humanized B-hIL4/hIL4RA/hTSLP/hTSLPR plus mice by flow cytometry. Splenocytes were stimulated with 2 μg/mL anti-mouse CD3ε (BioXcell, BE0001) and 5 μg/mL anti-mouse CD28 (BioXcell, BE0015) in vitro for 3 days. Protein expression was analyzed with anti-human IL4RA antibody (BD, 552178) by flow cytometry. Mouse IL4RA was only detectable in wild-type C57BL/6JNifdc mice. Human IL4RA was only detectable in homozygous B-hIL4/hIL4RA/hTSLP/hTSLPR plus mice.
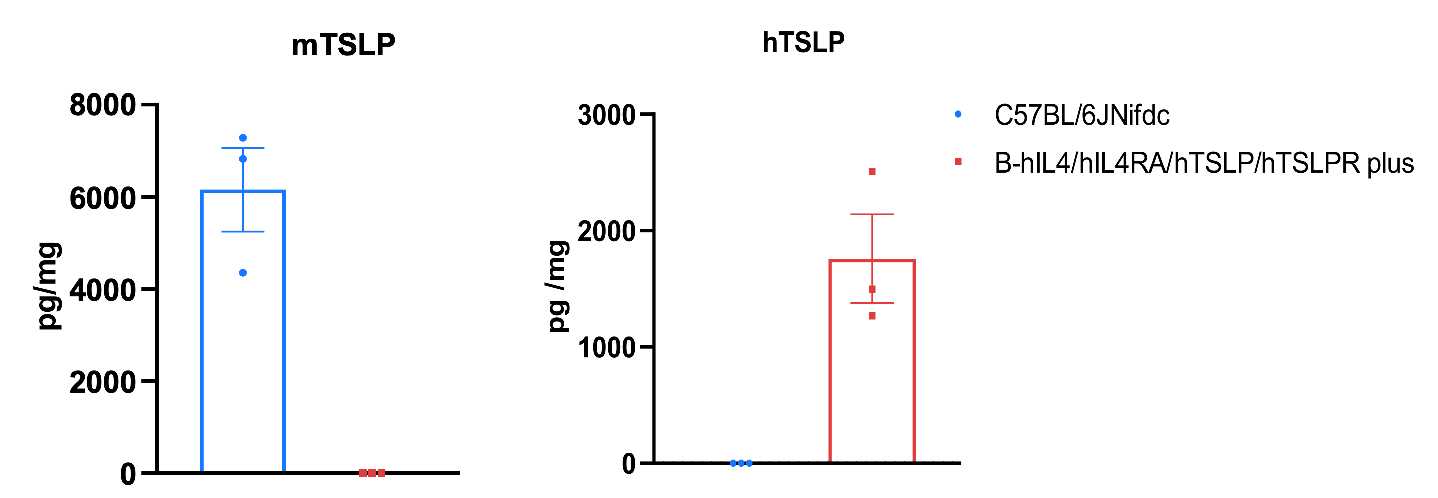
Protein expression analysis-TSLP
Strain specific TSLP expression analysis in wild-type C57BL/6JNifdc mice and homozygous B-hIL4/hIL4RA/hTSLP/hTSLPR plus mice by ELISA. Ear was collected from wild-type C57BL/6JNifdc mice and homozygous B-hIL4/hIL4RA/hTSLP/hTSLPR plus mice (male, n=3, 8-week-old) topically applied MC903 (0.2mmol/L, 0.2mL) in ear for 7 days. Expression level of mouse and human TSLP were analyzed by ELISA (mouse TSLP ELISA kit: BioLegend, 434107; human TSLP ELISA kit: BioLegend, 434207). Mouse TSLP was only detectable in wild-type C57BL/6JNifdc mice. Human TSLP was only detectable in homozygous B-hIL4/hIL4RA/hTSLP/hTSLPR plus mice. Values are expressed as mean ± SEM.
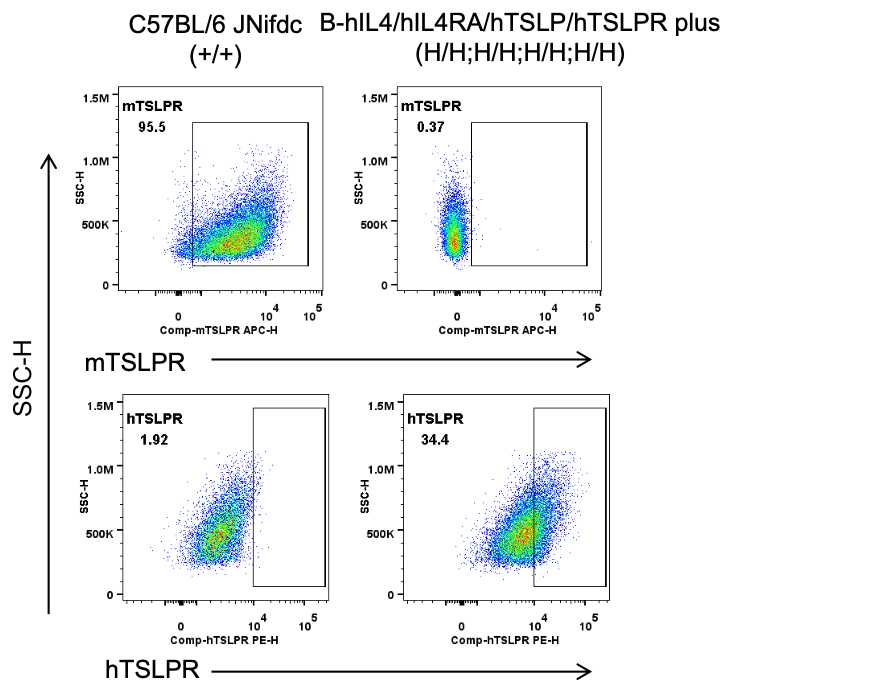
Protein expression analysis in bone marrow-TSLPR
Strain specific TSLPR expression analysis in wild-type C57BL/6JNifdc mice and homozygous humanized B-hIL4/hIL4RA/hTSLP/hTSLPR plus mice by flow cytometry. To generate DCs in vitro, bone marrow cells were isolated and induced with 200 ng/mL FLT3L (acrobiosystems, FLL-H5218) for 6 days. Purified DCs were stimulated with 1 μg/mL LPS(sigma, L4391). Protein expression was analyzed with anti-mouse TSLPR antibody (Biolegend, 151805) and anti-human TSLPR antibody (Biolegend, 322805) by flow cytometry. Mouse TSLPR was only detectable in wild-type C57BL/6JNifdc mice. Human TSLPR was only detectable in homozygous B-hIL4/hIL4RA/hTSLP/hTSLPR plus mice . Values are expressed as mean ± SEM.
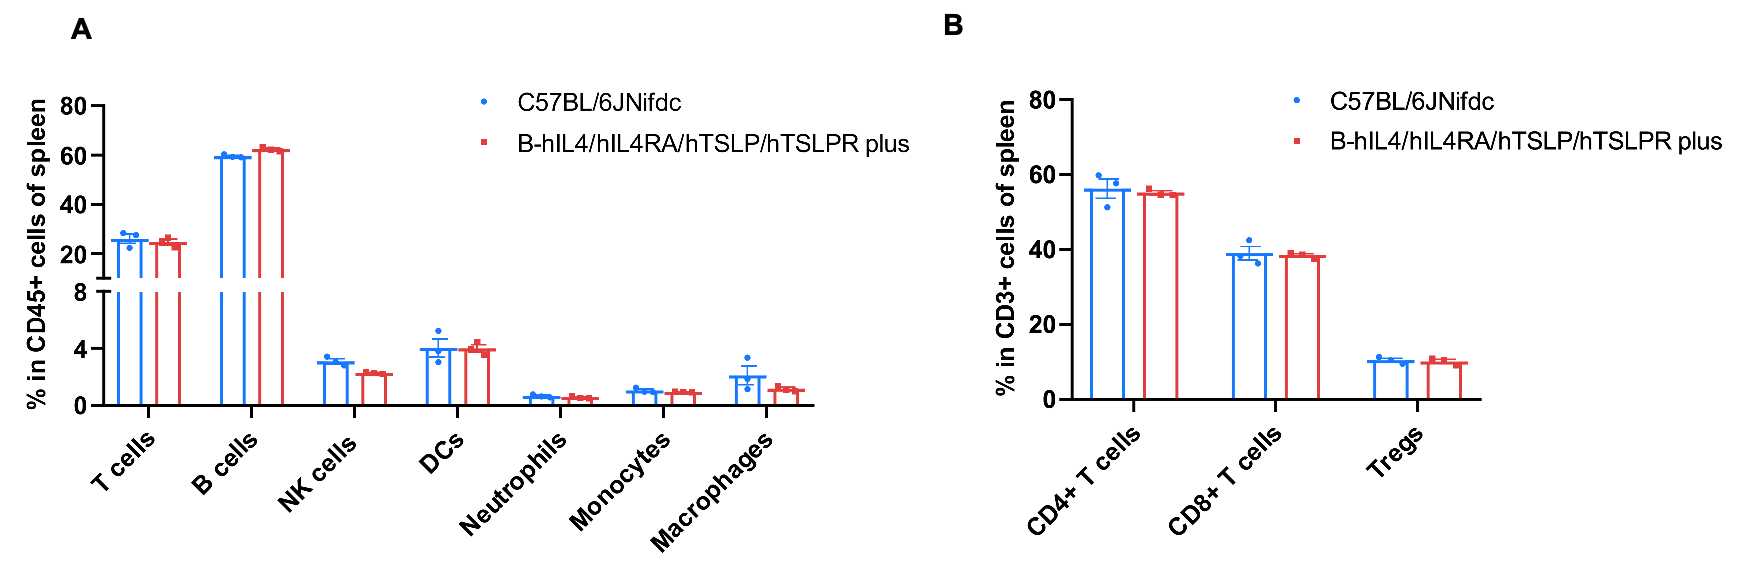
Frequency of leukocyte subpopulations in spleen
Frequency of leukocyte subpopulations in spleen by flow cytometry. Splenocytes were isolated from wild-type C57BL/6JNifdc mice (male, n=3, 8-week-old) and homozygous B-hIL4/hIL4RA/hTSLP/hTSLPR plus mice(male, n=3, 8-week-old). A. Flow cytometry analysis of the splenocytes was performed to assess the frequency of leukocyte subpopulations. B. Frequency of T cell subpopulations. Percentages of T cells, B cells, NK cells, dendritic cells,neutrophils, monocytes, macrophages, CD4+ T cells, CD8+ T cells and Tregs in B-hIL4/hIL4RA/hTSLP/hTSLPR plus mice were similar to those in C57BL/6JNifdc mice. Values are expressed as mean ± SEM. Significance was determined by two-way ANOVA test. *P < 0.05, **P < 0.01, ***p < 0.001.
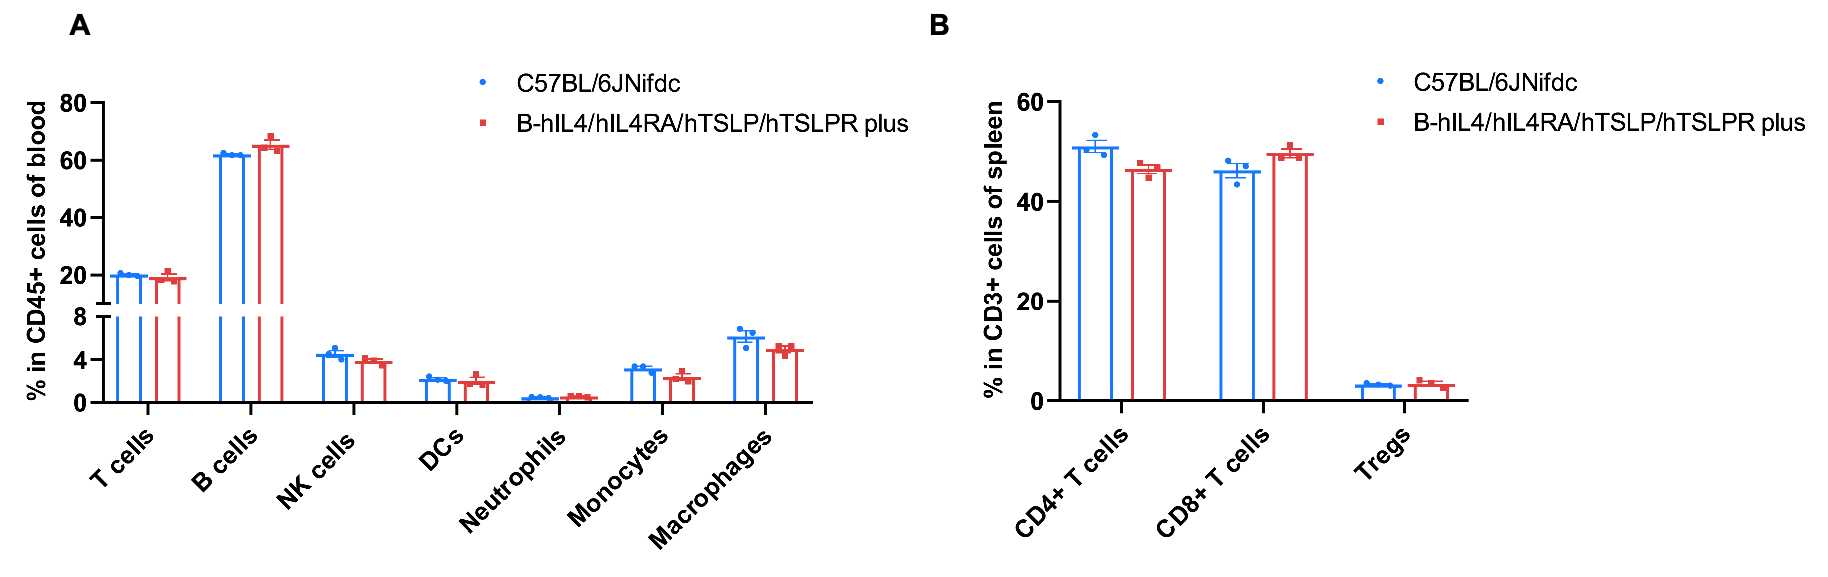
Frequency of leukocyte subpopulations in blood
Frequency of leukocyte subpopulations in blood by flow cytometry. Blood cells were isolated from wild-type C57BL/6JNifdc mice (male, n=3, 8-week-old) and homozygous B-hIL4/hIL4RA/hTSLP/hTSLPR plus mice(male, n=3, 8-week-old). A. Flow cytometry analysis of the blood cells was performed to assess the frequency of leukocyte subpopulations. B. Frequency of T cell subpopulations. Percentages of T cells, B cells, NK cells, dendritic cells, neutrophils, monocytes, macrophages, CD4+ T cells, CD8+ T cells and Tregs in B-hIL4/hIL4RA/hTSLP/hTSLPR plus mice were similar to those in C57BL/6JNifdc mice. Values are expressed as mean ± SEM. Significance was determined by two-way ANOVA test. *P < 0.05, **P < 0.01, ***p < 0.001.
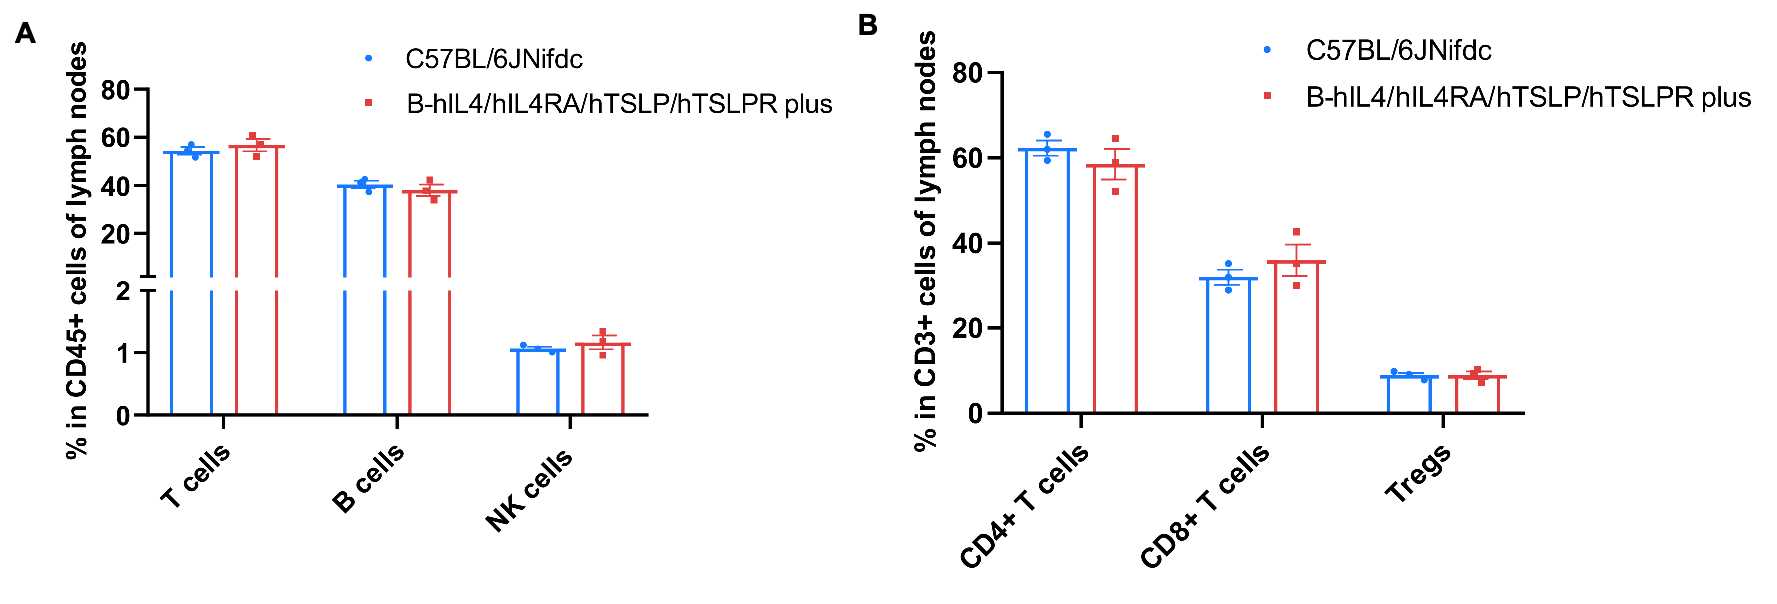
Frequency of leukocyte subpopulations in lymph nodes
Frequency of leukocyte subpopulations in lymph nodes by flow cytometry. Lymph nodes cells were isolated from wild-type C57BL/6JNifdc mice (male, n=3, 8-week-old) and homozygous B-hIL4/hIL4RA/hTSLP/hTSLPR plus mice(male, n=3, 8-week-old). A. Flow cytometry analysis of the lymph nodes cells was performed to assess the frequency of leukocyte subpopulations. B. Frequency of T cell subpopulations. Percentages of T cells, B cells, NK cells, CD4+ T cells, CD8+ T cells and Tregs in B-hIL4/hIL4RA/hTSLP/hTSLPR plus mice were similar to those in C57BL/6JNifdc mice. Values are expressed as mean ± SEM. Significance was determined by two-way ANOVA test. *P < 0.05, **P < 0.01, ***p < 0.001.
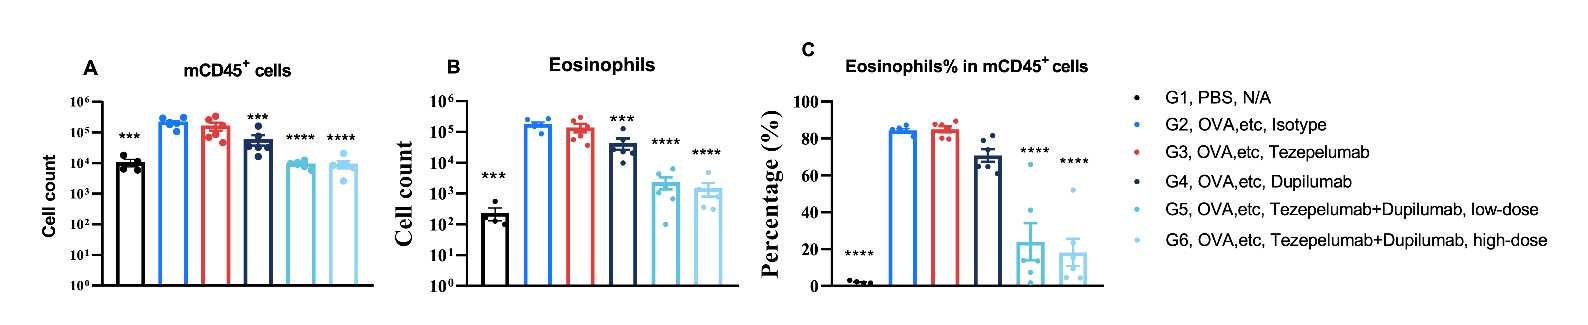
In vivo efficacy of Anti-human IL4RA antibody combined with anti-human TSLP antibody in asthma mouse model
Analysis of immune cells in BALF by flow cytometry. B-hIL4/hIL4RA/hTSLP/hTSLPR plus mice (female, 6-8 week-old) were OVA etc inducer asthma mouse model. Anti-human IL4RA antibody combined with anti-human TSLP antibody were intraperitoneal injection. Broncheoalveolar fluid (BALF) was collected at the end of the experiment to detect inflammatory cell infiltration in lung tissue. The results showed that the number and frequency of eosinophils induced in the treated modeling group (G2) was significantly higher than that in the un-modeling group (G1), while the number and frequencies of these cells in the treated groups (G4-G6) decreased significantly when compared with the treated modeling group (G2). Values are expressed as mean ± SEM. Significance was determined by one-way ANOVA test. *P < 0.05, **P < 0.01, ***P < 0.001. Note:The antibody is provided by RegeneCore Biotech Co., Ltd
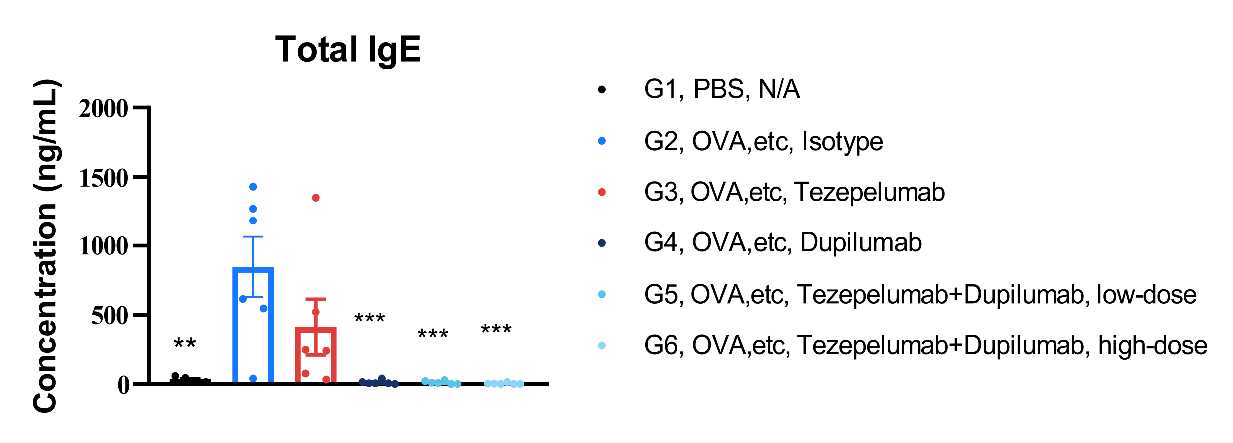
In vivo efficacy of Anti-human IL4RA antibody combined with anti-human TSLP antibody in asthma mouse model
Total IgE in serum was significantly reduced in the mouse asthma model treated with Anti-human IL4RA antibody combined with anti-human TSLP antibody . Serum was collected at the study endpoint. IgE levels was analyzed by ELISA. The result showed that the levels of total IgE treated groups (G4-G6) were significantly lower than treated modeling group (G2). Values are expressed as mean ± SEM. Significance was determined by one-way ANOVA test. *P < 0.05, **P < 0.01, ***P < 0.001.
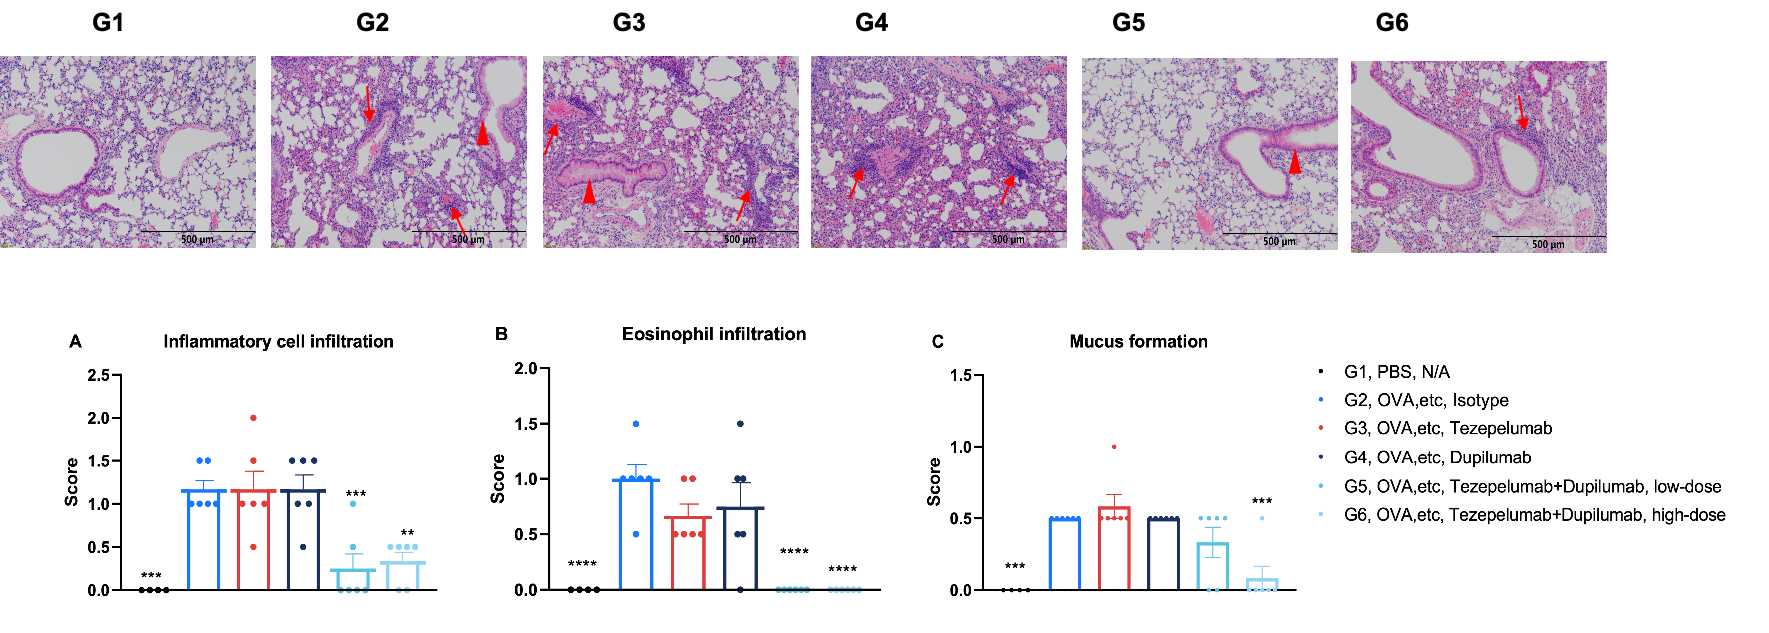
H&E staining of asthma model in B-hIL4/hIL4RA/hTSLP/hTSLPR plus mice Lung tissues were collected at the study endpoint and analyzed with H&E staining. The results showed that compared to the un-modeling group (G1), the modeling group (G2) showed significant increased in inflammatory infiltration and mucus secretion in lung tissue. The treated groups (G5-6) showed significant reduction in inflammatory infiltration and eosinophils in lung tissue. Red arrow: inflammatory cells; Red triangle : mucus. Values are expressed as mean ± SEM. Significance was determined by one-way ANOVA test. *P < 0.05, **P < 0.01, ***P < 0.001.
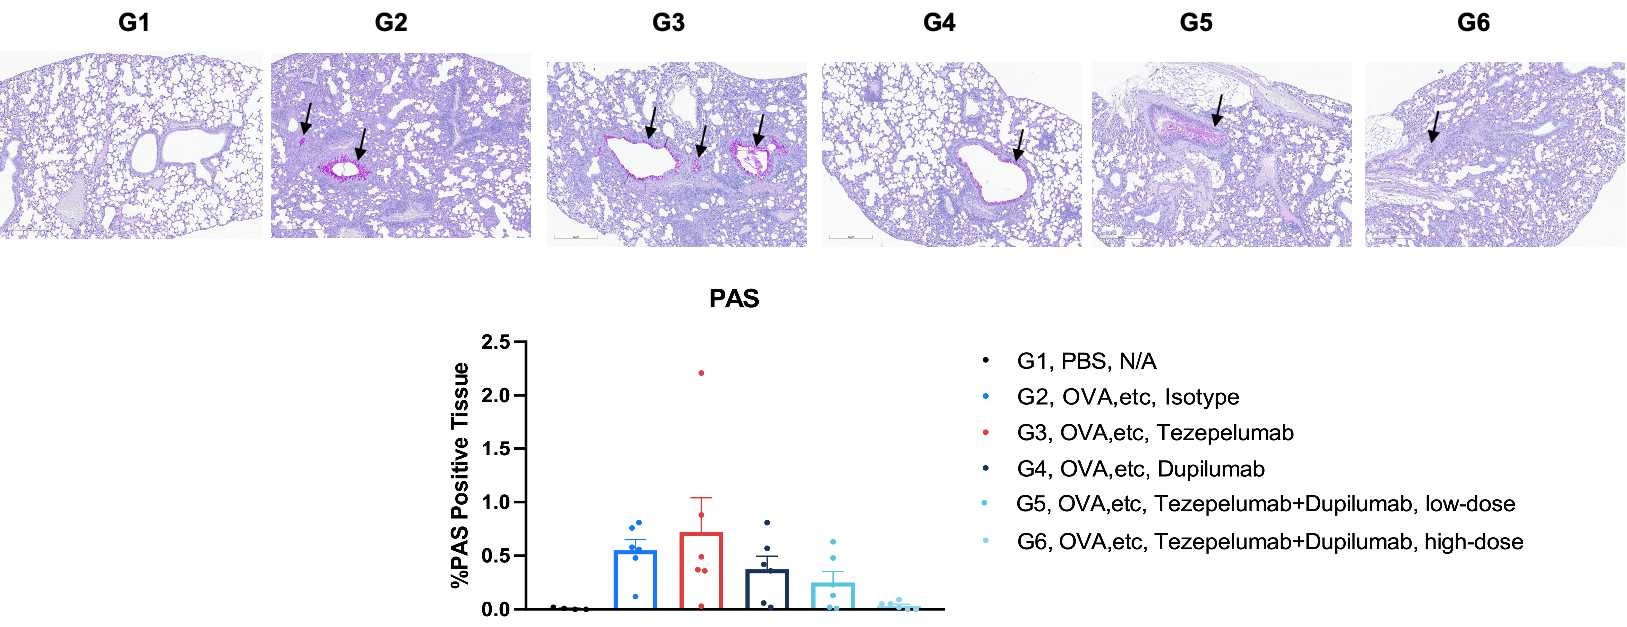
PAS staining of asthma model in B-hIL4/hIL4RA/hTSLP/hTSLPR plus mice Lung tissues were collected at the study endpoint and analyzed with PAS staining. The results showed that compared to the un-modeling group (G1), the modeling group (G2) showed a downward trend significant reduction in PAS positive signals in lung tissue. The treated groups (G5-6) showed a downward trend in PAS positive signals in lung tissue. Black arrows indicate PAS positive signals. Values are expressed as mean ± SEM.
In vivo efficacy of anti-human IL4RA antibody and anti-human TSLP antibody
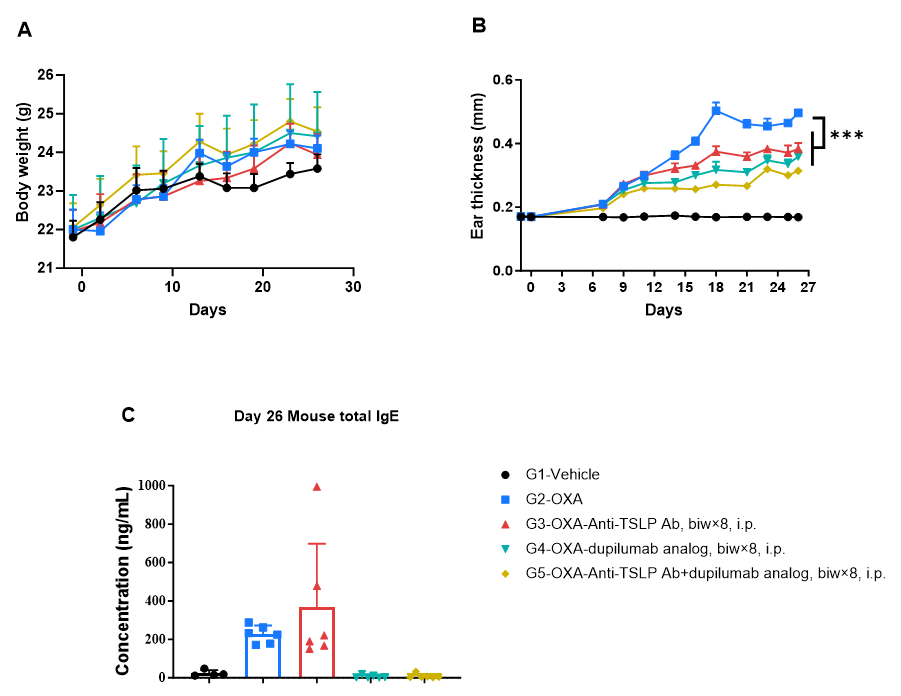
In vivo efficacy of anti-human IL4RA antibody and anti-human TSLP antibody with AD model
Efficacy of anti-human TSLP Ab and anti-human IL4RA antibody dupilumab analog in B-hIL4/hIL4RA/hTSLP/hTSLPR plus mice. (A&B) Ear thickness and body weight changes during the treatment. (C) Total IgE levels in serum. The results showed that compared to the untreated group (G2), the group of mice treated with anti-human TSLP Ab (provided by a client) or dupilumab analog (provided by a client) showed a significant reduction in ear thickness. Serum was collected at the study endpoint. IgE level was analyzed by ELISA. The results showed that the levels of total IgE in mice treated with dupilumab analog and combination with anti-human TSLP Ab and dupilumab analog were lower than that in untreated mice. Values were expressed as mean ± SEM. Significance was determined by two-way ANOVA test. *P < 0.05, **P < 0.01, ***P < 0.001. AD: Atopic dermatitis.

H&E staining of AD model in B-hIL4/hIL4RA/hTSLP/hTSLPR plus mice. Ear tissues were collected at the study endpoint and analyzed with H&E staining. The results showed that compared to the untreated group (G2), the group of mice treated with anti-human TSLP Ab or dupilumab analog showed a significant reduction in epidermal thickness and pathological score of ear skin. Values were expressed as mean ± SEM. Significance was determined by two-way ANOVA test. *P < 0.05, **P < 0.01, ***P < 0.001, ****P < 0.0001. AD: Atopic dermatitis.
B-hIL4/hIL4RA/hTSLP/hTSLPR plus mice: Growth Curve
Body weight of wild-type mice and B-hIL4/hIL4RA/hTSLP/hTSLPR plus mice. Wild-type C57BL/6JNifdc mice and B-hIL4/hIL4RA/hTSLP/hTSLPR plus mice (10 males and 10 females) were monitored for 8-12 weeks to assess overall health of the animals. Absolute body weight of wild-type mice and B-hIL4/hIL4RA/hTSLP/hTSLPR plus mice over time. The weight of B-hIL4/hIL4RA/hTSLP/hTSLPR plus mice revealed no abnormalities compared to wild-type controls.
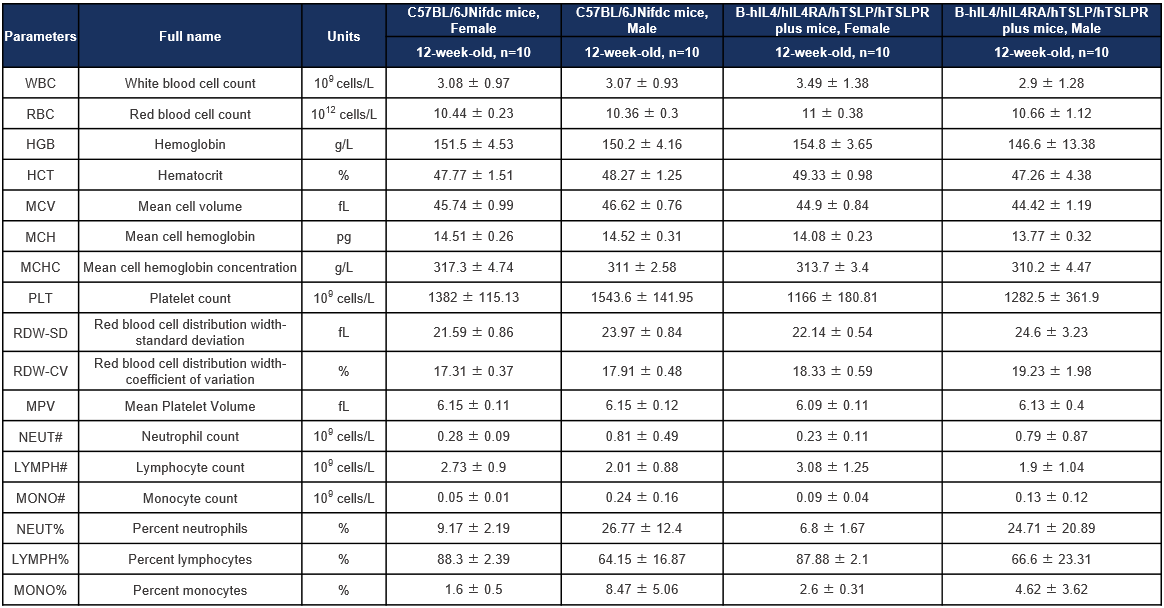
Hematology analysis
Complete blood count (CBC) of B-hIL4/hIL4RA/hTSLP/hTSLPR plus mice. Values are expressed as mean ± SD.
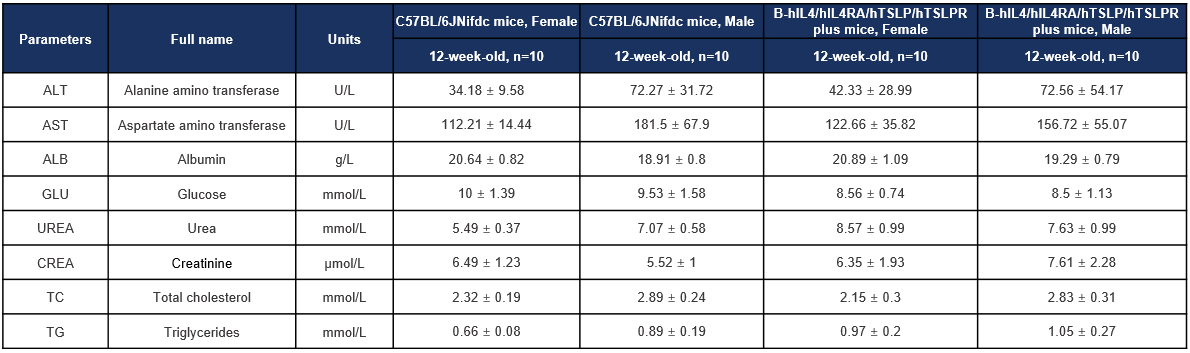
Biochemistry analysis
Biochemical test of B-hIL4/hIL4RA/hTSLP/hTSLPR plus mice. Values are expressed as mean ± SD.
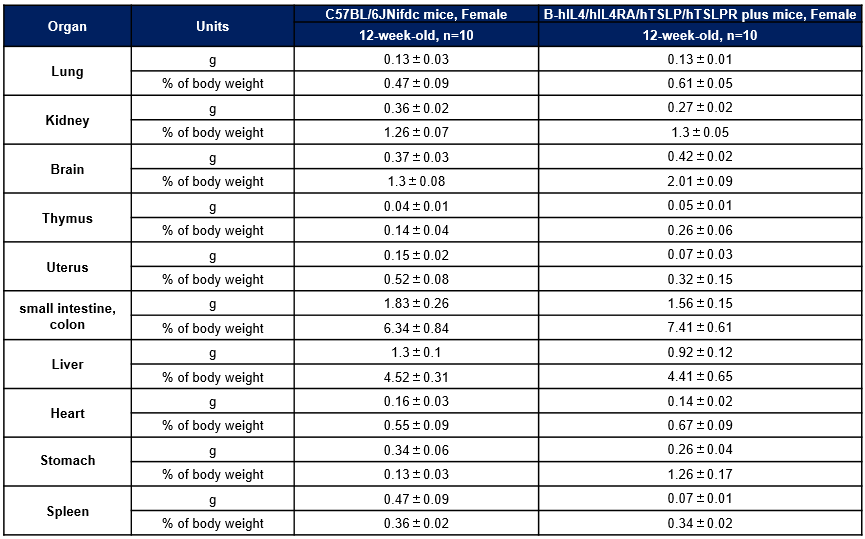
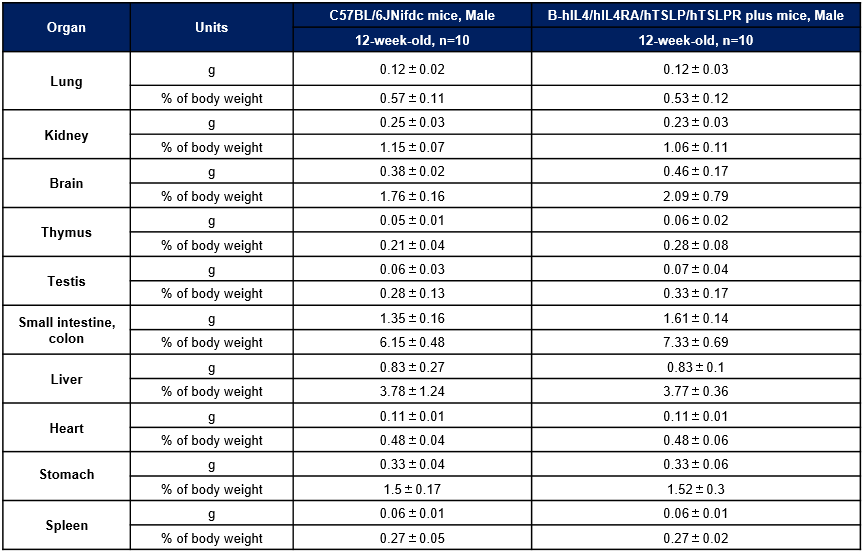
Organ weight
Average weight of the main organs of female C57BL/6JNifdc and B-hIL4/hIL4RA/hTSLP/hTSLPR plus mice.
Average weight of the main organs of male C57BL/6JNifdc and B-hIL4/hIL4RA/hTSLP/hTSLPR plus mice.
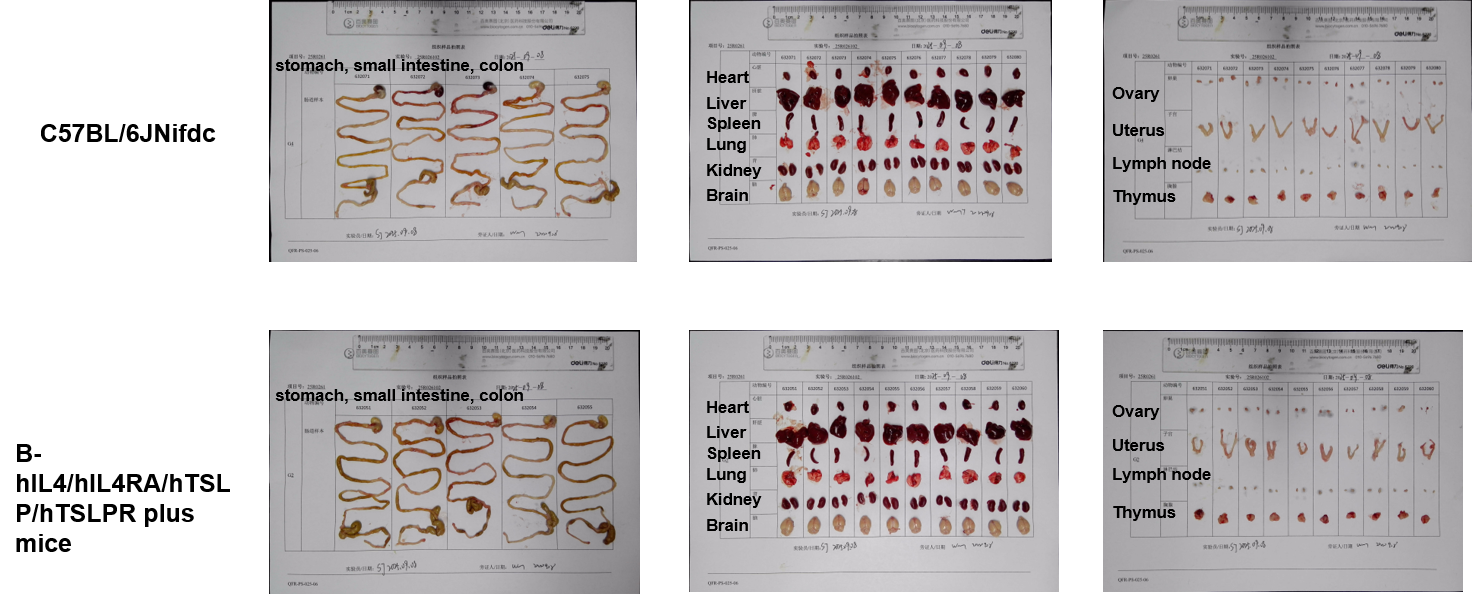
Gross anatomy of female C57BL/6JNifdc and B-hIL4/hIL4RA/hTSLP/hTSLPR plus mice
The organs of female C57BL/6JNifdc and B-hIL4/hIL4RA/hTSLP/hTSLPR plus mice (12-week-old, n=10).
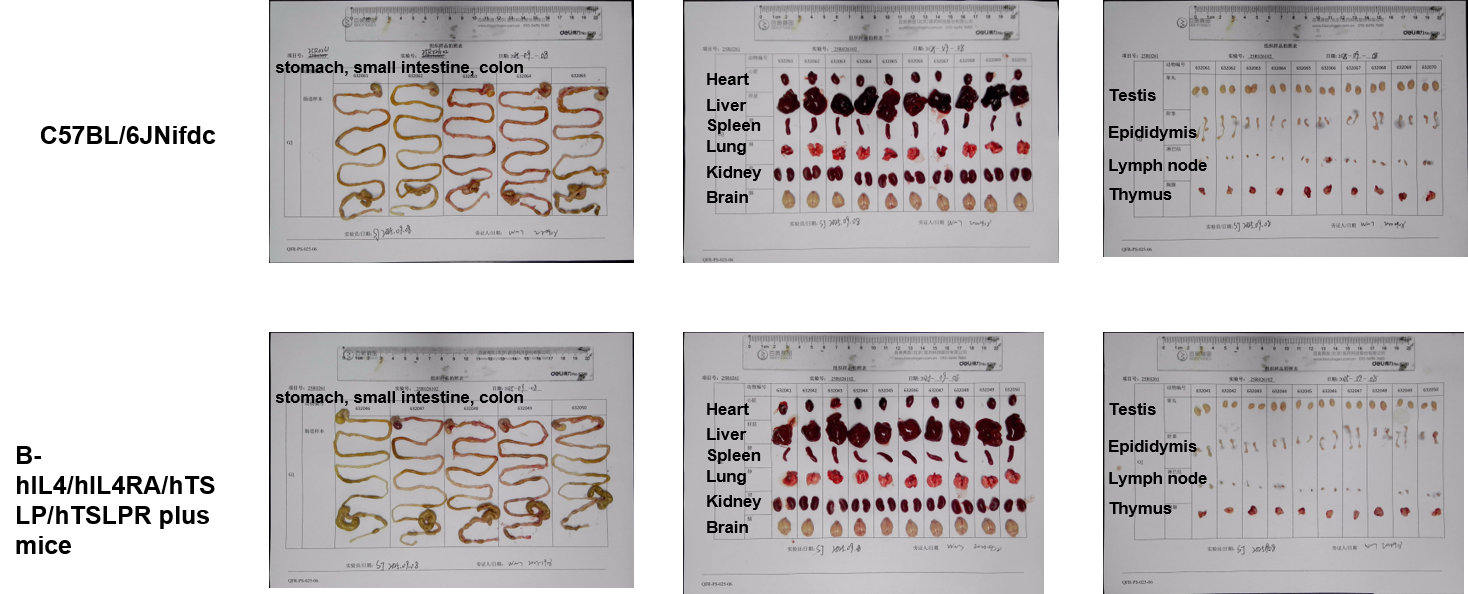
Gross anatomy of male C57BL/6JNifdc and B-hIL4/hIL4RA/hTSLP/hTSLPR plus mice
The organs of male C57BL/6JNifdc and B-hIL4/hIL4RA/hTSLP/hTSLPR plus mice (12-week-old, n=10).
Histopathological analysis
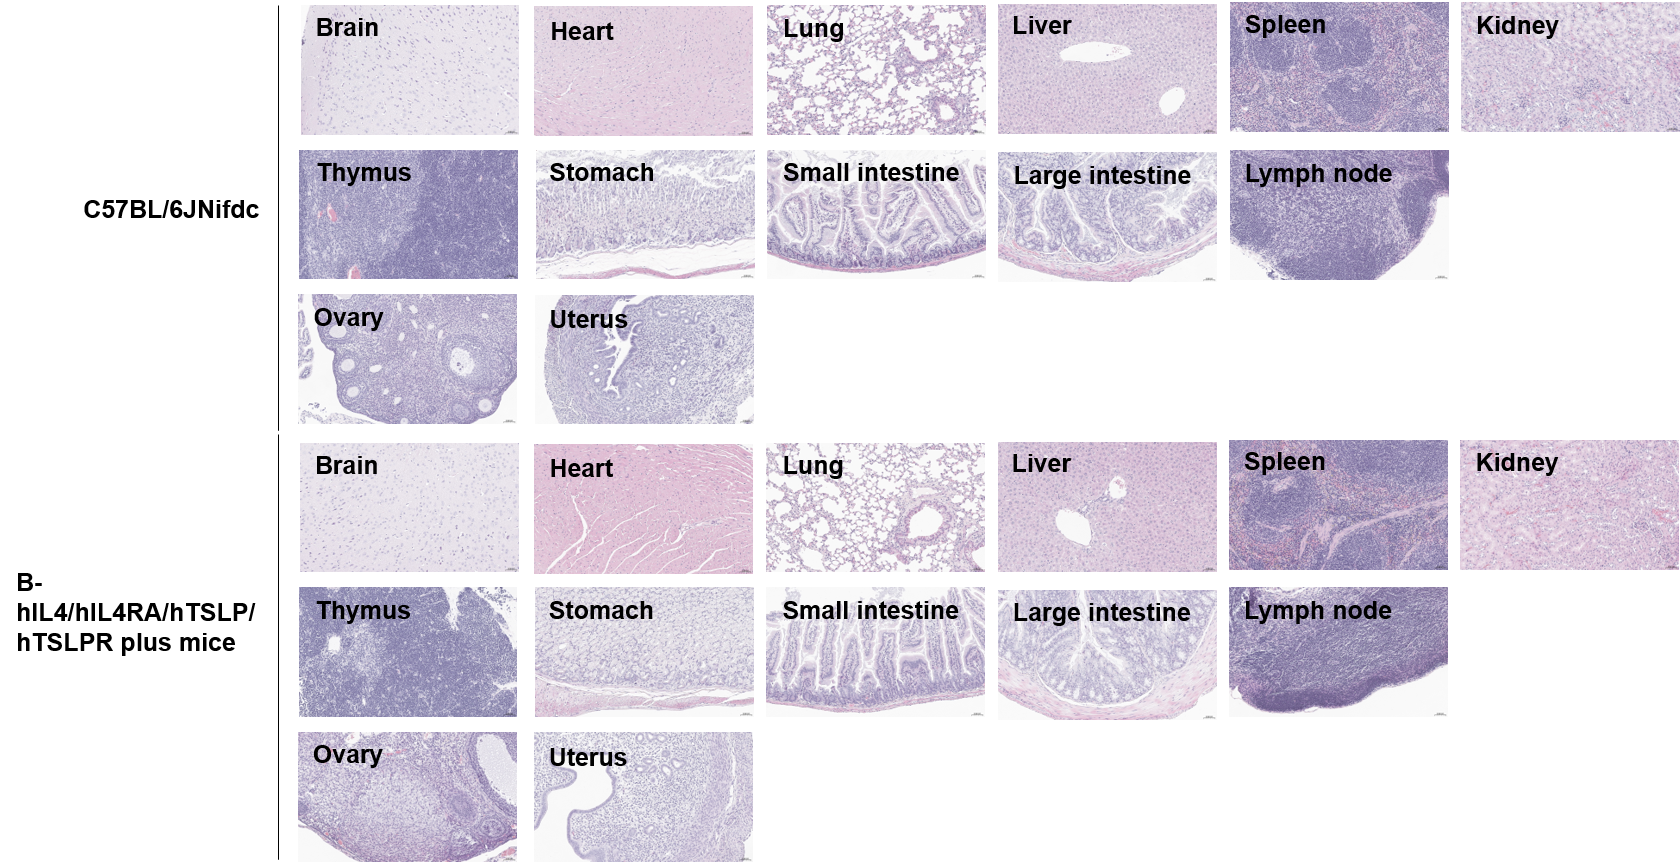
Histopathological analysis of organs in female C57BL/6JNifdc and B-hIL4/hIL4RA/hTSLP/hTSLPR plus mice. The main organs of C57BL/6JNifdc and B-hIL4/hIL4RA/hTSLP/hTSLPR plus mice were isolated at 12 weeks of age and analyzed with H&E staining (female, n=3). Results showed that no obvious abnormalities were found in all of the organs (heart, liver, spleen, lung, kidney, brain, stomach, small intestine, large intestine, thymus, lymph nodes, uterus, ovary).
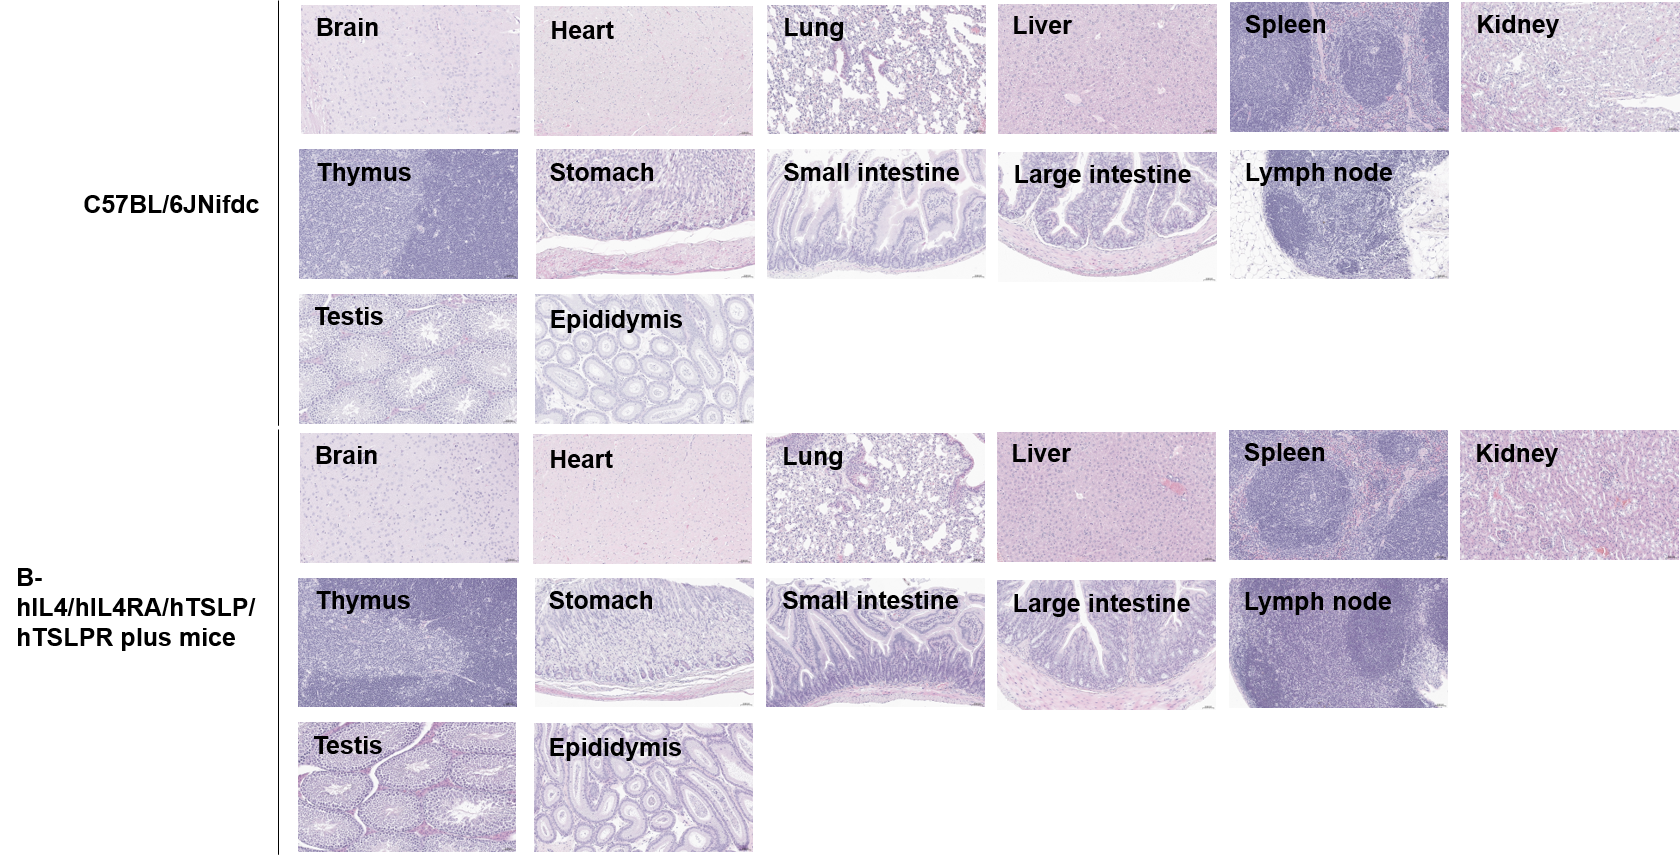
Histopathological analysis of organs in male C57BL/6JNifdc and B-hIL4/hIL4RA/hTSLP/hTSLPR plus mice. The main organs of C57BL/6JNifdc and B-hIL4/hIL4RA/hTSLP/hTSLPR plus mice were isolated at 12 weeks of age and analyzed with H&E staining (male, n=3). Results showed that no obvious abnormalities were found in all of the organs (heart, liver, spleen, lung, kidney, brain, stomach, small intestine, large intestine, thymus, lymph nodes, testis, epididymis).
* When publishing results obtained using this animal model, please acknowledge the source as follows: The animal model [B-hIL4/hIL4RA/hTSLP/hTSLPR plus mice] (Cat# 112846) was purchased from Biocytogen.