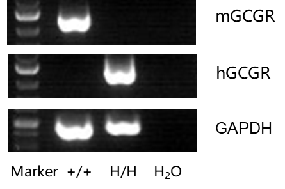
mRNA expression analysis
Strain specific analysis of GCGR gene expression in WT and B-hGCGR mice by RT-PCR. Mouse GCGR mRNA was detectable only in liver cells of wild type C57BL/6 mice (+/+). Human GCGR mRNA was detectable only in homozygous B-hGCGR mice (H/H) , but not in wild type C57BL/6 mice (+/+).
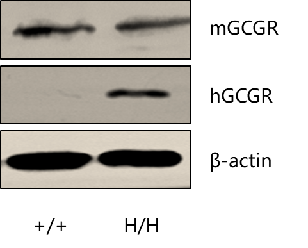
Protein expression analysis
Strain specific GCGR expression analysis in homozygous B-hGCGR mice by western blot. Kidney tissue was collected from wild type C57BL/6 mice (+/+) and homozygous B-hGCGR mice (H/H). Expression level of mouse and human GCGR were analyzed by western blot (anti-mouse/human GCGR antibody: MyBioSource, MBS7048237; anti-human GCGR antibody: Abclonal, A10617). Mouse GCGR was detectable in wild-type mice and homozygous B-hGCGR mice, as the antibody is crossly reactive with GCGR in human and mice. Human GCGR was exclusively detectable in homozygous B-hGCGR mice but not in wild-type C57BL/6 mice.
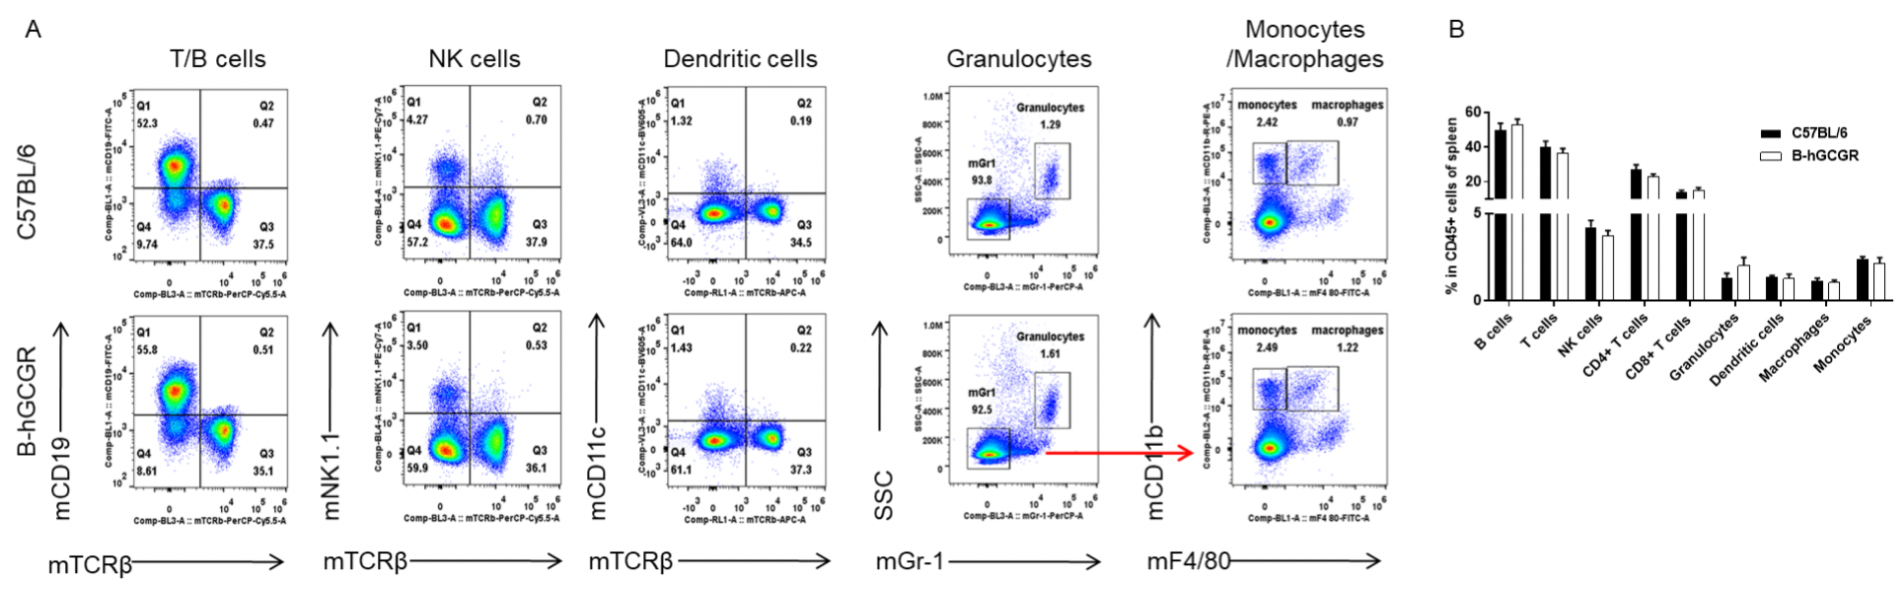
Analysis of leukocytes cell subpopulation in B-hGCGR mice
Analysis of spleen leukocyte subpopulations by FACS. Splenocytes were isolated from female C57BL/6 and B-hGCGR mice (n=4, 7-week-old). Flow cytometry analysis of the splenocytes was performed to assess leukocyte subpopulations. A. Representative FACS plots. Single live cells were gated for CD45+ population and used for further analysis as indicated here. B. Results of FACS analysis. Percent of T cells, B cells, NK cells, dendritic cells, granulocytes, monocytes and macrophages in homozygous B-hGCGR mice were similar to those in the C57BL/6 mice, demonstrating that introduction of hGCGR in place of its mouse counterpart does not change the overall development, differentiation or distribution of these cell types in spleen. Values are expressed as mean ± SEM.
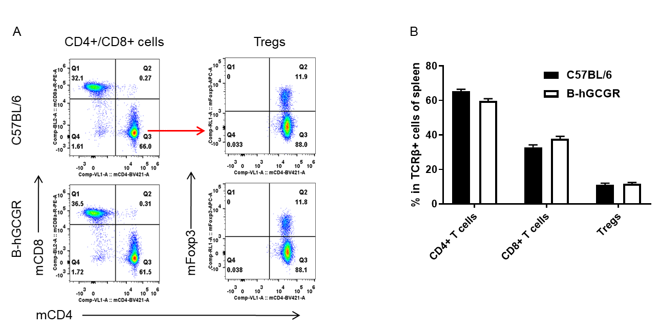
Analysis of T cell subpopulation in B-hGCGR mice
Analysis of spleen T cell subpopulations by FACS. Splenocytes were isolated from female C57BL/6 and B-hGCGR mice (n=4, 7-week-old). Flow cytometry analysis of the splenocytes was performed to assess leukocyte subpopulations. A. Representative FACS plots. Single live CD45+ T cells were gated for CD3+ T cell population and used for further analysis as indicated here. B. Results of FACS analysis. Percent of CD4+ T cells, CD8+ T cells and Tregs in homozygous B-hGCGR mice were similar to those in the C57BL/6 mice, demonstrating that introduction of hGCGR in place of its mouse counterpart does not change the overall development, differentiation or distribution of these T cell sub types in spleen. Values are expressed as mean ± SEM.
Analysis of leukocytes cell subpopulation in B-hGCGR mice
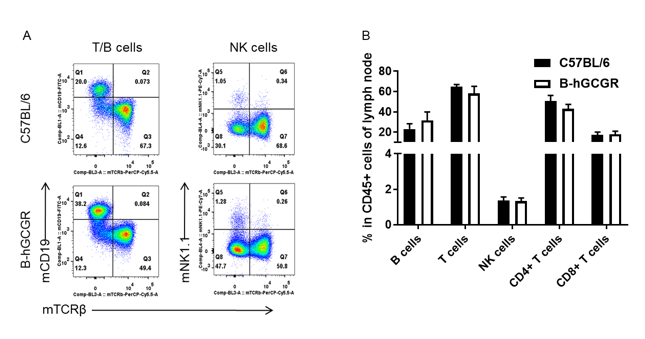
Analysis of subpopulation of leukocytes in lymph node by FACS. Lymph node was isolated from female C57BL/6 and B-hGCGR mice (n=4, 7-week-old). Flow cytometry analysis of the lymph node was performed to assess leukocyte subpopulations. A. Representative FACS plots. Single live CD45+ T cells were used for further analysis as indicated here. B. Results of FACS analysis. Percent of T cells, B cells, and NK cells in homozygous B-hGCGR mice were similar to those in the C57BL/6 mice, demonstrating that introduction of hGCGR in place of its mouse counterpart does not change the overall development, differentiation or distribution of these cell types in lymph node. Values are expressed as mean ± SEM.
Analysis of T cell subpopulation in B-hGCGR mice
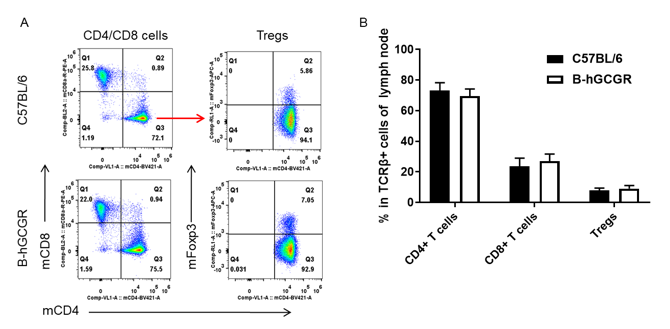
Analysis of subpopulation of T cells in lymph node by FACS. Lymph node was isolated from female C57BL/6 and B-hGCGR mice (n=4, 7-week-old). Flow cytometry analysis of the lymph node was performed to assess leukocyte subpopulations. A. Representative FACS plots. Single live CD45+ T cells were used for further analysis as indicated here. B. Results of FACS analysis. Percent of CD4+ T cells, CD8+ T cells and Tregs in homozygous B-hGCGR mice were similar to those in the C57BL/6 mice, demonstrating that introduction of hGCGR in place of its mouse counterpart does not change the overall development, differentiation or distribution of these T cell subtypes in lymph node. Values are expressed as mean ± SEM.
Analysis of leukocytes cell subpopulation in B-hGCGR mice
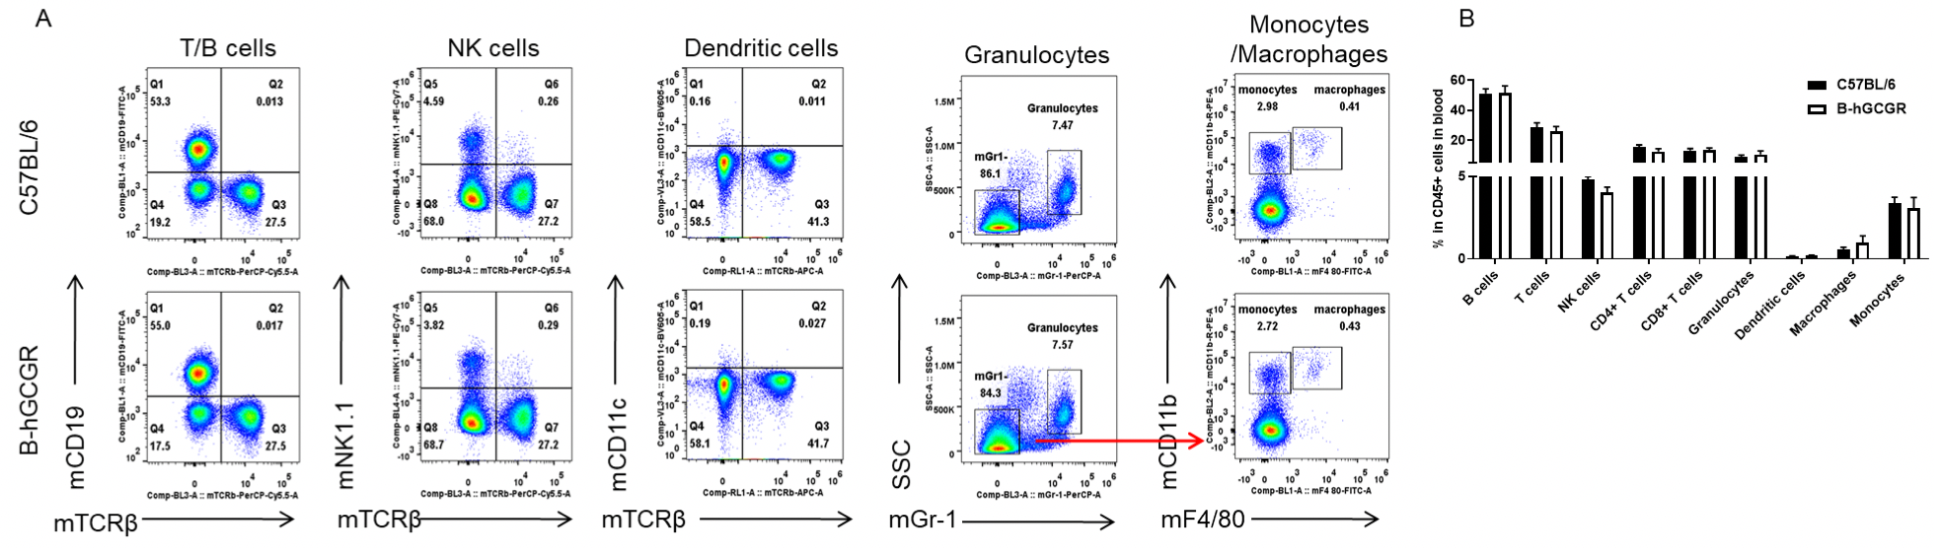
Analysis of blood leukocyte subpopulations by FACS. Blood cells were isolated from female C57BL/6 and B-hGCGR mice (n=4, 7-week-old). Flow cytometry analysis of blood cells was performed to assess leukocyte subpopulations. A. Representative FACS plots. Single live cells were gated for CD45+ population and used for further analysis as indicated here. B. Results of FACS analysis. Percent of T cells, B cells, NK cells, dendritic cells, granulocytes, monocytes and macrophages in homozygous B-hGCGR mice were similar to those in the C57BL/6 mice, demonstrating that introduction of hGCGR in place of its mouse counterpart does not change the overall development, differentiation or distribution of these cell types in blood. Values are expressed as mean ± SEM.
Analysis of T cell subpopulation in B-hGCGR mice
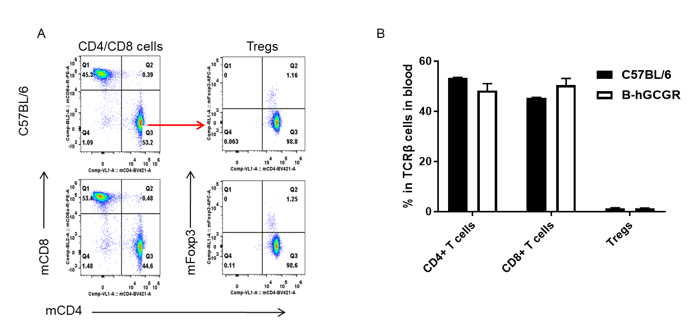
Analysis of subpopulation of T cells in blood by FACS. Blood cells were isolated from female C57BL/6 and B-hGCGR mice (n=4, 7-week-old). Flow cytometry analysis of blood cells was performed to assess leukocyte subpopulations. A. Representative FACS plots. Single live CD45+ T cells were used for further analysis as indicated here. B. Results of FACS analysis. Percent of CD4+ T cells, CD8+ T cells and Tregs in homozygous B-hGCGR mice were similar to those in the C57BL/6 mice, demonstrating that introduction of hGCGR in place of its mouse counterpart does not change the overall development, differentiation or distribution of these T cell subtypes in lymph node. Values are expressed as mean ± SEM.
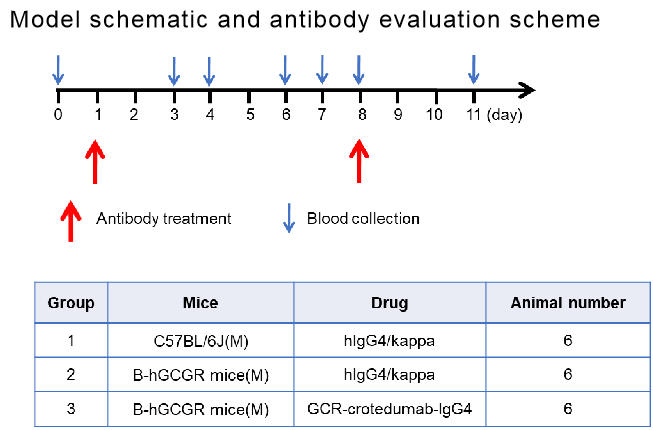
In vivo efficacy of anti-human GCGR antibody with B-hGCGR mice
Experimental schedule for in vivo efficacy of anti-human GCGR antibody. Anti-human GCGR antibody-crotedumab (in house) was administered by intraperitoneal injection once a week on days 1 to 8. Blood were collected for analysis of blood glucose, insulin, glucagon and lipid on the days showed in the schematic diagram and the table.
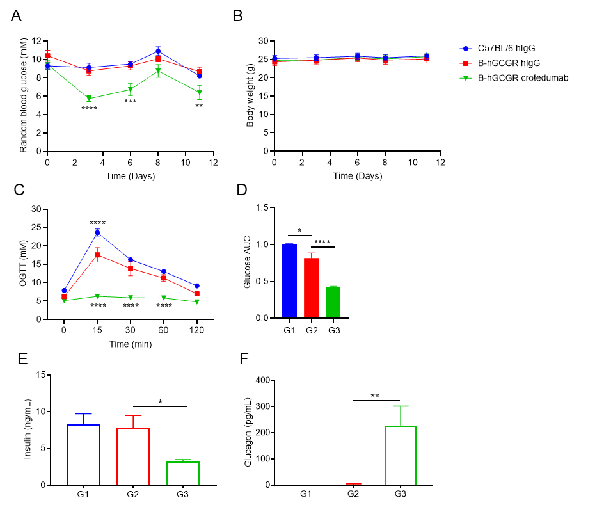
Anti-human GCGR antibody reduces blood glucose in male B-hGCGR mice. A. Random blood glucose from male mice before and at multiple time points after injection of crotedumab (in house) or isotype control antibody (n = 6). B. Body weights. C. IPGTT on day 4. D. Area under the curve for the IPGTT shown in C. Serum levels of (E) insulin, (F) glucagon on Day 7. Anti-GCGR antibody reduced the random blood glucose, fasting blood glucose and IPGTT compared to the isotype antibody in B-hGCGR mice. Serum levels of insulin was reduced slightly and glucagon level was significantly increased in the antibody treated group. All of the results in B-hGCGR mice were similar to those in the wild-type C57BL/6. Results indicated that the regulatory function on blood glucose in humanized B-hGCGR mice was similar to the wild-type C57BL/6. Anti-human GCGR antibody was efficacious in controlling blood glucose in B-hGCGR mice. Values are expressed as mean ± SEM. IPGTT, Intraperitoneal glucose tolerance test.
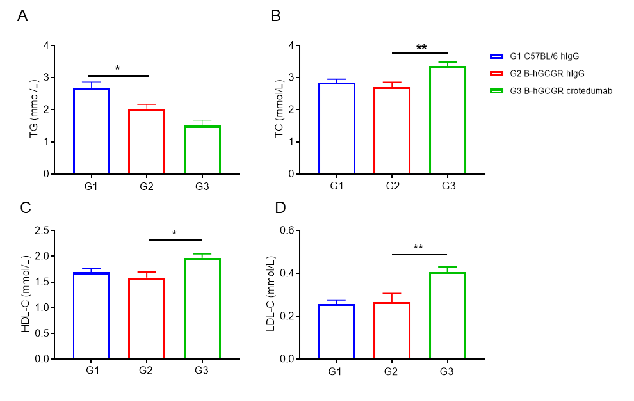
Anti-human GCGR antibody improved lipid metabolism in male B-hGCGR mice. Wild-type C57BL/6 and B-hGCGR mice were treated with crotedumab (in house) or isotype control antibody (n = 6). Blood were collected on Day 11 for triglycerides and cholesterol analysis. Serum levels of TG (A) and TC (B). HDL-C (C) and LDL-C (D) levels in serum. Serum levels of TG was reduced, while TC, HDL-C and LDL-C were increased in the anti-human GCGR antibody treated male mice group compared to the isotype control. All of the results in B-hGCGR mice were similar to those in the wild-type C57BL/6. Results indicated that lipid metabolism in humanized B-hGCGR mice was similar to the wild-type C57BL/6. Results indicated that anti-human GCGR antibody was efficacious in controlling blood lipid in male B-hGCGR mice. Values are expressed as mean ± SEM. TG, triglycerides; TC, total cholesterol; HDL-C, high density lipoprotein cholesterol; LDL-C, low density lipoprotein cholesterol.In vivo efficacy of anti-human GCGR antibody with diet-induced obese (DIO) B-hGCGR mice
In vivo efficacy of anti-human GCGR antibody with diet-induced obese (DIO) B-hGCGR mice
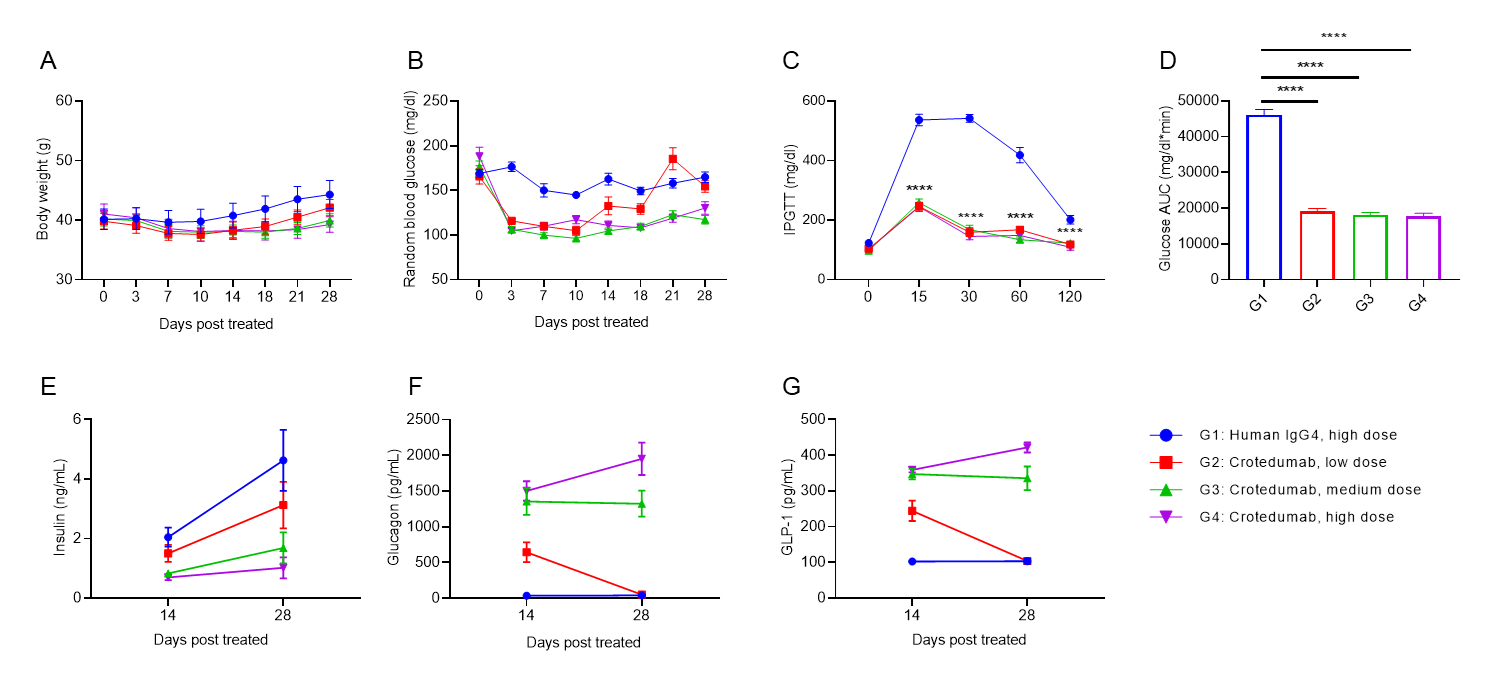
Anti-human GCGR antibody reduces blood glucose in DIO B-hGCGR mice. Male B-hGCGR mice were fed with high-fat diet throughout the study. Anti-human GCGR antibody crotedumab (in house) was administered by intraperitoneal injection on day 0 after diet-induced. Body weights, levels of blood glucose and hormones were measured periodically (n = 10). A. Body weights. B. Random blood glucose from male mice before and at multiple time points after injection of crotedumab (in house) or isotype antibody. C. IPGTT on day 5. D. Area under the curve for the IPGTT shown in C. Serum levels of (E) insulin, (F) glucagon, (G) GLP-1 on Day 14 and Day 28. Anti-GCGR antibody significantly reduced body weight, random blood glucose and IPGTT compared to the isotype control in male DIO B-hGCGR mice. Serum levels of insulin, glucagon and GLP-1 were changed with dose-dependent. Results indicated that anti-human GCGR antibody was efficacious in controlling body weight and blood glucose in B-hGCGR mice. Values are expressed as mean ± SEM. IPGTT, Intraperitoneal glucose tolerance test.
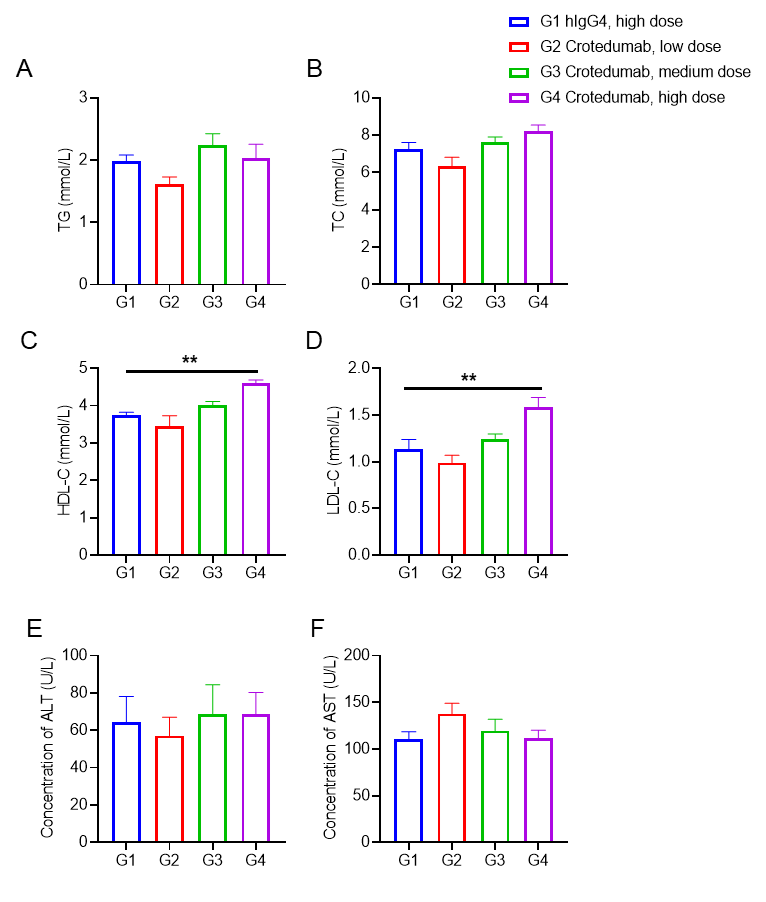
Single doses of anti-human GCGR antibody treatment increased LDL-C and HDL-C in male DIO B-hGCGR mice. Male B-hGCGR mice were fed with high-fat diet throughout the study. Anti-human GCGR antibody crotedumab (in house) was administered by intraperitoneal injection on day 0 after diet-induced for 95 days (n = 10). Blood were collected on Day 28 for detecting the serum levels of TG (A), TC (B), HDL-C (C), LDL-C (D), ALT (E), AST (F). Serum levels of TG, ALT and AST in the three treatment groups were similar to that in the isotype group, while serum levels of HDL-C and LDL-C were significantly increased in the high dose treatment group compared to the isotype control. TC levels were also increased with dose-dependent, although with no significant difference. Values are expressed as mean ± SEM. TG, triglycerides; TC, total cholesterol; HDL-C, high density lipoprotein cholesterol; LDL-C, low density lipoprotein cholesterol. ALT, alanine transaminase; AST, aspartate aminotransferase.
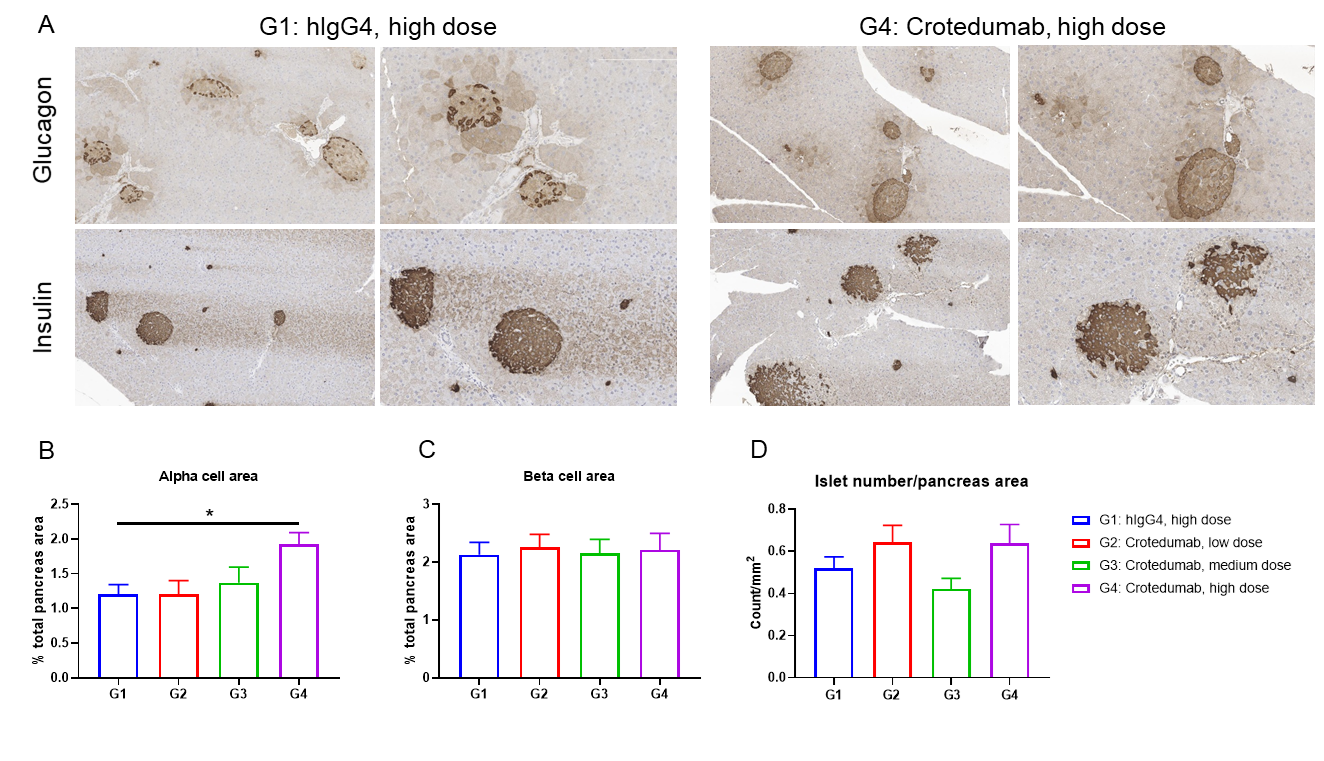
Single doses of anti-human GCGR antibody treatment induced α-cell hyperplasia in male DIO B-hGCGR mice. Male B-hGCGR mice were fed with high-fat diet throughout the study. Anti-human GCGR antibody crotedumab (in house) was administered by intraperitoneal injection on day 0 after diet-induced for 95 days (n = 10). Pancreases were collected on Day 28 for morphometric analysis. (A) Glucagon and insulin immunohistochemistry of representative pancreas sections. α cell area (B) and β cell area (C) measured in (A). (D) Islet number per pancreas section. Results showed that α cell area was increased with dose dependent. Anti-human GCGR antibody had no effect on β cell area or islet number per pancreas area. Values are expressed as mean ± SEM.
* When publishing results obtained using this animal model, please acknowledge the source as follows: The animal model [B-hGCGR mice] (Cat# 110105) was purchased from Biocytogen.