Targeting strategy
Gene targeting strategy for B-hCD200/hCD200R mice.
The exons 1-5 of mouse Cd200 gene that encode signal peptide, extracellular domain, transmembrane domain and cytoplasmic region are replaced by human counterparts in B-hCD200/hCD200R mice. The promoter, 5’UTR and 3’UTR region of the mouse gene are retained. The human CD200 expression is driven by endogenous mouse Cd200 promoter, while mouse Cd200 gene transcription and translation will be disrupted.
The exons 2-5 of mouse Cd200r1 gene that encode extracellular domain are replaced by human counterparts in B-hCD200/hCD200R mice. The genomic region of mouse Cd200r1 gene that encodes transmembrane domain and cytoplasmic portion is retained. The promoter, 5’UTR and 3’UTR region of the mouse gene are also retained. The chimeric CD200R1 expression is driven by endogenous mouse Cd200r1 promoter, while mouse Cd200r1 gene transcription and translation will be disrupted.
Protein expression analysis in spleen
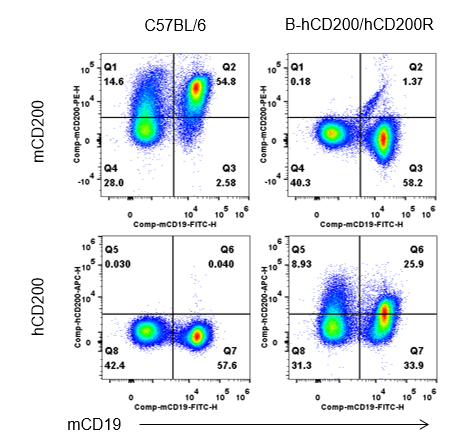
Strain specific CD200 expression analysis in wild-type C57BL/6 mice and homozygous humanized B-hCD200/hCD200R mice by flow cytometry. Splenocytes were collected from wild-type C57BL/6 mice and homozygous B-hCD200/hCD200R mice. Protein expression was analyzed with anti-mouse CD200 antibody (eBioscience™, 12-5200-82) and anti-human CD200 antibody (eBioscience™, 17-9200-41) by flow cytometry. Mouse CD200 was only detectable in wild-type C57BL/6 mice. Human CD200 was exclusively detectable in homozygous B-hCD200/hCD200R mice, but not in wild-type C57BL/6 mice.
Protein expression analysis on peritoneal exudative macrophages
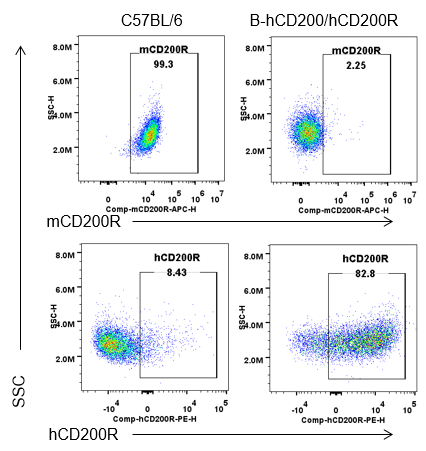
Strain specific CD200R expression analysis in wild-type C57BL/6 mice and homozygous humanized B-hCD200/hCD200R mice by flow cytometry. Peritoneal exudative macrophages were collected from wild-type C57BL/6 mice and homozygous B-hCD200/hCD200R mice. Protein expression was analyzed with anti-mouse CD200R antibody (Biolegend, 123915) and anti-human CD200R antibody (Biolegend, 329305) by flow cytometry. Mouse CD200R was only detectable in wild-type C57BL/6 mice. Human CD200R was exclusively detectable in homozygous B-hCD200/hCD200R mice, but not in wild-type C57BL/6 mice.
Frequency of leukocyte subpopulations in spleen
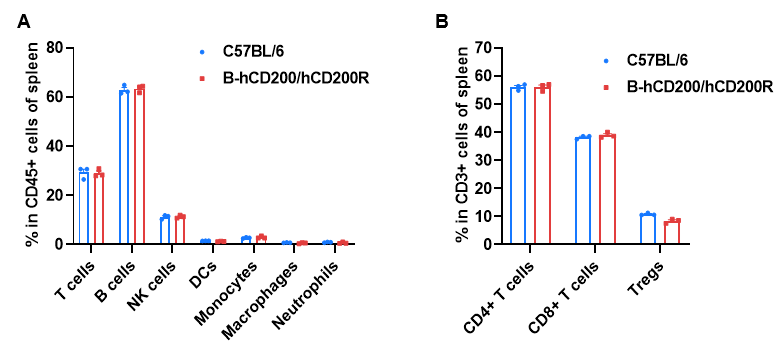
Frequency of leukocyte subpopulations in spleen by flow cytometry. Splenocytes were isolated from wild-type C57BL/6 mice and homozygous B-hCD200/hCD200R mice (female, 8-week-old, n=3). A. Flow cytometry analysis of the splenocytes was performed to assess the frequency of leukocyte subpopulations. B. Frequency of T cell subpopulations. Percentages of T cells, B cells, NK cells, DCs, monocytes, macrophages, neutrophils, CD4+ T cells, CD8+ T cells and Tregs in B-hCD200/hCD200R mice were similar to those in C57BL/6 mice, demonstrating that humanization of CD200 and CD200R do not change the frequency or distribution of these cell types in spleen. Values are expressed as mean ± SEM.
Frequency of leukocyte subpopulations in lymph node
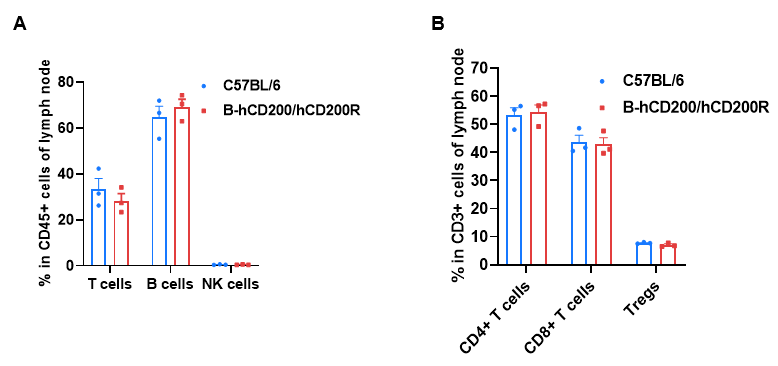
Frequency of leukocyte subpopulations in lymph node by flow cytometry. Leukocytes were isolated from wild-type C57BL/6 mice and homozygous B-hCD200/hCD200R mice (female, 8-week-old, n=3). A. Flow cytometry analysis of the leukocytes was performed to assess the frequency of leukocyte subpopulations. B. Frequency of T cell subpopulations. Percentages of T cells, B cells, NK cells, CD4+ T cells, CD8+ T cells and Tregs in B-hCD200/hCD200R mice were similar to those in C57BL/6 mice, demonstrating that humanization of CD200 and CD200R do not change the frequency or distribution of these cell types in lymph node. Values are expressed as mean ± SEM.
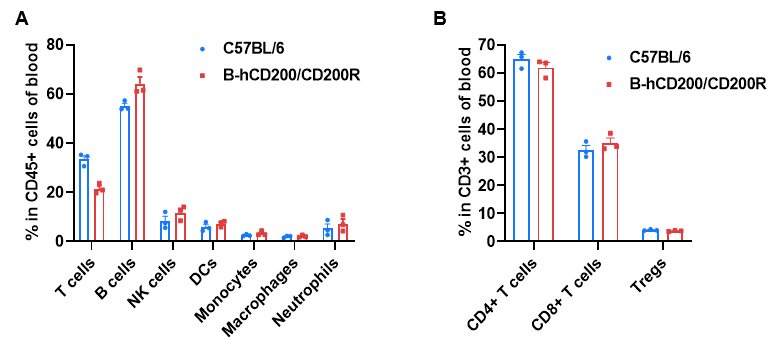
Frequency of leukocyte subpopulations in blood
Frequency of leukocyte subpopulations in blood by flow cytometry. Blood cells were isolated from wild-type C57BL/6 mice and homozygous B-hCD200/hCD200R mice (female, 8-week-old, n=3). A. Flow cytometry analysis of the blood cells was performed to assess the frequency of leukocyte subpopulations. B. Frequency of T cell subpopulations. Percentages of T cells, B cells, NK cells, DCs, monocytes, macrophages, neutrophils, CD4+ T cells, CD8+ T cells and Tregs in B-hCD200/hCD200R mice were similar to those in C57BL/6 mice, demonstrating that humanization of CD200 and CD200R do not change the frequency or distribution of these cell types in blood. Values are expressed as mean ± SEM.
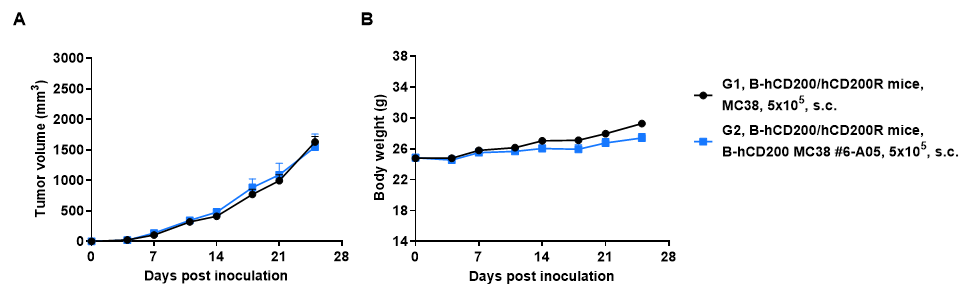
Tumor growth curve & body weight changes
Subcutaneous tumor growth of B-hCD200 MC38 cells. B-hCD200 MC38 cells (5x10⁵) and wild-type MC38 cells (5x10⁵) were subcutaneously implanted into heterozygous B-hCD200/hCD200R mice (female, 7-week-old, n=6). Tumor volume and body weight were measured twice a week. (A) Average tumor volume. (B) Body weight. Volume was expressed in mm3 using the formula: V=0.5 X long diameter X short diameter2. Results indicate that B-hCD200 MC38 cells were able to establish tumors in vivo and can be used for efficacy studies. Values are expressed as mean ± SEM.
Note: B-hCD200 MC38 cells only successfully formed tumors in B-hCD200/hCD200R mice, but did not form tumors in wild-type mice (data not shared).
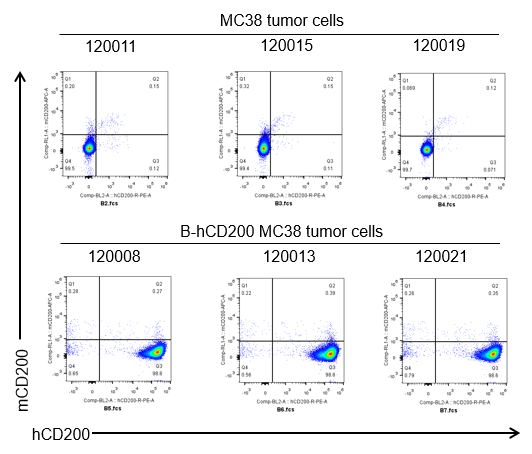
Protein expression analysis of tumor tissue
CD200 expression evaluated on B-hCD200 MC38 tumor cells by flow cytometry. B-hCD200 MC38 cells were subcutaneously transplanted into heterozygous B-hCD200/hCD200R mice (n=6). Upon conclusion of the experiment, tumor cells were harvested and analyzed with anti-mouse CD200 antibody (Biolegend, 123810) and anti-human CD200 antibody (Biolegend, 329206) by flow cytometry. As shown, human CD200 was highly expressed on the surface of tumor cells. Therefore, B-hCD200 MC38 cells can be used for in vivo efficacy studies evaluating novel CD200 therapeutics.
Note: B-hCD200 MC38 cells only successfully formed tumors in B-hCD200/hCD200R mice, but did not form tumors in wild-type mice (data not shared).
In vivo efficacy of anti-hCD200 antibody combined with anti-mPD-1 antibody
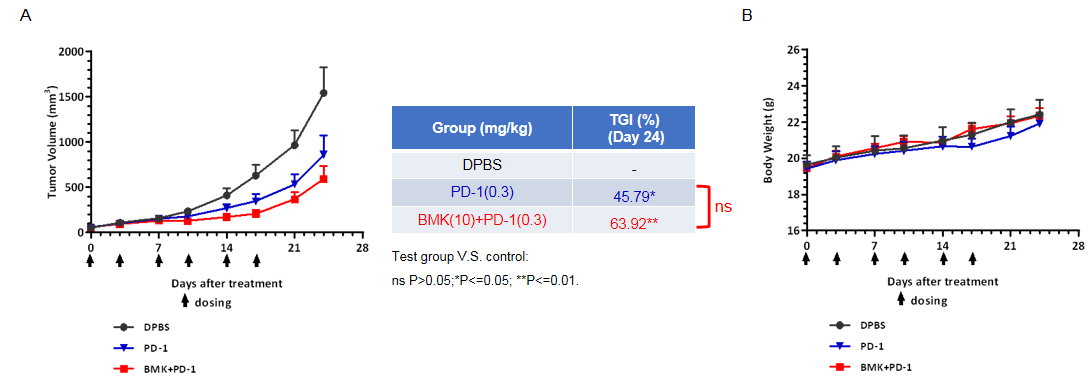
In vivo antitumor activity of anti-human CD200 (hCD200) antibody when used in combination with anti-mouse PD-1 (mPD-1) antibody.
Murine colon cancer B-hCD200 MC38 cells (5x10⁵) were subcutaneously implanted into homozygous B-hCD200/hCD200R mice (female, 6-8-week-old, n=6). Mice were grouped when tumor volume reached approximately 100 mm3, at which point they were intraperitoneally injected with DPBS, anti-mPD-1 antibody alone or in combination with anti-hCD200 antibody BMK (provided by a client). (A) Anti-hCD200 antibody combination with anti-mPD-1 antibody inhibited B-hCD200 MC38 tumor growth in B-hCD200/hCD200R mice. (B) Body weight changes during treatment. As shown in panel A, anti-hCD200 antibody combination with anti-mPD-1 antibody was efficacious in controlling tumor growth in B-hCD200/hCD200R mice, demonstrating that the B-hCD200/hCD200R mice provide a powerful preclinical model for in vivo evaluation of anti-human CD200 antibodies. Values are expressed as mean ± SEM. Significance was determined by two-way ANOVA test. ns P>0.05;*P<=0.05; **P<=0.01.
Note:This data comes from a client.
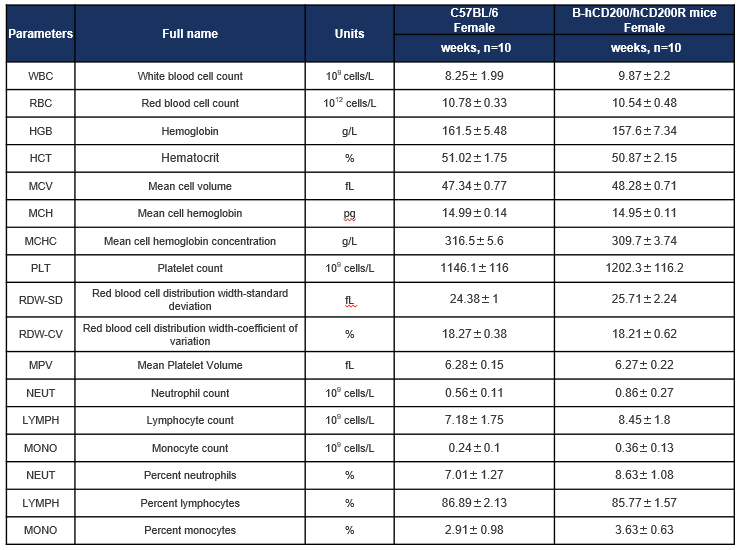
Hematology analysis
Complete blood count (CBC) of B-hCD200/hCD200R mice. Values are expressed as mean ± SD.
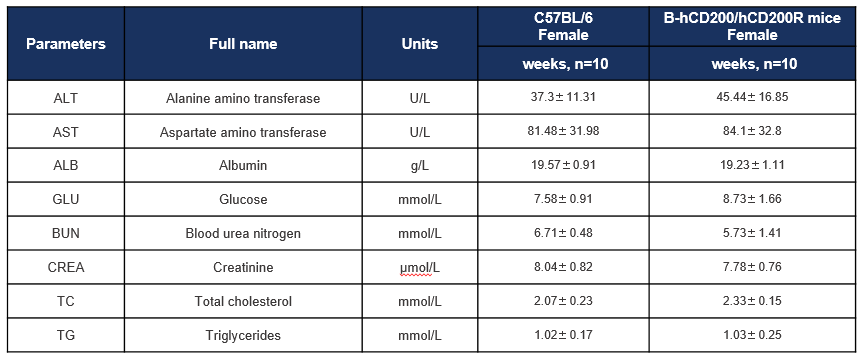
Biochemistry analysis
Biochemical test of B-hCD200/hCD200R mice. Values are expressed as mean ± SD.
Functional Analysis
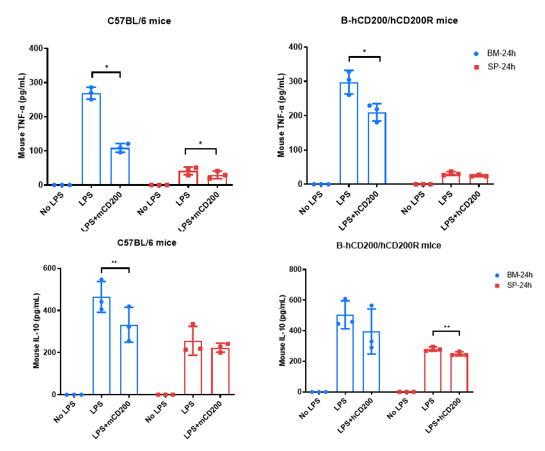
Strain specific TNF-α and IL-10 expression analysis in wild-type C57BL/6 mice and homozygous humanized B-hCD200/hCD200R mice by ELISA. Cell supernatants was collected from spleen and bone marrow of wild-type C57BL/6 mice (+/+) (male, n=3, 7-week-old) and homozygous B-hCD200/hCD200R mice (male, n=3, 7-week-old) stimulated with 5 mg/mL LPS for 24hrs. Expression level of mouse TNF-a and IL-10 were analyzed by ELISA (anti-mouse TNF-α ELISA kit, Biolegend, 430904; anti-mouse IL-10 ELISA kit: Biolegend, 431414). The level of mouse TNF-α and IL-10 were significantly increased in the LPS stimulation group, whereas it was reduced in the LPS and mCD200 protein (Acro, OX2-M82F3) co-stimulation group in wild-type mice. The level of mouse TNF-α and IL-10 were significantly increased in the LPS stimulation group, whereas it was reduced in the LPS and hCD200 protein (Acro, OX2-H5251) co-stimulation group in B-hCD200/hCD200R mice. Significance was determined by two-tailed paired t-test. (*P < 0.05, **P < 0.01, ***P < 0.001)
* When publishing results obtained using this animal model, please acknowledge the source as follows: The animal model [B-hCD200/hCD200R mice] (Cat# 111888) was purchased from Biocytogen.