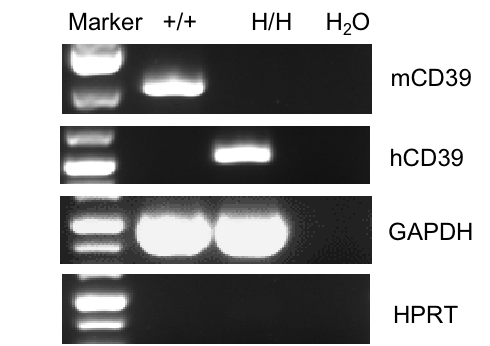
mRNA expression analysis
Strain specific analysis of CD39 gene expression in wild-type C57BL/6 mice and B-hCD39 mice by RT-PCR. Mouse Cd39 mRNA was detectable only in splenocytes of wild-type C57BL/6 mice (+/+). Human CD39 mRNA was detectable only in homozygous B-hCD39 mice (H/H), but not in wild-type mice.
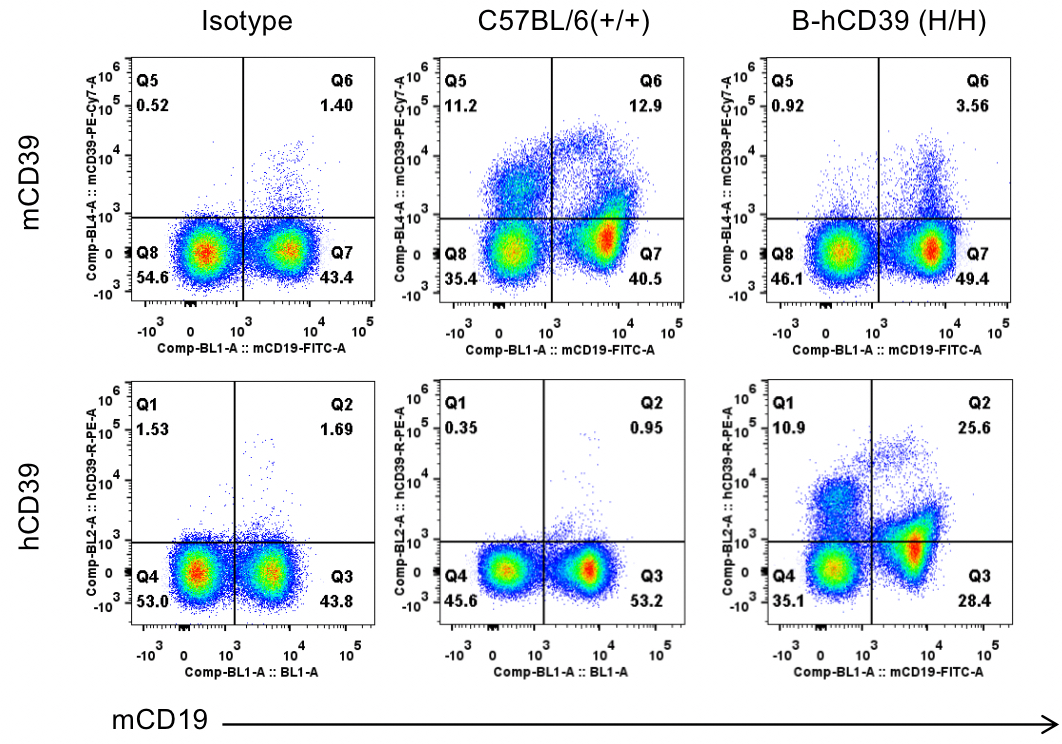
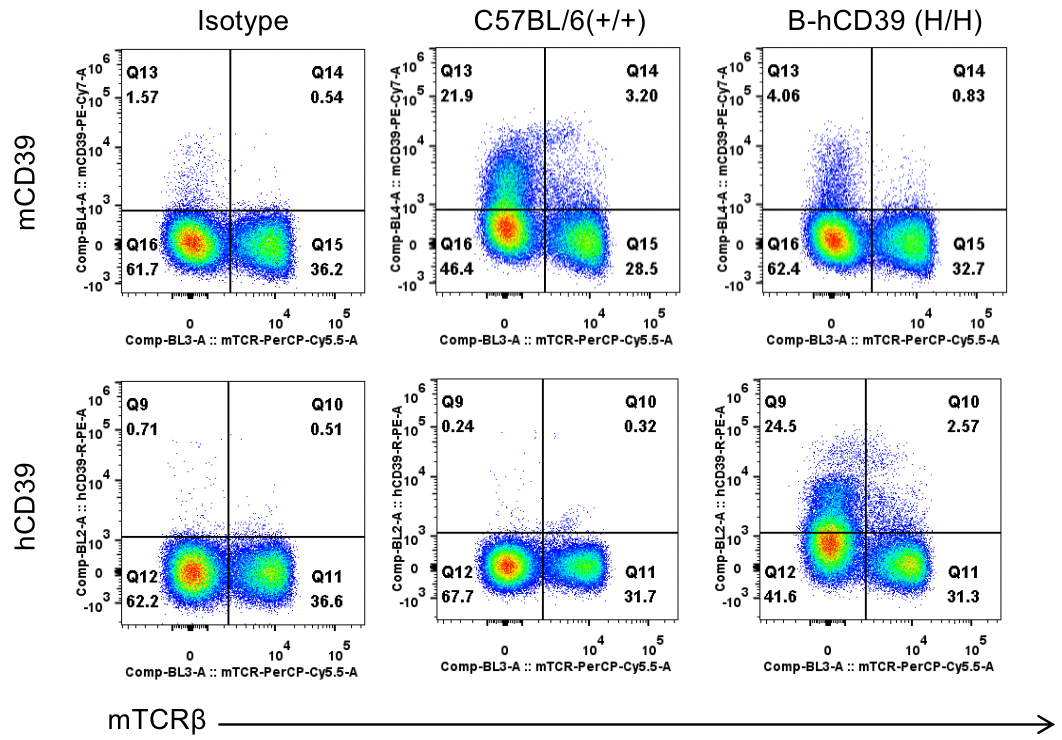
Protein expression analysis
Strain specific CD39 expression analysis in homozygous B-hCD39 mice by flow cytometry. Splenocytes were collected from WT and homozygous B-hCD39 mice, and analyzed by flow cytometry with species-specific CD39 antibody. Mouse CD39 was detectable in WT mice. Human CD39 was exclusively detectable in homozygous B-hCD39 mice but not WT mice.
Strain specific CD39 expression analysis in homozygous B-hCD39 mice by flow cytometry. Splenocytes were collected from WT and homozygous B-hCD39 mice, and analyzed by flow cytometry with species-specific CD39 antibody. Mouse CD39 was detectable in WT mice. Human CD39 was exclusively detectable in homozygous B-hCD39 mice but not WT mice.
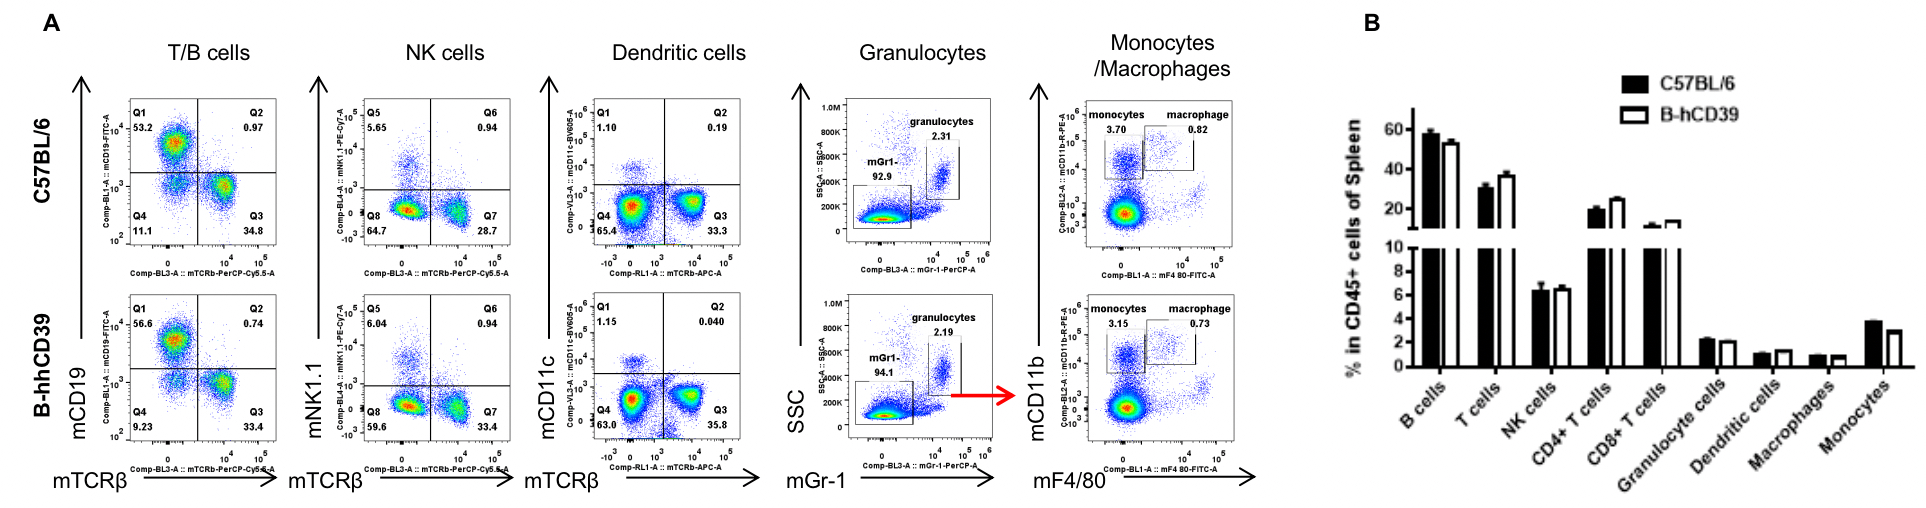
Analysis of leukocytes subpopulation in B-hCD39 mice
Analysis of spleen leukocyte subpopulations by FACS. Splenocytes were isolated from female C57BL/6 and B-hCD39 mice (n=3, 6-week-old). Flow cytometry analysis of the splenocytes was performed to assess leukocyte subpopulations. A. Representative FACS plots. Single live cells were gated for the CD45+ population and used for further analysis as indicated here. B. Results of FACS analysis. Percent of T cells, B cells, NK cells, dendritic cells, granulocytes, monocytes and macrophages in homozygous B-hCD39 mice were similar to those in the C57BL/6 mice, demonstrating that hCD39 humanized does not change the overall development, differentiation or distribution of these cell types in spleen. Values are expressed as mean ± SEM.
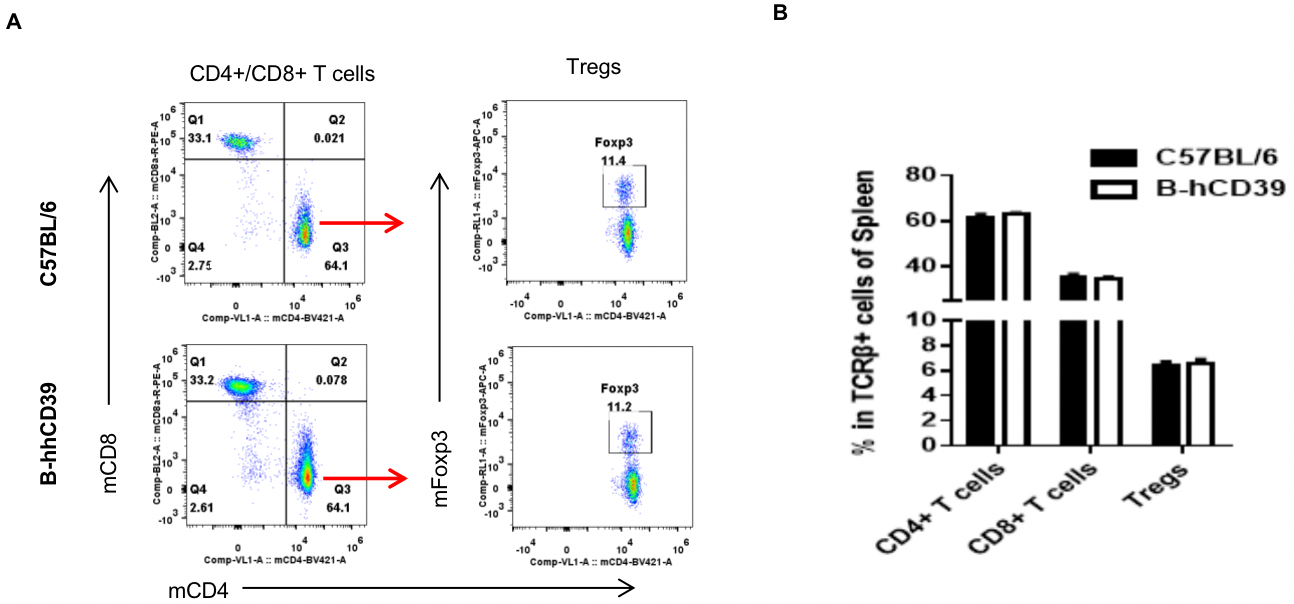
Analysis of spleen T cell subpopulations in B-hCD39 mice
Analysis of spleen T cell subpopulations by FACS. Splenocytes were isolated from female C57BL/6 and B-hCD39 mice (n=3, 6-week-old). Flow cytometry analysis of the splenocytes was performed to assess leukocyte subpopulations. A. Representative FACS plots. Single live CD45+ cells were gated for CD3+ T cell population and used for further analysis as indicated here. B. Results of FACS analysis. The percent of Tregs in homozygous B-hCD39 mice were similar to those in the C57BL/6 mice, demonstrating that introduction of hCD39 in place of its mouse counterpart does not change the overall development, differentiation or distribution of these T cell subtypes in spleen. Values are expressed as mean ± SEM.
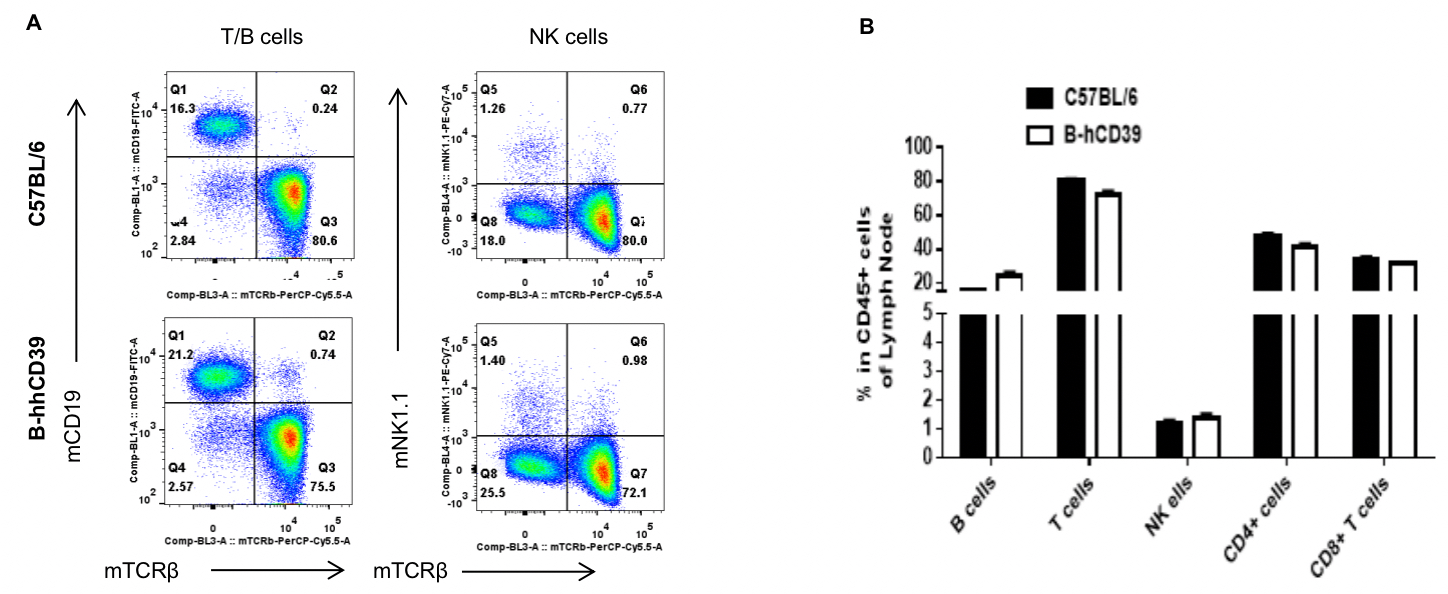
Analysis of lymph node leukocytes subpopulations in B-hCD39 mice
Analysis of lymph node leukocyte subpopulations by FACS. Leukocytes were isolated from female C57BL/6 and B-hCD39 mice (n=3, 6-week-old). Flow cytometry analysis of the leukocytes was performed to assess leukocyte subpopulations. A. Representative FACS plots. Single live cells were gated for CD45+ population and used for further analysis as indicated here. B. Results of FACS analysis Percent of T cells, B cells in homozygous B-hCD39 mice were similar to those in the C57BL/6 mice, demonstrating that introduction of hCD39 in place of its mouse counterpart does not change the overall development, differentiation or distribution of these cell types in lymph node. Values are expressed as mean ± SEM.
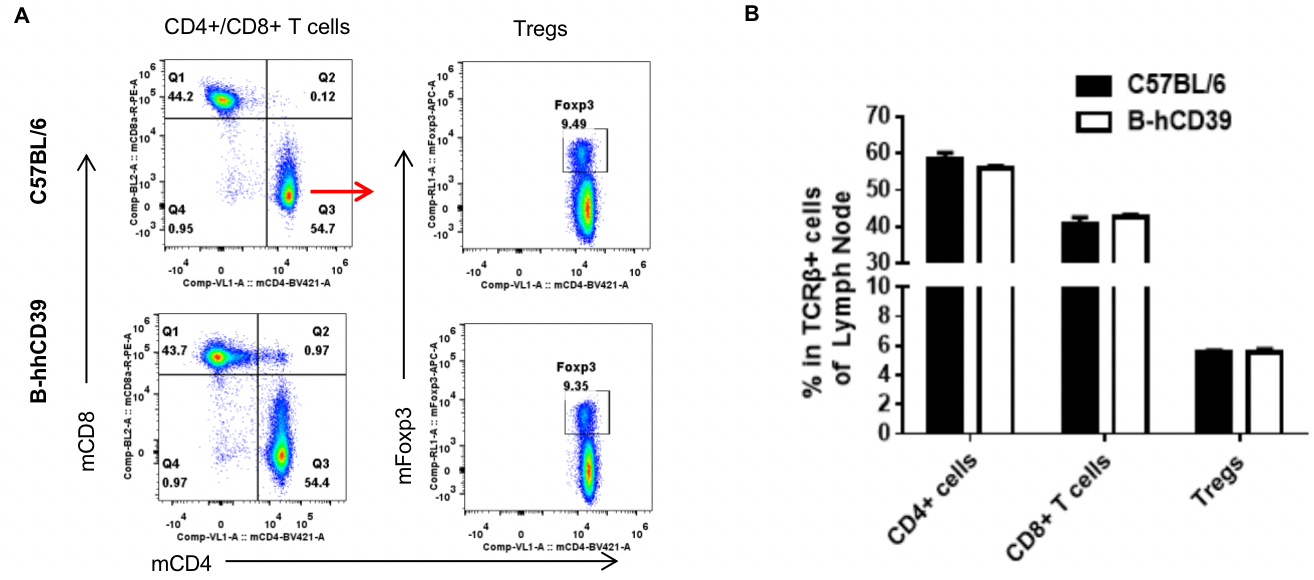
Analysis of lymph node leukocyte subpopulations by FACS. Leukocytes were isolated from female C57BL/6 and B-hCD39 mice (n=3, 6- week-old). Flow cytometry analysis of the leukocytes was performed to assess leukocyte subpopulations. Representative FACS plots. Single live CD45+ cells were gated for CD3+ T cell population and used for further analysis as indicated here. B. Results of FACS analysis. The percent of CD8+ T cells, CD4+ T cells, and Tregs in homozygous B-hCD39 mice were similar to those in the C57BL/6 mice, demonstrating that introduction of hCD39 in place of its mouse counterpart does not change the overall development, differentiation or distribution of these cell types in lymph node. Values are expressed as mean ± SEM.
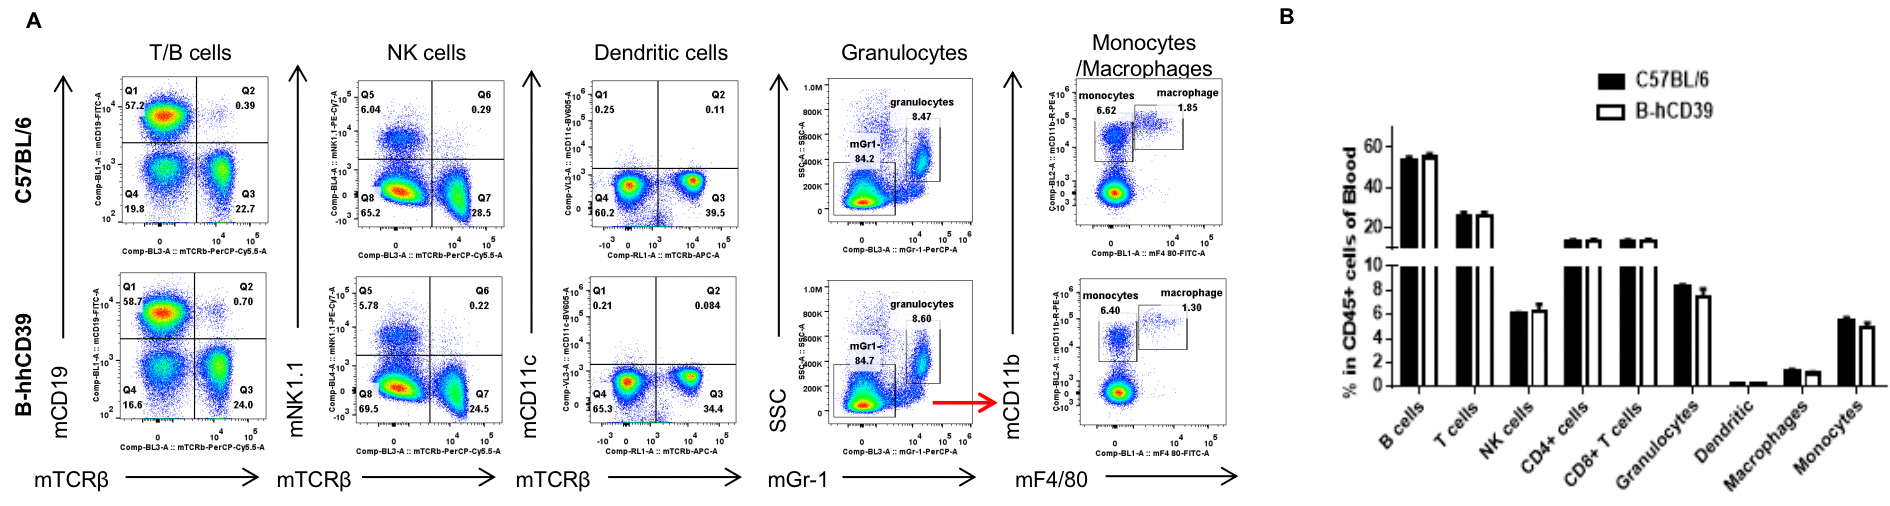
Analysis of blood leukocytes subpopulations in B-hCD39 mice
Analysis of blood leukocyte subpopulations by FACS. Leukocytes were isolated from female C57BL/6 and B-hCD39 mice (n=3, 6-week-old). Flow cytometry analysis of the leukocytes was performed to assess leukocyte subpopulations. A. Representative FACS plots. Single live cells were gated for CD45+ population and used for further analysis as indicated here. B. Results of FACS analysis Percent of T cells, B cells, NK cells, dendritic cells, granulocytes, monocytes and macrophages in homozygous B-hCD39 mice were similar to those in the C57BL/6 mice, demonstrating that introduction of hCD39 in place of its mouse counterpart does not change the overall development, differentiation or distribution of these cell types in blood. Values are expressed as mean ± SEM.
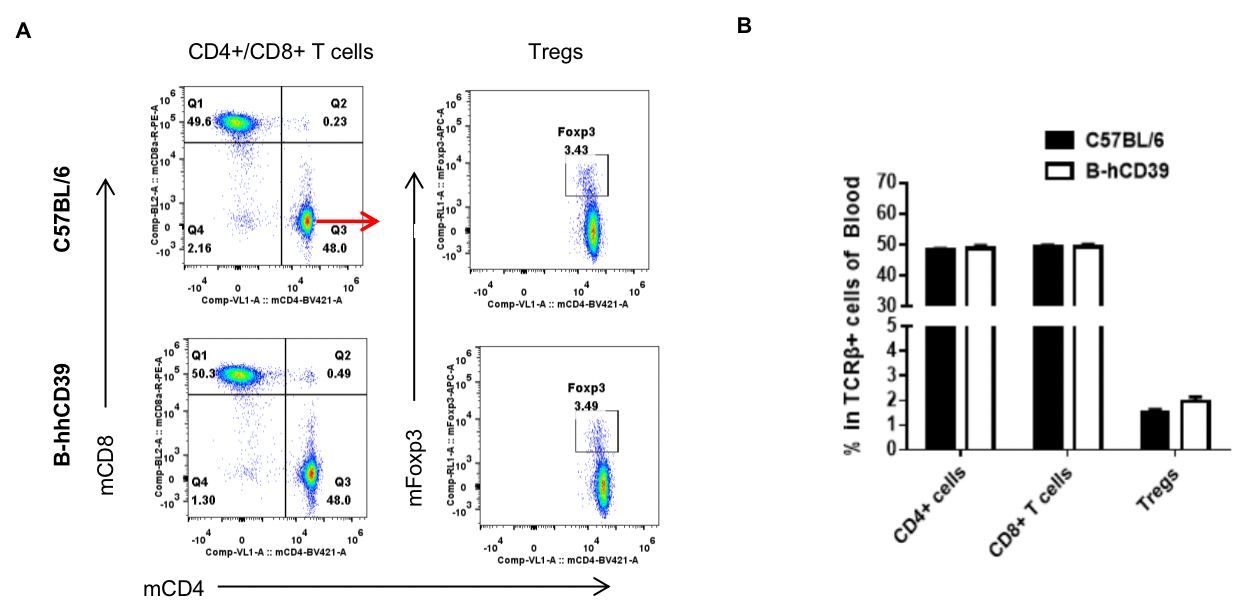
Analysis of blood leukocyte subpopulations by FACS. Leukocytes were isolated from female C57BL/6 and B-hCD39 mice (n=3, 6-week-old). Flow cytometry analysis of the leukocytes was performed to assess leukocyte subpopulations. Representative FACS plots. Single live CD45+ cells were gated for CD3+ T cell population and used for further analysis as indicated here. B. Results of FACS analysis. The percent of CD8+ T cells, CD4+ T cells, and Tregs in homozygous B-hCD39 mice were similar to those in the C57BL/6 mice, demonstrating that introduction of hCD39 in place of its mouse counterpart does not change the overall development, differentiation or distribution of these cell types in blood. Values are expressed as mean ± SEM.
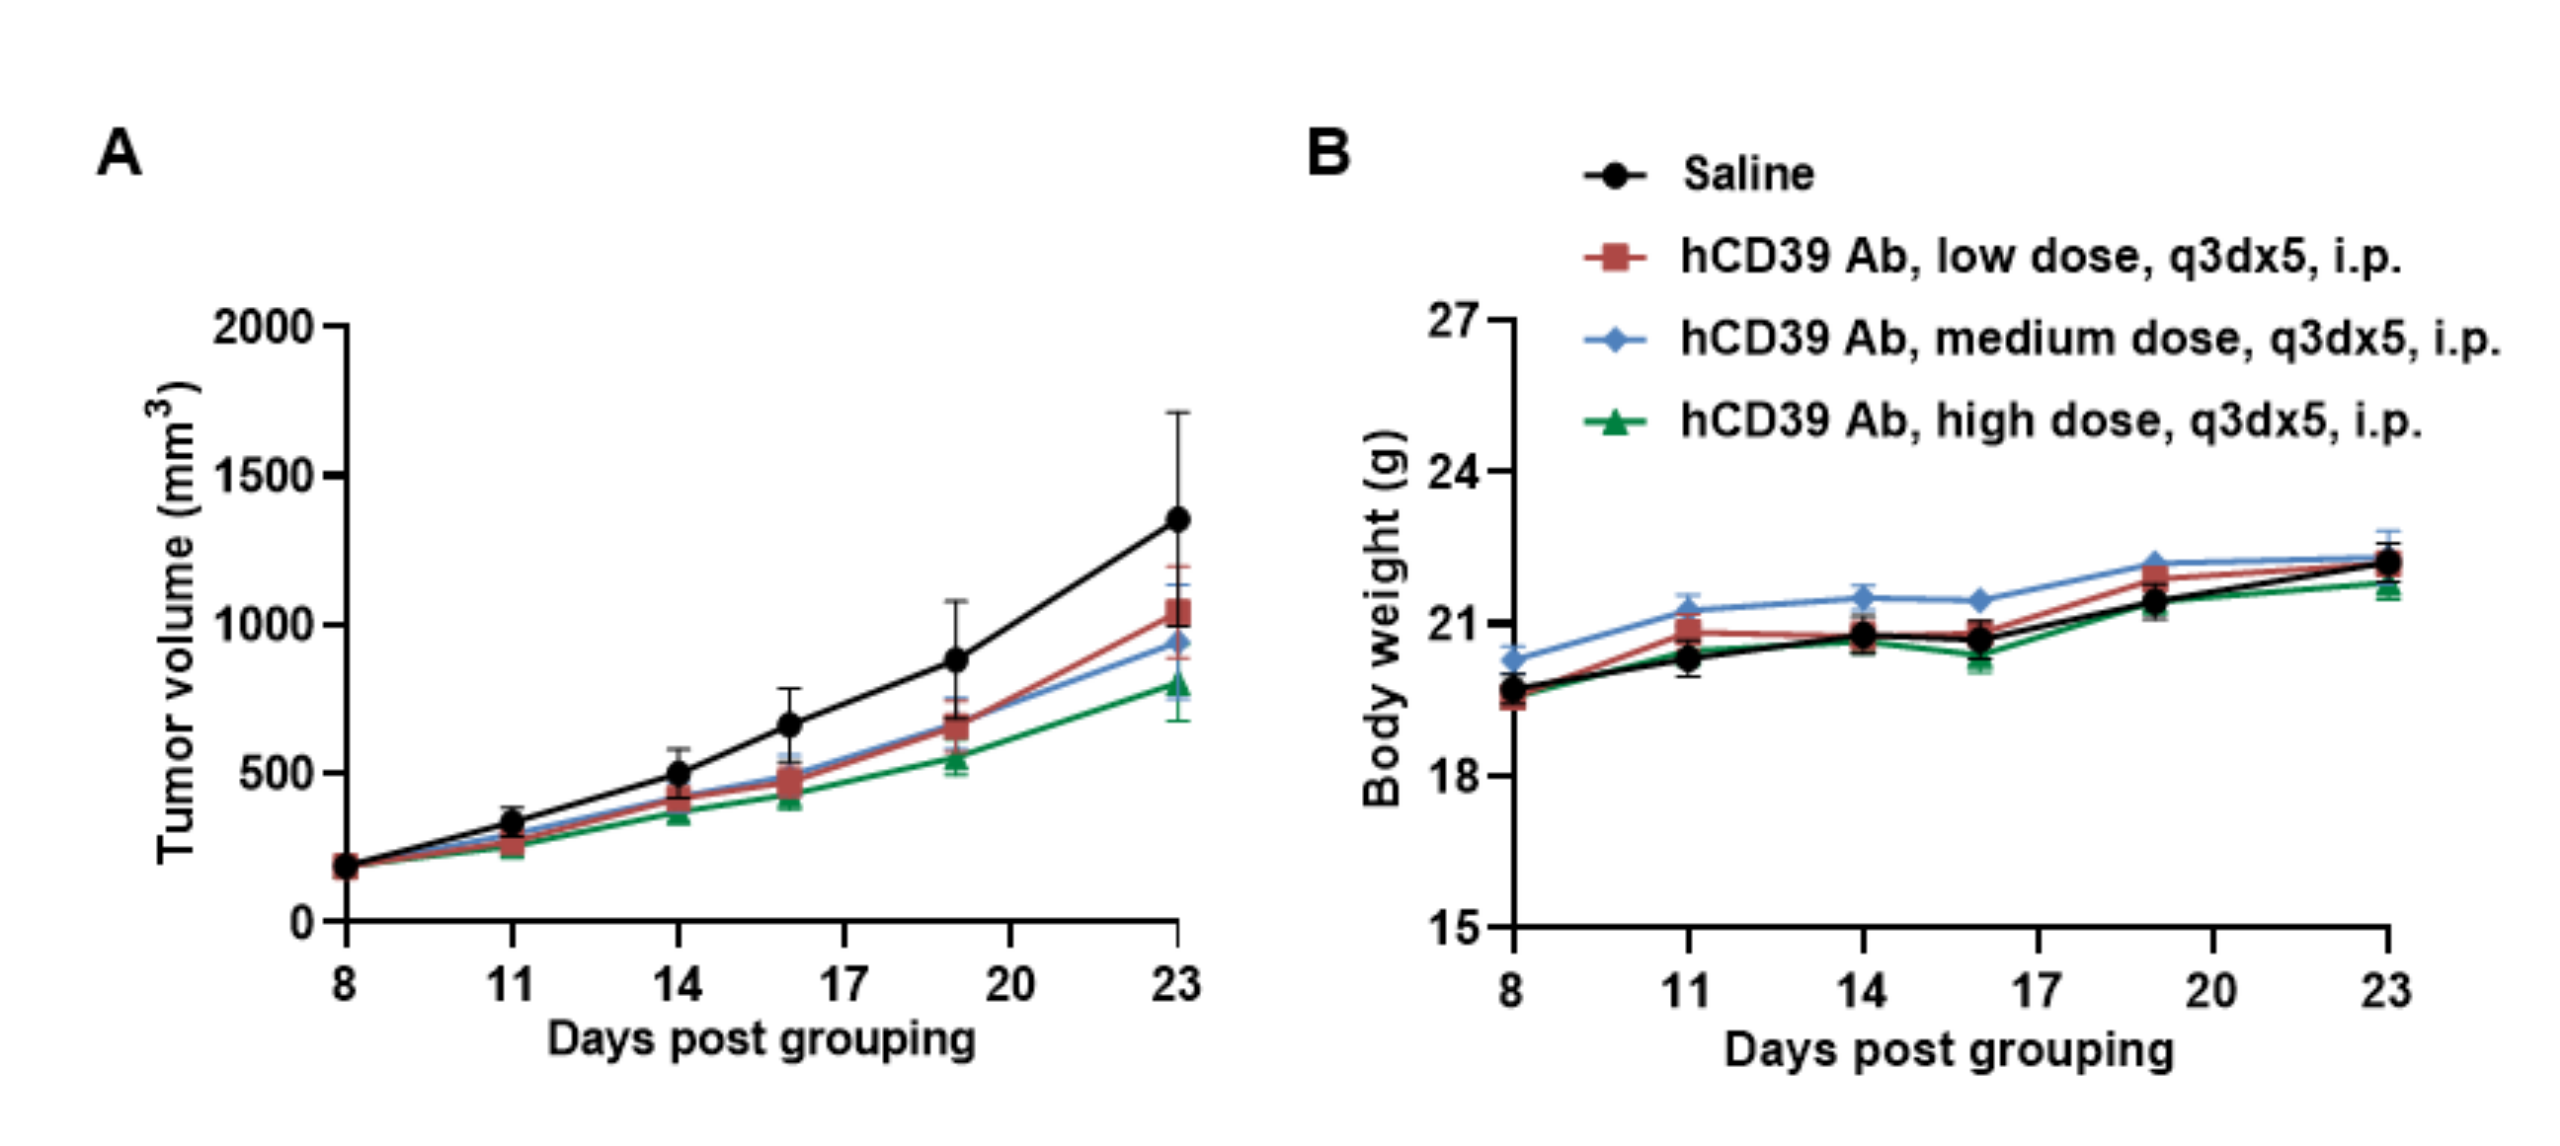
In vivo efficacy of anti-human CD39 antibody
Antitumor activity of anti-human CD39 antibody in B-hCD39 mice. (A) Anti-human CD39 antibody get from cooperation company inhibited MC38 tumor growth in B-hCD39 mice. Murine colon cancer MC38 cells were subcutaneously implanted into homozygous B-hCD39 mice (n=6). Mice were grouped when tumor volume reached approximately 190 mm3, at which time they were treated with anti-human CD39 antibody. (B) Body weight changes during treatment. As shown in panel A, anti-human CD39 antibody were efficacious in controlling tumor growth in B-hCD39 mice with dose dependence. B-hCD39 mice provide a powerful preclinical model for in vivo evaluation of anti-human CD39 antibody. Values are expressed as mean ± SEM.
Using B-hCD39 mice to Verify the Efficacy of Antibodies
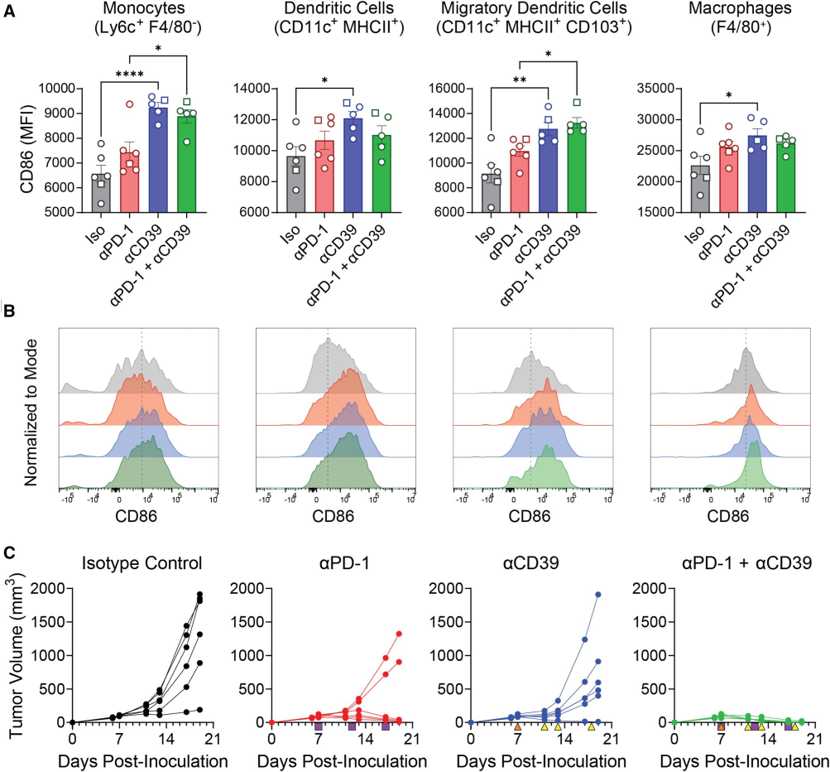
Combined anti-CD39 and anti-PD-1 treatment enhances myeloid cell activation in tumor-draining lymph nodes (TDLNs) and suppresses tumor growth in an MC38 hCD39KI mouse model.
(A) Expression of CD86 in TDLNs was assessed at the endpoint of the study. Elevated levels of CD86, reflecting myeloid cell activation, were observed in animals treated with anti-CD39 alone or in combination with anti-PD-1. Statistical analysis was performed using one-way ANOVA followed by Šidák’s multiple comparisons test.
(B) Representative histograms corresponding to the region highlighted by a square in panel (A).
(C) Tumor growth curves for individual mice following treatment with anti-CD39, anti-PD-1, or corresponding isotype controls. Dosing regimens are indicated below the graph: purple squares, anti-PD-1 (10 mg/kg i.p. in HBSS); orange triangles, anti-CD39 (20 mg/kg i.p. in HBSS); yellow triangles, anti-CD39 (10 mg/kg i.p. in HBSS). *P ≤ 0.05, **P ≤ 0.01, and ****P ≤ 0.0001.MFI, mean fluorescence intensity.
* When publishing results obtained using this animal model, please acknowledge the source as follows: The animal model [B-hCD39 mice] (Cat# 110783) was purchased from Biocytogen.