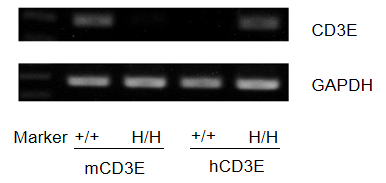
Human CD3E mRNA Expression Analysis
Mouse Cd3e mRNA was detectable only in splenocytes of wild-type mice, whereas human CD3E mRNA was exclusively detectable in homozygous CD3E humanized mice. This confirms strain-specific expression of human CD3E in the model.
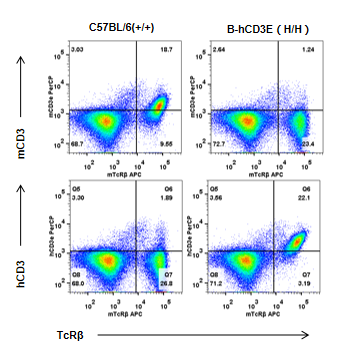
Human CD3 Protein Expression Analysis
Human CD3E Protein Expression Analysis in CD3E humanized mice. Splenocytes were collected from wild-type and homozygous CD3E humanized mice and analyzed by flow cytometry using species-specific anti-CD3E antibodies. Mouse CD3E protein was exclusively detectable in wild-type mice, while human CD3E protein was exclusively detectable in homozygous CD3E humanized mice but absent in wild-type controls.
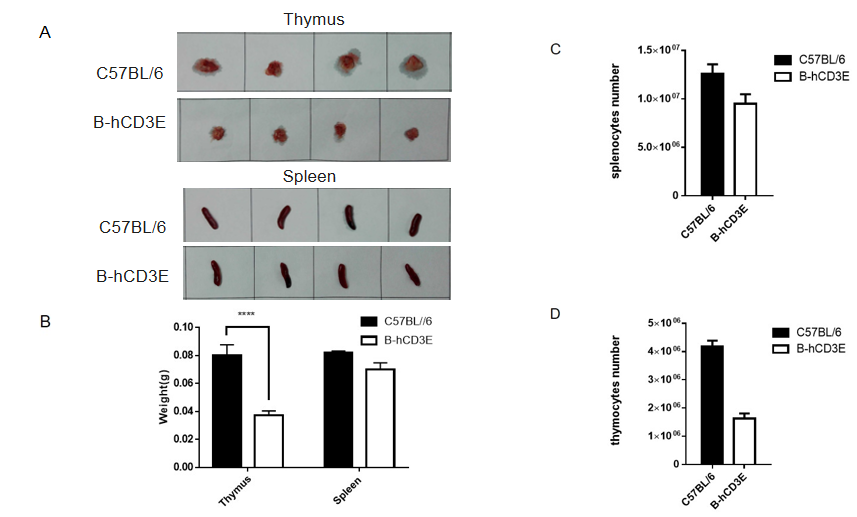
Immune Organ Development in CD3E Humanized Mice
Thymus and spleen weight and cell counts in CD3E humanized mice.
(A, B) Thymus and spleen were isolated and weighed from wild-type C57BL/6 mice and homozygous CD3E humanized mice (n=6). Spleen weight showed no significant differences between the two groups, while thymus weight in CD3E humanized mice was significantly lower than that of wild-type controls. (C) Splenocyte counts were comparable between groups. (D) Thymocyte numbers were significantly reduced in CD3E humanized mice compared with wild-type mice.
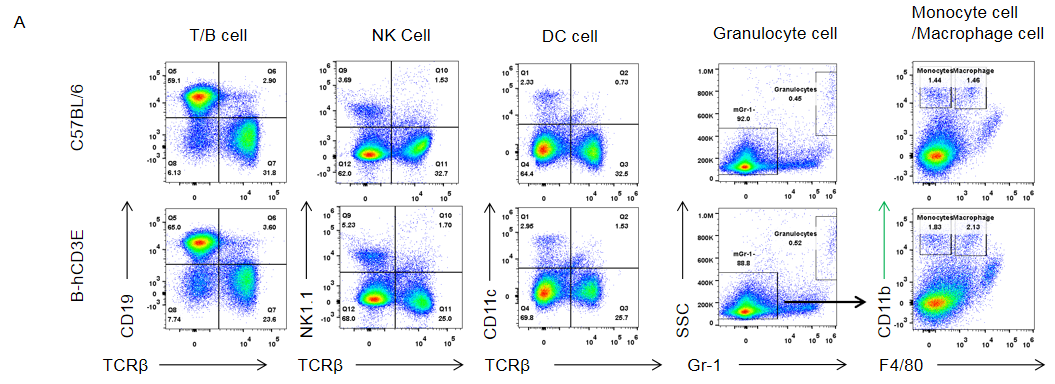
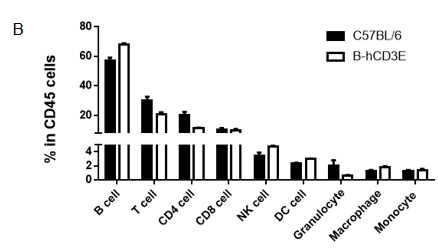
Analysis of Spleen Leukocyte Subpopulations in CD3E Humanized Mice
Analysis of spleen leukocyte subpopulations by flow cytometry in CD3E humanized mice.
Splenocytes were isolated from female wild-type C57BL/6 mice and homozygous CD3E humanized mice (n=3, 6-week-old). Flow cytometry (FACS) was performed to assess leukocyte subpopulations. (A) Representative FACS plots: single live cells were gated for CD45⁺ populations and further analyzed. (B) Quantitative results: the percentages of T cells, B cells, NK cells, monocytes, dendritic cells (DCs), and macrophages in CD3E humanized mice were comparable to wild-type controls, demonstrating that replacement of mouse Cd3e with human CD3E does not alter spleen immune cell development, differentiation, or distribution.
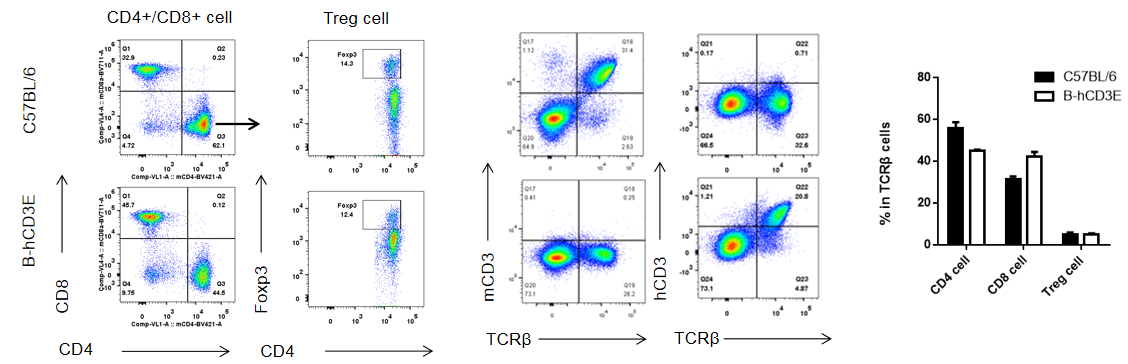
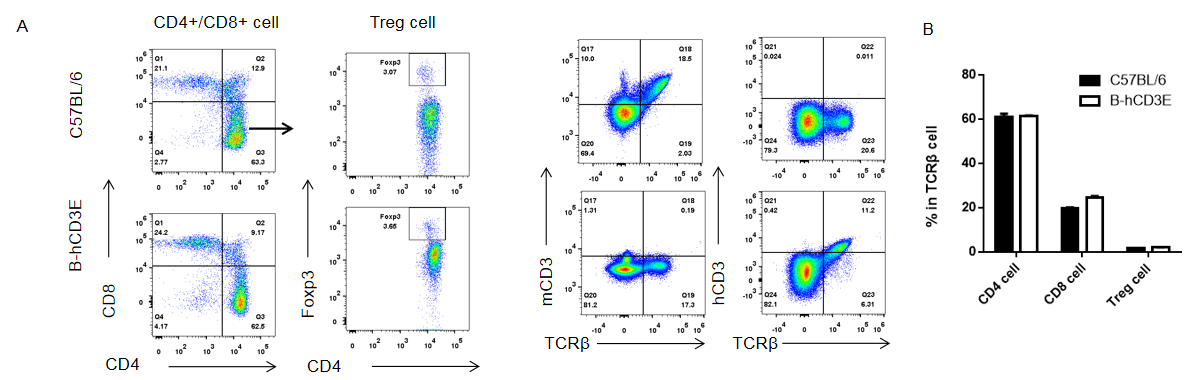
Analysis of Spleen T Cell Subpopulations in CD3E Humanized Mice
Analysis of spleen T cell subpopulations by flow cytometry in CD3E humanized mice.
Splenocytes were isolated from female wild-type C57BL/6 mice and homozygous CD3E humanized mice (n=3, 6-week-old). Flow cytometry (FACS) was performed to assess splenic T cell subpopulations. (A) Representative FACS plots: single live CD45⁺ cells were gated for CD3⁺ T cells and further analyzed. (B) Quantitative analysis: the percentages of CD8⁺ T cells, CD4⁺ T cells, and regulatory T cells (Tregs) in CD3E humanized mice were comparable to those in wild-type controls. These findings demonstrate that replacement of mouse Cd3e with human CD3E does not alter splenic T cell development, differentiation, or distribution. Values are expressed as mean ± SEM.
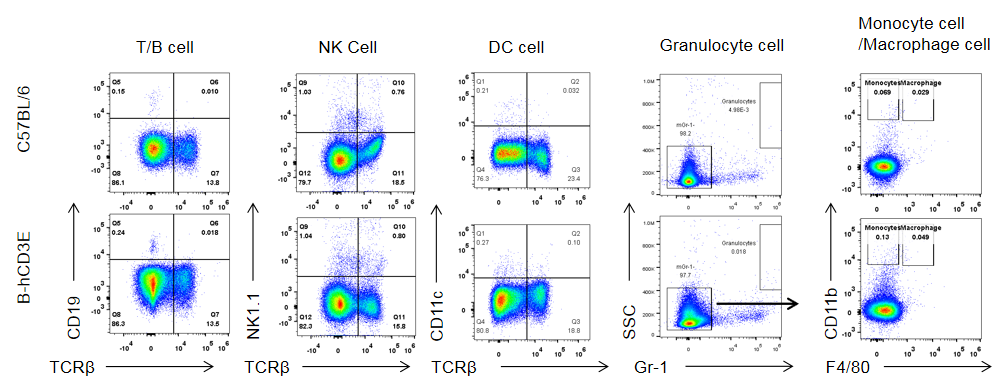
Analysis of Spleen Leukocyte Subpopulations in CD3E Humanized Mice
Analysis of lymphocyte subpopulations by flow cytometry in CD3E humanized mice.
Lymphocytes were isolated from wild-type C57BL/6 mice and homozygous CD3E humanized mice (n=4). Single live cells were gated for CD45⁺ populations and analyzed by flow cytometry. The percentages of T cells, B cells, and regulatory T cells (Tregs) in CD3E humanized mice were comparable to those in wild-type controls, indicating that replacement of mouse Cd3e with human CD3E does not affect the development, differentiation, or distribution of these cell types in the spleen.
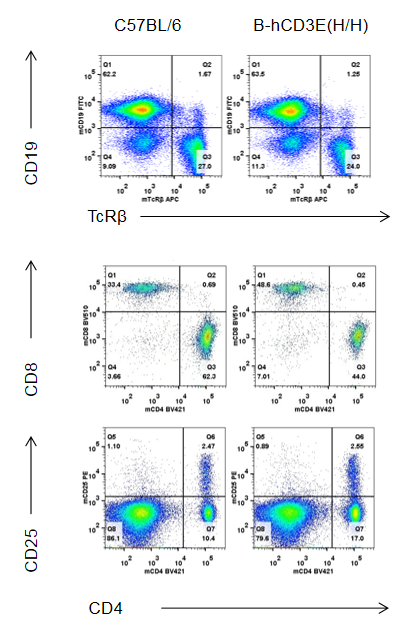
Analysis of Thymus Leukocyte Subpopulations in CD3E Humanized Mice
Analysis of thymus leukocyte subpopulations by FACS. Thymocytes were isolated from female wild-type C57BL/6 mice and homozygous CD3E humanized mice (n=6, 8-week-old). Flow cytometry (FACS) was performed to assess thymic leukocyte subpopulations. Representative FACS plots show gating of single live CD45⁺ cells for further analysis. The percentages of CD4⁺/CD8⁺ T cell subsets, double-negative (DN), double-positive (DP) thymocytes, and B cells in CD3E humanized mice were comparable to those in wild-type controls, indicating that replacement of mouse Cd3e with human CD3E does not alter thymic immune cell development, differentiation, or distribution.
Analysis of Thymus T Cell Subpopulations in CD3E Humanized Mice
Analysis of thymus T cell subpopulations by FACS. Thymocytes were isolated from female wild-type C57BL/6 mice and homozygous CD3E humanized mice (n=6, 6-week-old). Flow cytometry (FACS) was performed to assess T cell subpopulations. (A) Representative FACS plots: single live CD45⁺ cells were gated for CD3⁺ T cells and further analyzed. (B) Quantitative analysis: the percentages of CD8⁺ T cells, CD4⁺ T cells, and regulatory T cells (Tregs) in CD3E humanized mice were comparable to those in wild-type controls. These findings demonstrate that replacement of mouse Cd3e with human CD3E does not affect thymic T cell development, differentiation, or distribution. Values are expressed as mean ± SEM. DN: double negative; DP: double positive.
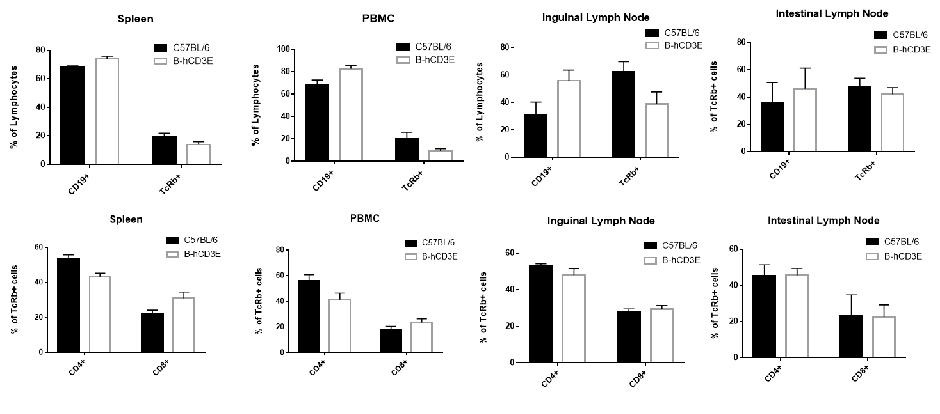
Analysis of B And T Cell Subpopulations in Spleen, PBMC, and Lymph Node of CD3E Humanized Mice
Analysis of B and T cell subpopulation by FACS. Lymphocytes were isolated from spleen, peripheral blood mononuclear cells (PBMCs), and lymph nodes of wild-type C57BL/6 mice and homozygous CD3E humanized mice (n=4). Flow cytometry (FACS) was performed to assess lymphocyte subpopulations. Single live CD45⁺ cells were gated for further analysis. The percentages of T cells and B cells in CD3E humanized mice were comparable to those in wild-type controls, indicating that introduction of human CD3E does not alter the development, differentiation, or distribution of these lymphocyte populations.
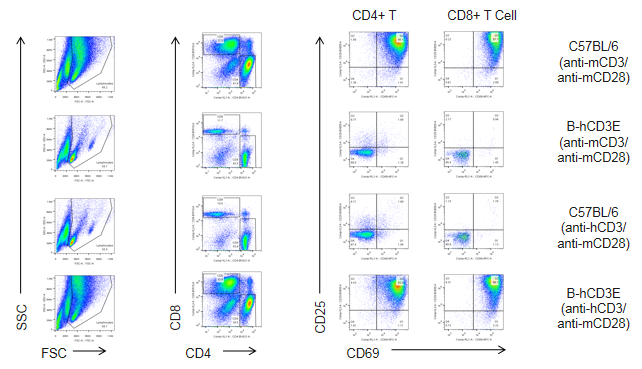
In Vitro T Cell Activation in CD3E Humanized Mice Stimulated with Anti-CD3E Antibody
In vitro T cell proliferation in CD3E humanized mice following anti-CD3E stimulation (48h). T cells (2.5 × 10⁶) were isolated from splenocytes of wild-type C57BL/6 mice and homozygous CD3E humanized mice (n=4) and incubated with anti-human CD3E antibody (2 µg/mL) or anti-mouse CD3E antibody (2 µg/mL) together with anti-mouse CD28 antibody (5 µg/mL) for 48 hours. T cell proliferation was assessed by flow cytometry. T cell activation in CD3E humanized mice was significantly upregulated by anti-human CD3E antibody, at levels comparable to those in wild-type controls stimulated with anti-mouse CD3E antibody.
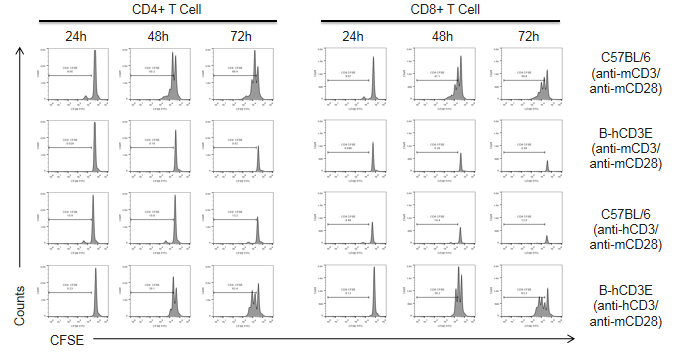
Proliferation kinetics (24h, 48h, 72h) of in vitro T cell proliferation in CD3E humanized mice following anti-CD3E stimulation.
T cells (2.5 × 10⁶) were isolated from the splenocytes of wild-type C57BL/6 mice and homozygous CD3E humanized mice (n=4) and incubated with anti-human CD3E antibody (2 µg/mL) or anti-mouse CD3E antibody (2 µg/mL) together with anti-mouse CD28 antibody (5 µg/mL) for 24, 48, and 72 hours. T cell proliferation was measured by flow cytometry. T cell activation in CD3E humanized mice was significantly upregulated by anti-human CD3E antibody, at levels comparable to those in wild-type controls treated with anti-mouse CD3E antibody, indicating that Cd3e humanization does not impair splenic T cell activation in vitro.
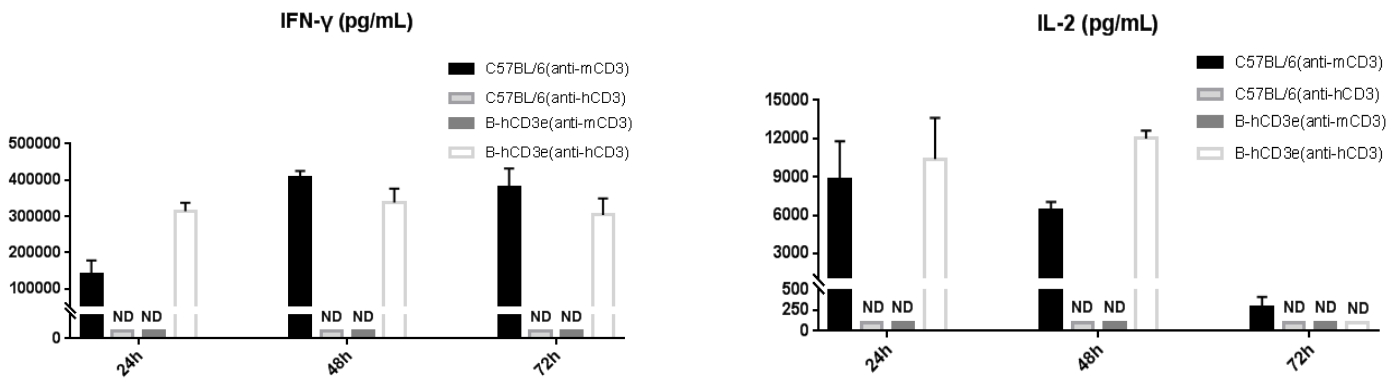
In vitro cytokine production (IFN-γ, IL-2) in CD3E humanized mice following anti-CD3E stimulation.
T cells (2.5 × 10⁶) were isolated from splenocytes of wild-type C57BL/6 mice and homozygous CD3E humanized mice (n=4) and incubated with anti-human CD3E antibody (2 µg/mL) or anti-mouse CD3E antibody (2 µg/mL) together with anti-mouse CD28 antibody (5 µg/mL) for 24, 48, and 72 hours. IFN-γ and IL-2 levels in culture supernatants were measured by ELISA. Cytokine production in CD3E humanized mice was comparable to that of wild-type controls, indicating that Cd3e humanization does not impair splenic T cell activation in vitro.
Ex Vivo T Cell Activation in CD3E Humanized Mice Following Anti-CD3E Stimulation
Ex vivo T cell activation in CD3E humanized mice after 24h anti-CD3E stimulation.
Wild-type C57BL/6 mice and homozygous CD3E humanized mice were injected intraperitoneally with anti-CD3E antibody (10 µg/mouse). After 24 hours, T cells were isolated from splenocytes (n=4), and proliferation was measured by flow cytometry. T cell activation in CD3E humanized mice was significantly upregulated by anti-human CD3E antibody, at levels comparable to those in wild-type mice treated with anti-mouse CD3E antibody, indicating that replacement of mouse Cd3e with human CD3E does not impair splenic T cell activation ex vivo.
Ex vivo T cell activation in CD3E humanized mice after 48h anti-CD3E stimulation.
Wild-type C57BL/6 mice and homozygous CD3E humanized mice were injected intraperitoneally with anti-CD3E antibody (10 µg/mouse). After 48 hours, T cells were isolated from splenocytes (n=4), and proliferation was measured by flow cytometry. T cell activation in CD3E humanized mice was significantly downregulated, similar to the response observed in wild-type controls treated with anti-mouse CD3E antibody, indicating that replacement of mouse Cd3e with human CD3E does not alter splenic T cell activation ex vivo.
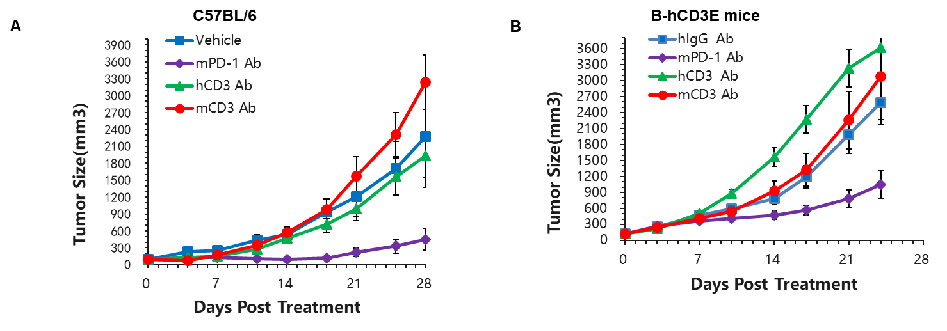
In Vivo Efficacy Evaluation of CD3 Antibodies in CD3E Humanized Mice Using the MC38 Tumor Model
CD3 antibody efficacy evaluation in CD3E humanized mice. Murine colon cancer MC38 cells were subcutaneously implanted into wild-type C57BL/6 mice (A) and homozygous CD3E humanized mice (B). Mice were randomized into groups when tumor size reached approximately 150 ± 50 mm³ (n=5). In CD3E humanized mice, treatment with anti-mouse PD-1 (mPD-1) antibody significantly inhibited tumor growth, confirming that T cells retained normal function. In contrast, tumor growth accelerated following anti-human CD3E antibody administration, likely due to activation-induced cell death (AICD). These results demonstrate that CD3E humanized mice provide a powerful preclinical model for evaluating the in vivo pharmacological efficacy of CD3-targeted antibodies.
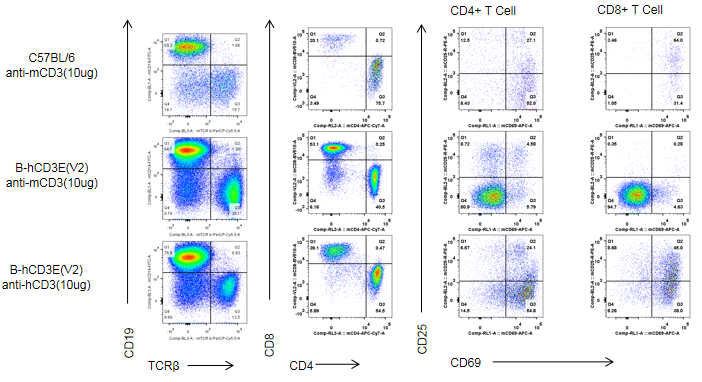
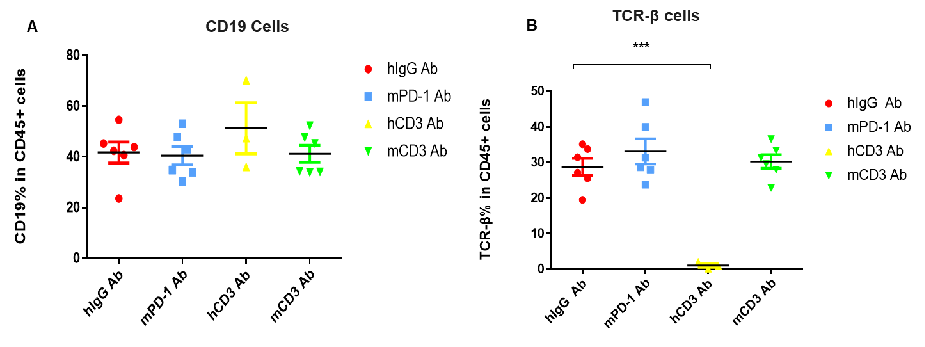
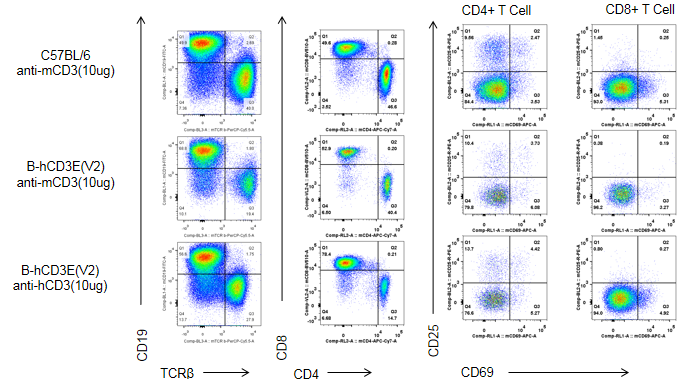
T Cell Activation and Depletion in CD3 Antibody Efficacy Evaluation Using CD3E Humanized Mice
T cell activation and depletion in CD3E humanized mice following CD3 antibody treatment. Peripheral blood lymphocytes were isolated 48 hours after antibody treatment in homozygous CD3E humanized mice. In the anti-human CD3E (hCD3) antibody treatment group, the proportion of T cells was significantly reduced due to activation-induced cell death (AICD), whereas no significant changes were observed in the anti-mouse PD-1 (mPD-1) antibody group. (A) Compared with the human IgG (hIgG) control group, there was no significant difference in the percentage of CD19⁺ B cells among CD45⁺ cells after hCD3 or mCD3 antibody treatment. (B) In contrast, the percentage of TCR-β⁺ T cells was significantly decreased after hCD3 antibody treatment in CD3E humanized mice. These results confirm that CD3E antibody treatment induces T cell depletion in vivo, consistent with the AICD effect.
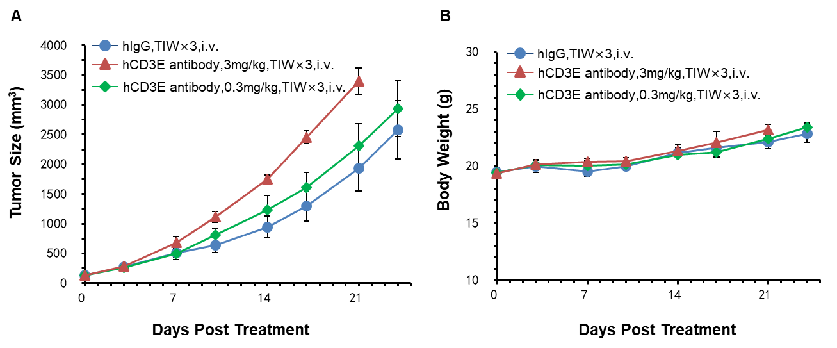
In Vivo Efficacy Evaluation of Anti-Human CD3E Antibodies at Two Doses in CD3E Humanized Mice
Anti-human CD3 antibody efficacy evaluation in CD3E humanized mice with two doses. Murine colon cancer MC38 cells were subcutaneously implanted into homozygous CD3E humanized mice. Mice were divided into control and treatment groups (n=5) when tumor size reached approximately 150 ± 50 mm³. High doses of anti-human CD3E antibodies provided by the client led to accelerated tumor growth, likely due to activation-induced cell death (AICD), confirming that the CD3E humanized mouse model is a powerful tool for evaluating the in vivo pharmacological efficacy of anti-hCD3 antibodies. (A) Average tumor volume ± SEM. (B) Average body weight ± SEM.
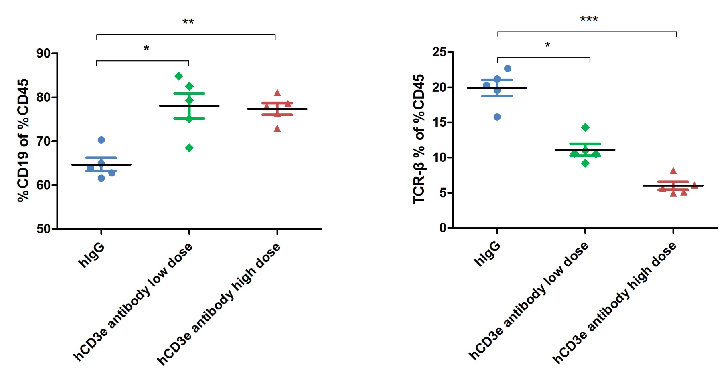
Dose-Dependent T Cell Depletion Caused by Anti-Human CD3E Antibody in CD3E Humanized Mice
Anti-human CD3 antibody induces T cell depletion in CD3E humanized mice. The ratio of B and T cells in peripheral blood was analyzed by flow cytometry at the end of the experiment. Lymphocytes were isolated from the blood of homozygous CD3E humanized mice. In the anti-human CD3E antibody treatment group, the proportion of T cells was significantly reduced due to activation-induced cell death (AICD), while B cell proportions remained unaffected. These results confirm that anti-human CD3E antibody treatment induces dose-dependent T cell depletion in vivo.
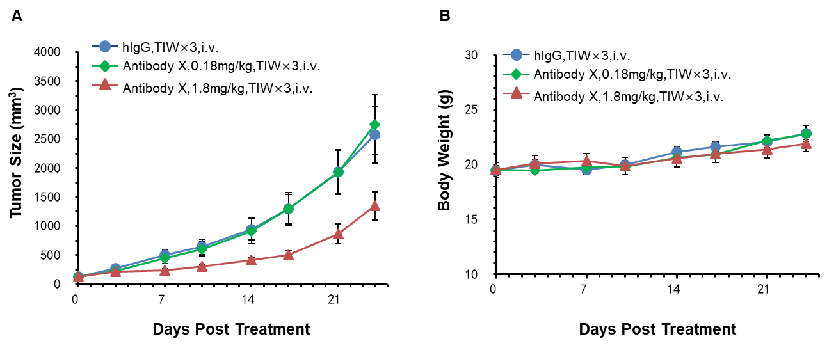
In Vivo Efficacy Evaluation of Antibody X at Two Doses in CD3E Humanized Mice
Antitumor activity of Antibody X in CD3E humanized mice. Murine colon cancer MC38 cells were subcutaneously implanted into homozygous CD3E humanized mice (n=5). Mice were grouped when tumor volume reached approximately 100 mm³ and treated with Antibody X at the doses and schedules indicated. (A) Tumor growth curves show that high-dose Antibody X significantly inhibited MC38 tumor growth in CD3E humanized mice. (B) Body weight changes during treatment. These results demonstrate that CD3E humanized mice provide a powerful preclinical model for the in vivo evaluation of Antibody X efficacy. Values are expressed as mean ± SEM.
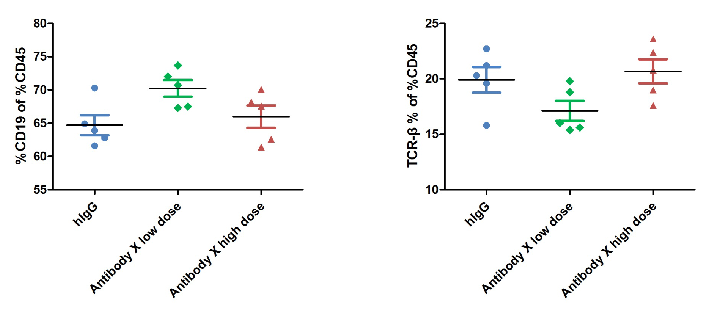
T Cell Activation in Antibody X Efficacy Evaluation at Two Doses in CD3E Humanized Mice
T cell activation in the efficacy evaluation of the tumor-targeting antibody (X) at two doses in CD3E humanized mice. The ratio of B and T cells in peripheral blood was analyzed by flow cytometry at the experimental endpoint. Lymphocytes were isolated from homozygous CD3E humanized mice. In both treatment groups, the ratio of B cells to T cells remained stable, indicating that Antibody X administration did not significantly alter lymphocyte composition.
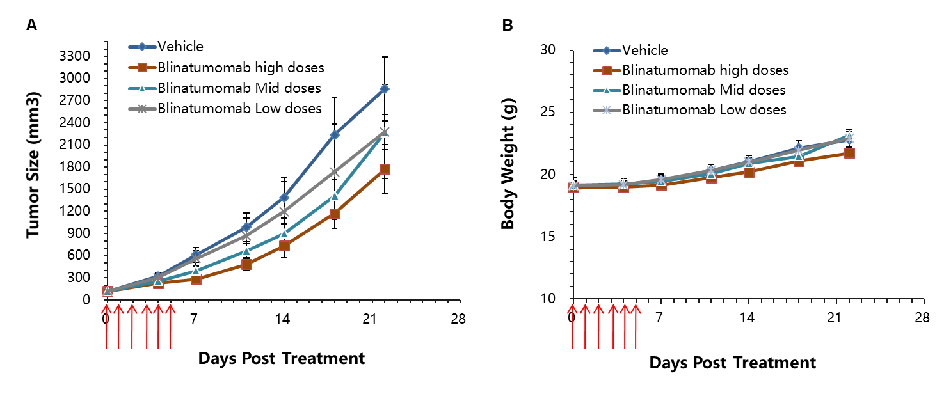
In Vivo Efficacy Evaluation of Blinatumomab in CD3E Humanized Mice
Blinatumomab efficacy evaluation in CD3E humanized mice. MC38-hCD19 tumor cells were subcutaneously implanted into homozygous CD3E humanized mice. Mice were divided into control and treatment groups (n=6) when tumor volume reached approximately 150 ± 50 mm³. High-dose anti-human CD3E antibody (Blinatumomab, commercially available) significantly inhibited tumor growth, confirming that CD3E humanized mice provide a powerful preclinical model for evaluating the efficacy of bispecific antibodies targeting human CD3E in vivo. (A) Average tumor volume ± SEM. (B) Average body weight ± SEM.
In Vivo Efficacy Evaluation of CD3E Bispecific Antibody (BsAb) in CD3E Humanized Mice
Antitumor activity of CD3E BsAb in CD3E humanized mice. The antitumor activity of a client-provided CD3E bispecific antibody (BsAb) was evaluated in homozygous CD3E humanized mice. (A) Tumor growth curves demonstrate that CD3E BsAb treatment at different doses significantly inhibited tumor growth. (B) Body weight changes during treatment. These results confirm that CD3E humanized mice provide a powerful preclinical model for the in vivo evaluation of CD3E bispecific antibody efficacy. Values are expressed as mean ± SEM.
In Vivo Efficacy Evaluation of CD3E x EpCAM Bispecific Antibody (BsAb) in CD3E Humanized Mice
CD3 x EpCAM BsAb efficacy evaluation in CD3E humanized mice. MC38-hEpCAM tumor cells were implanted subcutaneously into homozygous CD3E humanized mice. Mice were divided into control and treatment groups when tumor size reached approximately 100 ± 20 mm³. Treatment with the client-provided anti-human CD3E x EpCAM bispecific antibody demonstrated moderate antitumor activity compared with the control group. Additionally, co-administration of anti-mouse CD4 (a CD4-depleting antibody) enhanced the antitumor activity of the bispecific anti-hCD3E x hEpCAM antibody, confirming the utility of CD3E humanized mice for in vivo evaluation of bispecific antibodies.
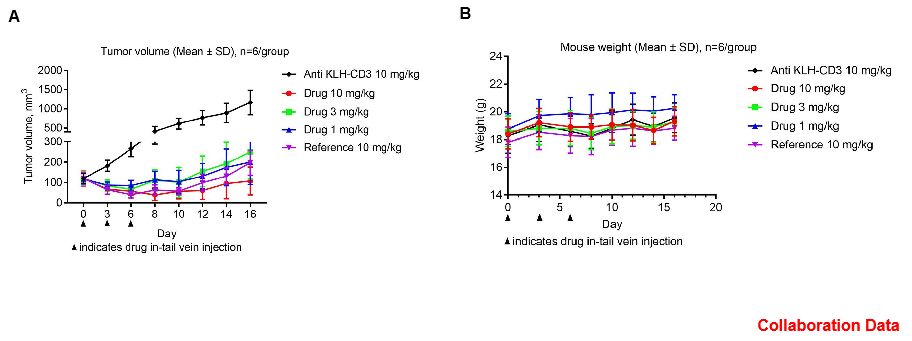
In Vivo Efficacy of CD3 Bispecific Antibody (BsAb) in CD3E Humanized Mice
Antitumor activity of BsAb X in CD3E humanized mice. B-hDLL3 MC38 tumor cells were subcutaneously implanted into female homozygous CD3E humanized mice (8 weeks old, n=6). Mice were grouped when tumor size reached approximately 100 mm³ and then treated with bispecific antibody (BsAb) X, provided by the client, at the doses and schedules indicated. (A) Tumor volume changes during treatment. (B) Body weight changes during treatment. BsAb X effectively controlled tumor growth in CD3E humanized mice, demonstrating that this model is a powerful tool for the in vivo efficacy evaluation of T cell bispecific antibodies. Values are expressed as mean ± SEM.
AICD Analysis After Antibody Treatment in CD3E Humanized Mice
AICD analysis after antibody treatment in CD3E humanized mice. The ratio of T cells in spleen and blood was analyzed in homozygous CD3E humanized mice and wild-type C57BL/6 mice after antibody treatment. Mice were treated with hCD3 antibody (OKT3), CD3/CD19 bispecific antibody, Blinatumomab, or PBS (groups G1–G4), while wild-type C57BL/6 mice received mCD3 antibody (145-2C11) or PBS (groups G5–G6). T cell percentages in spleen and blood were measured by flow cytometry at 24, 72, and 168 hours post-treatment. Results demonstrated dynamic changes in T cell proportions, with significant reductions in specific treatment groups consistent with activation-induced cell death (AICD), highlighting the value of CD3E humanized mice for in vivo antibody efficacy and safety evaluation.
Frequently Asked Questions (FAQs) About CD3E Humanized Mice (B-hCD3E)
Q1: What are B-hCD3E mice?
A1: B-hCD3E mice are humanized models engineered to express the human CD3E extracellular domain. They enable accurate in vivo testing of antibodies and therapies targeting human CD3E, which is not possible in wild-type mice.
Q2: Why use B-hCD3E mice instead of wild-type mice?
A2: Human antibodies often fail to recognize mouse CD3E. B-hCD3E mice overcome this limitation, making them the ideal preclinical model for antibody validation, safety testing, and drug development.
Q3: Can B-hCD3E mice be used for antibody validation?
A3: Yes. These mice are specifically designed for in vivo evaluation of monoclonal antibodies, bispecific antibodies, and T cell engagers (TCEs) targeting human CD3E.
Q4: What research areas benefit from B-hCD3E mice?
A4: They are valuable in immuno-oncology, T cell activation studies, and preclinical safety assessments of CD3E-directed immunotherapies.
* When publishing results obtained using this animal model, please acknowledge the source as follows: The animal model [B-hCD3E mice] (Cat# 110008) was purchased from Biocytogen.