you may also like
When a new drug enters the body, it embarks on a complex journey shaped by countless biological processes. It must cross biological barriers, spread into tissues, undergo metabolism, and eventually be cleared. This process is known as ADME—Absorption, Distribution, Metabolism, and Excretion—and within it, biodistribution plays a uniquely critical role. Biodistribution analysis shows where a drug actually goes, which organs it favors, how long it lingers, and how much of it reaches the site where it is meant to act.
Traditional drug pharmacokinetics (PK) often emphasize plasma levels, tracking concentrations over time to calculate parameters such as half-life, clearance, and volume of distribution. These metrics are essential, but they don’t tell the whole story: a drug may appear effective in plasma yet fail to reach therapeutic concentrations in its target tissues, such as tumors or neurons behind the blood–brain barrier. This is where biodistribution studies come in, bridging the gap between pharmacology and real-world efficacy and safety.
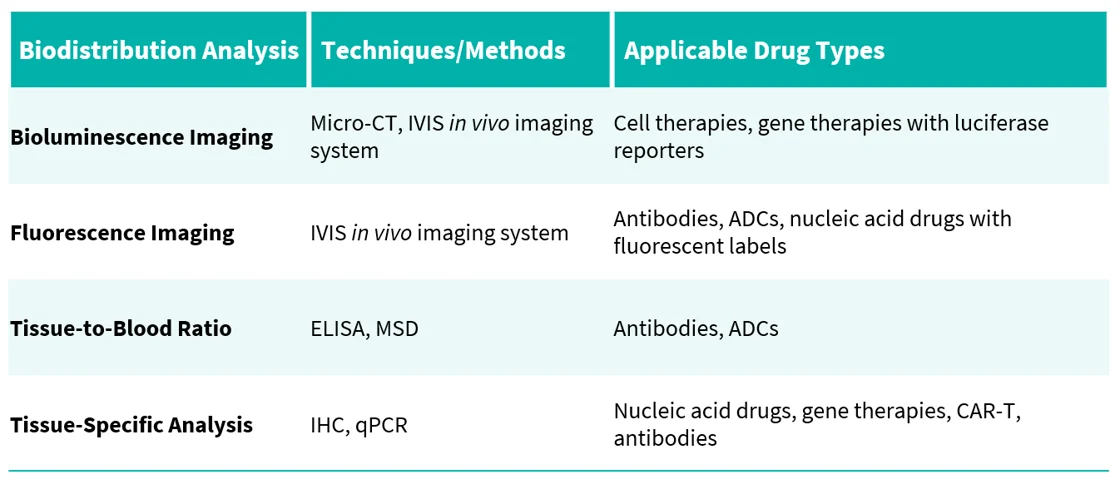
Small molecules & payloads: quantified by LC-MS/MS with high sensitivity.
Antibodies & biologics: evaluated using imaging, ligand-binding assays, or ELISA.
Antibody–drug conjugates (ADCs): require dual analysis of both antibody and cytotoxic payload.
Nucleic acid therapies (siRNA, mRNA, AAV vectors): tracked with qPCR, hybridization assays, or nanoparticle-based methods.
Cell & gene therapies (CAR-T cells, viral vectors): monitored by qPCR, flow cytometry, and molecular imaging to assess persistence and expansion.
Imaging (PET, SPECT, fluorescence, bioluminescence): enables non-invasive visualization of labeled drugs in vivo.
Mass spectrometry (LC-MS/MS, imaging MS): provides precise quantification of small molecules, payloads, and metabolites.
Immunoassays & histology (ELISA, IHC, immunofluorescence): reveal localization and quantify biologics in tissues.
Molecular assays (qPCR, digital PCR): measure nucleic acids and viral genomes.
Emerging approaches (spatial omics, imaging MS): allow single-cell resolution of drug distribution.
Every drug takes its own path, but all require clear visibility. Biodistribution analysis is more than a technical readout—it forms a cornerstone of modern drug development. By showing where therapies travel, where they persist, and where they fail to reach, biodistribution studies guide smarter drug design, optimize delivery, and help predict side effects. In today’s era of precision medicine, they are essential for creating safer, more effective, and more targeted treatments.
Biocytogen's Bio-distribution Analysis Platform |
 |
Biocytogen has established a comprehensive biodistribution analysis platform that integrates advanced analytical methods with proprietary animal models to support studies across diverse drug modalities. In addition, we have developed a series of luciferase-labeled tumor cell lines for imaging-based biodistribution analysis. |
Case Study 1: Bioluminescence Imaging |
Brain Imaging of Akaluc and Firefly Luciferase Expression From LNP-mRNA |
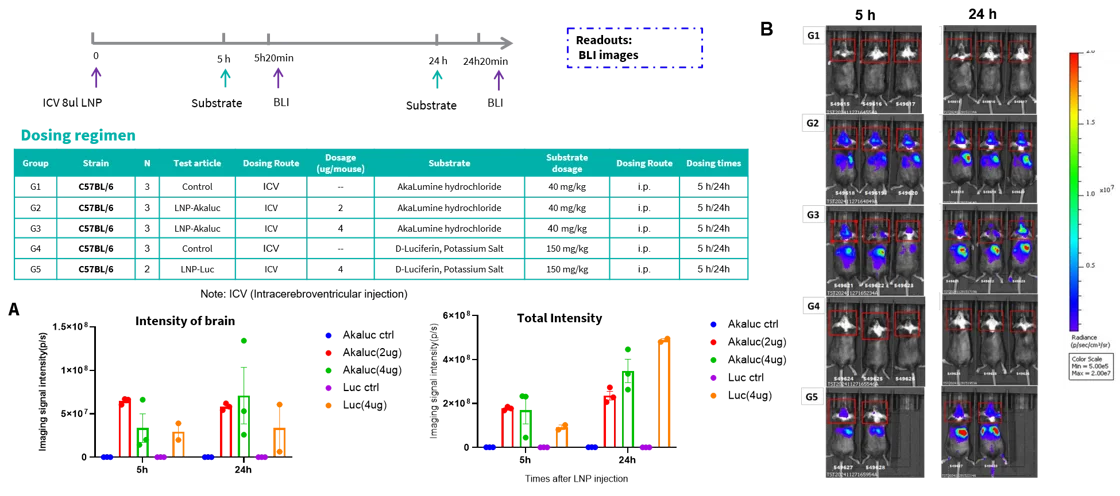 |
Akaluc bioluminescence shows superior brain specificity compared to Firefly Luciferase in brain imaging. LNPs encapsulating mRNA for Akaluc or Firefly Luciferase were administered via ICV injection into C57BL/6 female mice. Bioluminescence imaging (BLI) was performed at 5 and 24 hours post-injection. (A) Histogram of fluorescence signal values. (B) Representative in vivo imaging of mice. |
Case Study 2: Fluorescence Imaging |
OX40-mAb Biodistribution Across Organs Over Time |
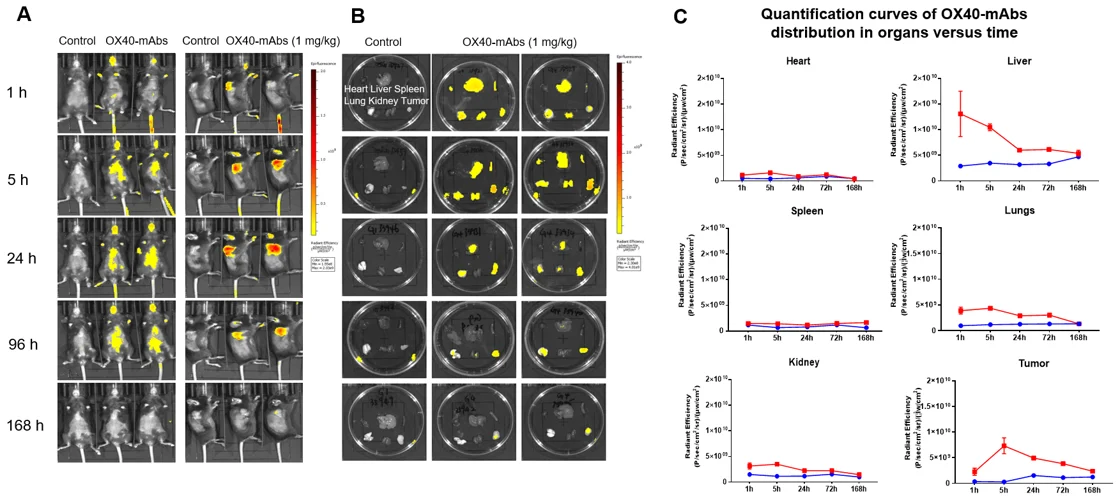 |
In vivo and ex vivo biodistribution of AF680-labeled OX40 antibody in OX40 humanized mice with MC38 tumors. B-hOX40 mice were subcutaneously inoculated with MC38 cells (5×10⁵). When tumors reached ~100 mm³, mice were intravenously injected with AF680-labeled OX40 antibody. (A) IVIS imaging shows whole-body distribution over time. (B) Ex vivo imaging of major organs and tumors confirms antibody accumulation. (C) Fluorescence quantification in heart, liver, spleen, lungs, kidneys, and tumors over time. Red line = OX40 antibody; blue line = vehicle control. Mean ± SEM. |
Brain Imaging of Fluorescence-Labeled Antibody in TFR1 Humanized Mice |
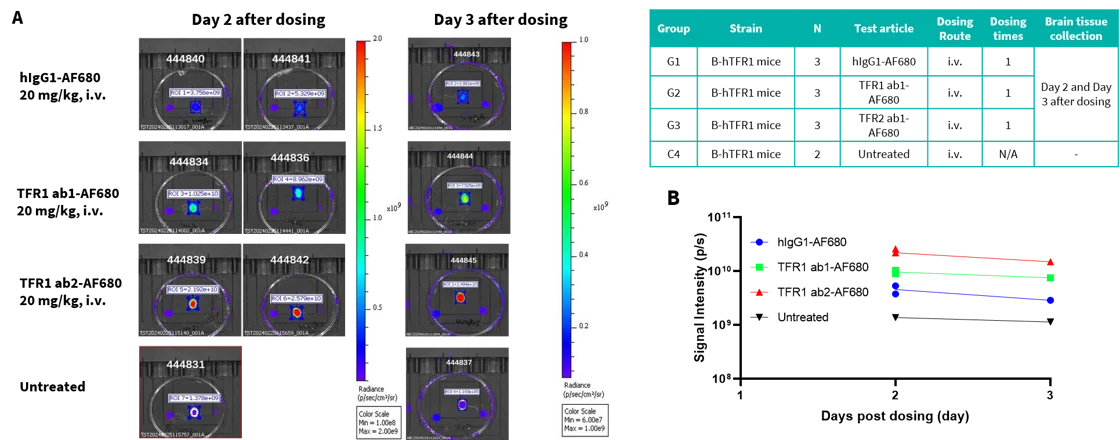 |
Brain distribution of AF680-labeled TFR1 antibody in TFR1 humanized mice assessed by IVIS imaging. B-hTFR1 mice were intravenously injected with AF680-labeled TFR1 antibody or isotype control. Mice were sacrificed on Day 2 or Day 3 post-injection, and whole brains were collected for ex vivo imaging. (A) Representative IVIS images show fluorescent signal intensity in brains at different time points. (B) Quantification demonstrates higher brain accumulation of TFR1 antibody compared to isotype control. |
Case Study 3: Tissue-to-Blood Ratio |
Active Uptake of Anti-Human CD98HC Antibody Into the Brain |
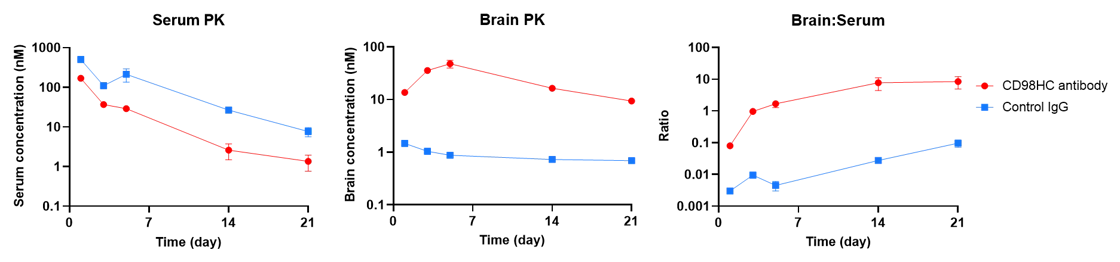 |
In vivo PK evaluation of anti-human CD98HC antibody in CD98HC humanized mice. Female B-hCD98HC mice (n=2, 8 weeks old) received control IgG (10 mpk) or anti-human CD98HC antibody (CD98BBBB-h1.L analog, monovalent, 13.3 mpk) via tail vein injection. Brain and serum samples were collected for PK analysis. Quantification included brain concentrations, serum concentrations, and brain-to-serum ratios. Mean ± SEM. |
Case Study 4: Tissue-Specific qPCR and IHC |
The Inhibitory Efficiency of AOC1001 in TfR1/DMPK Humanized Mice |
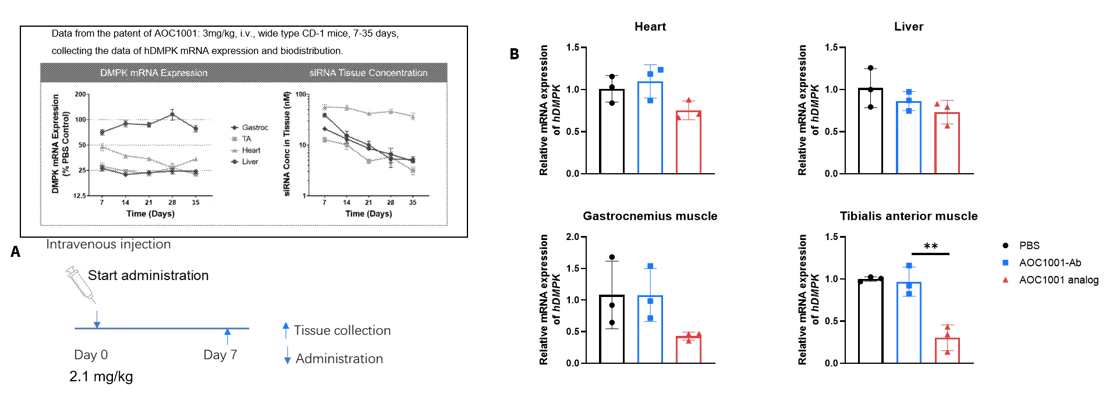 |
Inhibitory efficiency of AOC1001 in heterozygous TfR1/DMPK humanized mice. Mice received AOC1001 analog, AOC1001-Ab analog, or PBS on Day 0. On Day 7, heart, liver, gastrocnemius, and tibialis anterior muscles were collected for qPCR analysis of hDMPK mRNA. Treatment with AOC1001 analog significantly reduced hDMPK mRNA levels in gastrocnemius and tibialis anterior muscles compared to controls (antibody alone or PBS), confirming targeted delivery to muscle tissues and effective mRNA knockdown. |
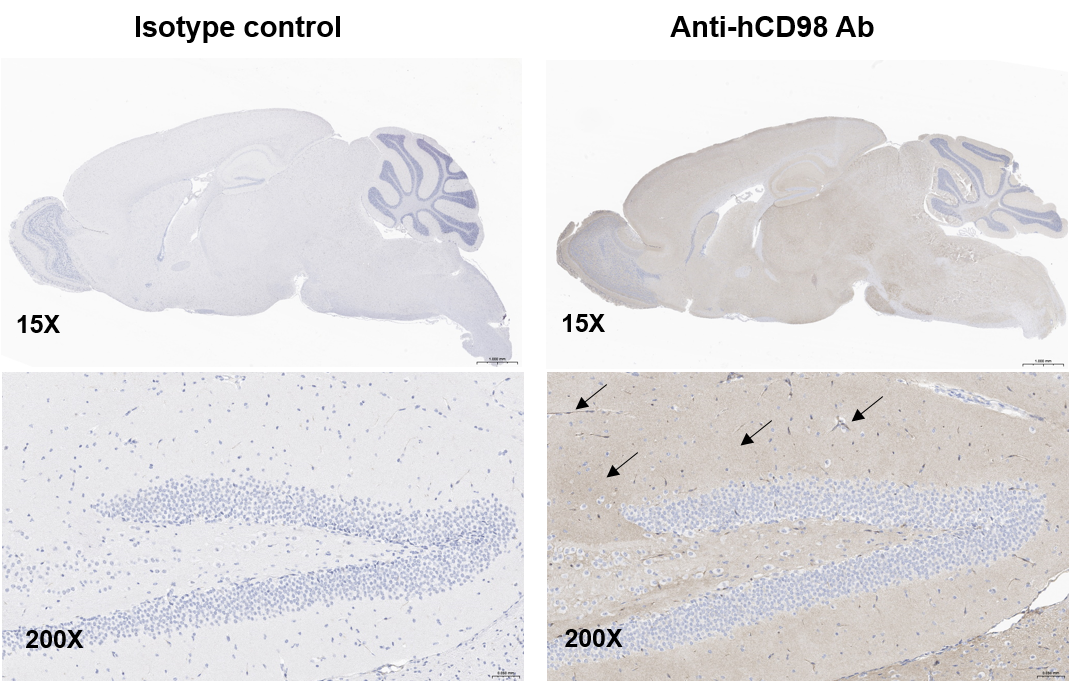
Penetration of anti-human CD98 antibody across the BBB in CD98HC humanized mice. IHC analysis of B-hCD98HC brain tissue revealed pale yellow IgG-positive signals in blood vessels and distinct yellow IgG-positive areas within the brain following anti-hCD98 antibody treatment. In contrast, isotype control brains showed no strong IgG signal.
1. What is biodistribution and why is it important?
Biodistribution tracks where a drug goes in the body, how long it stays, and if it reaches its target. It helps ensure therapies are effective and safe beyond blood-level measurements.
2. How is biodistribution different from pharmacokinetics (PK)?
PK measures drug levels mainly in blood. Biodistribution shows drug concentrations in specific organs and tissues, revealing whether the drug actually reaches its site of action.
3. What methods are used to study biodistribution?
Techniques include LC-MS/MS for small molecules, imaging and immunoassays for antibodies, dual analysis for ADCs, qPCR for nucleic acids, and flow cytometry or molecular imaging for cell and gene therapies.
4. What makes Biocytogen’s platform unique?
Biocytogen integrates advanced assays with proprietary humanized models and luciferase-labeled tumor lines, enabling precise and versatile biodistribution studies across drug modalities.
5. Which drugs benefit most from biodistribution studies?
All modalities benefit, but it is especially critical for antibodies, ADCs, nucleic acids, and cell or gene therapies that must reach hard-to-penetrate sites like the brain or tumors.