Protein Expression Analysis in the Spleen of CD8 Humanized Mice
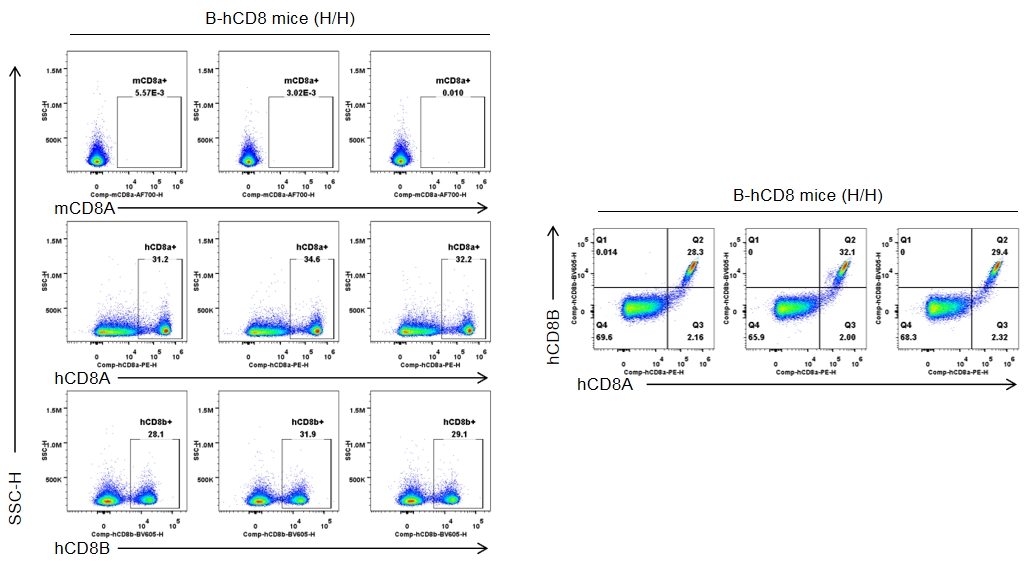
- Human CD8A and human CD8B was exclusively detectable in homozygous B-hCD8 mice but not in wild-type mice.
Strain specific CD8 expression analysis in homozygous B-hCD8 mice by flow cytometry. Splenocytes were collected from wild-type C57BL/6JNifdc mice (+/+) and homozygous B-hCD8 mice (H/H), and analyzed by flow cytometry with species-specific anti-CD8 antibody (anti-human CD8A, Biolegend, 300908; anti-mouse CD8A, Biolegend, 100730; anti-human CD8B, BD, 742392).
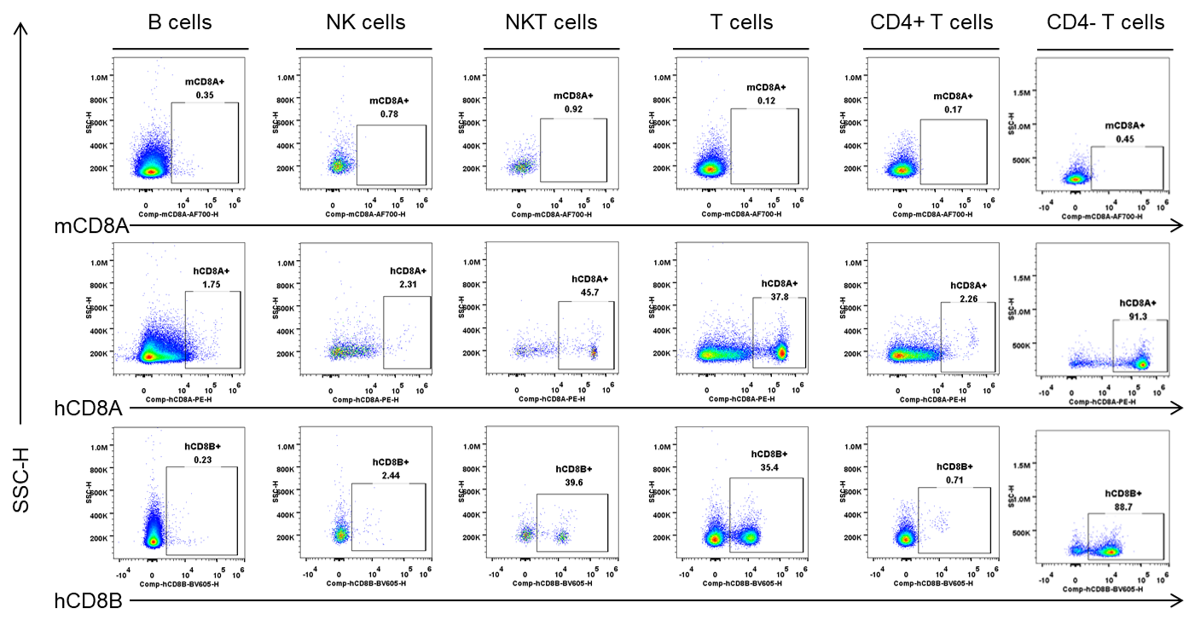
CD8 Protein Expression in spleen
- Human CD8A and CD8B were detectable in NKT cells and T cells from B-hCD8 mice, but not in the wild-type mice.
Strain specific CD8 expression analysis in homozygous B-hCD8 mice by flow cytometry. Splenocytes were collected from homozygous B-hCD8 mice (H/H, female, n=3, 9-week-old), and analyzed by flow cytometry with species-specific anti-CD8 antibody (anti-human CD8A, Biolegend, 300908; anti-mouse CD8A, Biolegend, 100730; anti-human CD8B, BD, 742392).
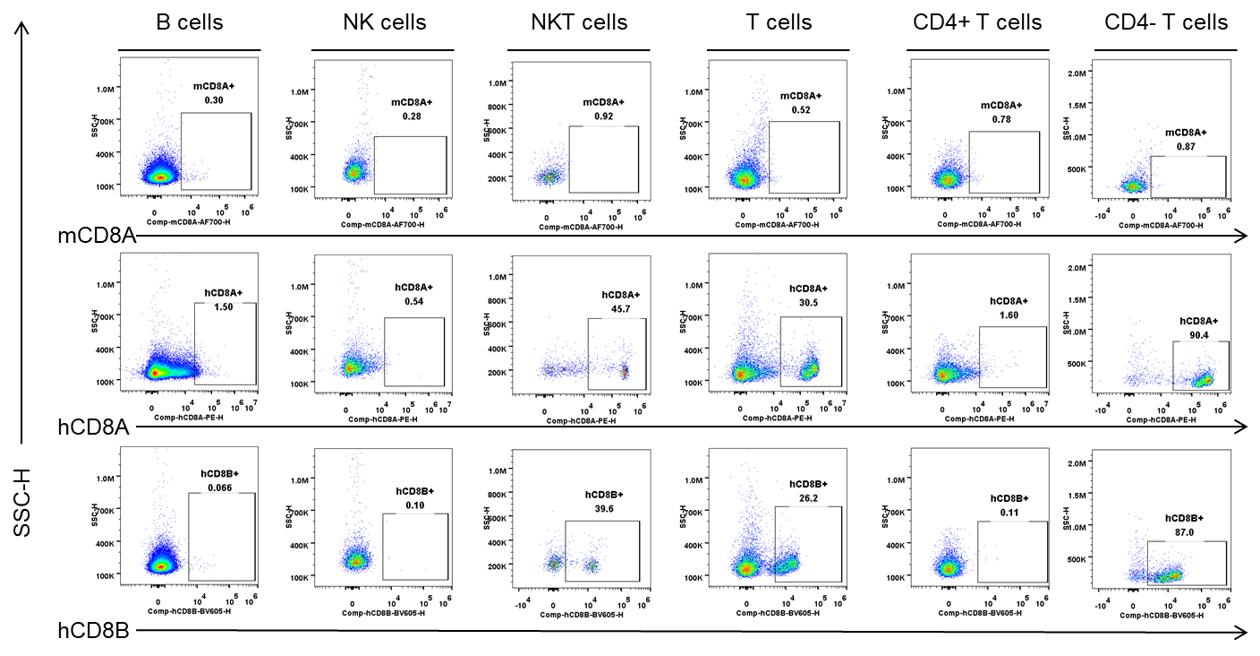
CD8 Protein Expression in blood
- Human CD8A and CD8B were detectable in NKT cells and T cells from B-hCD8 mice, but not in the wild-type mice.
Strain specific CD8 expression analysis in homozygous B-hCD8 mice by flow cytometry. Blood were collected from homozygous B-hCD8 mice (H/H, female, n=3, 9-week-old), and analyzed by flow cytometry with species-specific anti-CD8 antibody (anti-human CD8A, Biolegend, 300908; anti-mouse CD8A, Biolegend, 100730; anti-human CD8B, BD, 742392).
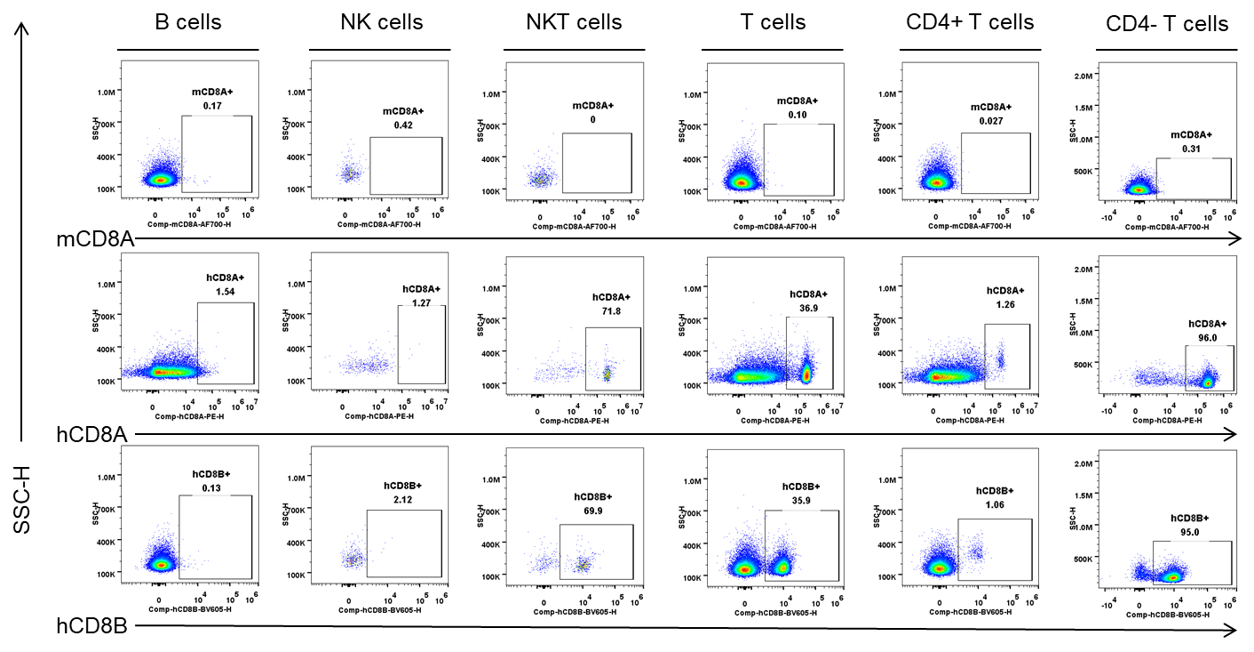
CD8 Protein Expression in lymph nodes
- Human CD8A and CD8B were detectable in NKT cells and T cells from B-hCD8 mice, but not in the wild-type mice.
Strain specific CD8 expression analysis in homozygous B-hCD8 mice by flow cytometry. Lymph nodes were collected from homozygous B-hCD8 mice (H/H, female, n=3, 9-week-old), and analyzed by flow cytometry with species-specific anti-CD8 antibody (anti-human CD8A, Biolegend, 300908; anti-mouse CD8A, Biolegend, 100730; anti-human CD8B, BD, 742392).
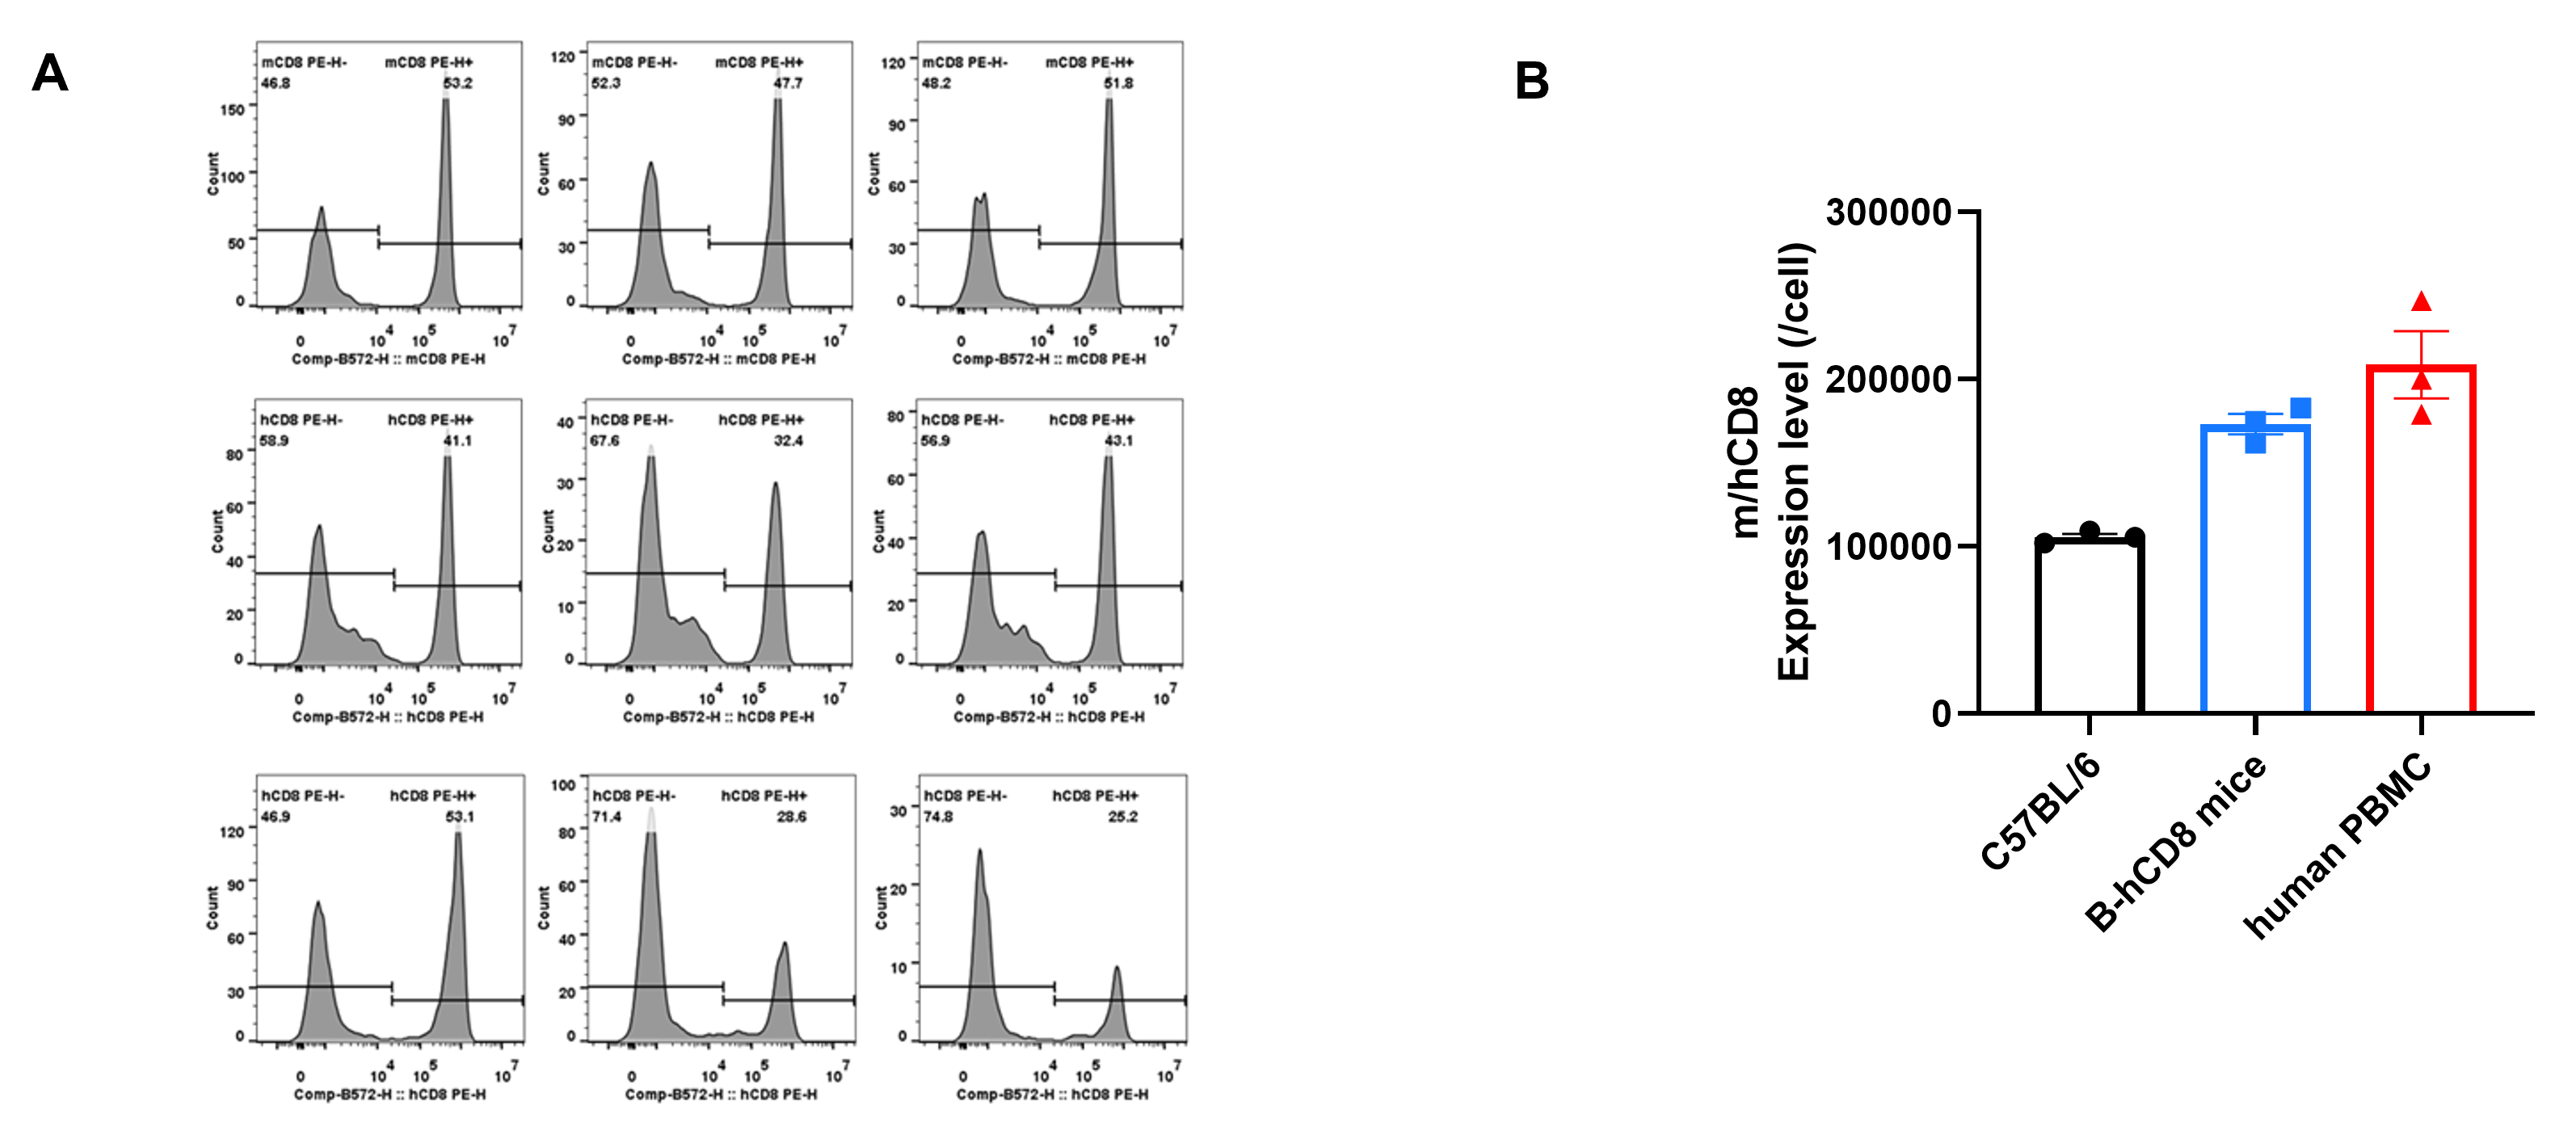
Quantitative Analysis of CD8 Proteins on the Blood CD8+ Cell Surface
- The CD8 quantitative expression on CD8+ T cells in the peripheral blood of B-hCD8 mice are closer to those observed in human PBMC than wild-type C57BL/6 mice.
Strain specific CD8 quantitative expression analysis in homozygous B-hCD8 mice by flow cytometry. The blood which collected from wild-type C57BL/6 mice (+/+), homozygous B-hCD8 mice (H/H, female, n=3, 8-week-old) and human PBMC were analyzed by Quantum™ Simply Cellular® (Bangs Labs, 815 & 817) with species-specific anti-CD8 antibody (anti-human CD8A, Biolegend, 300908; anti-mouse CD8A, Biolegend, 100708).
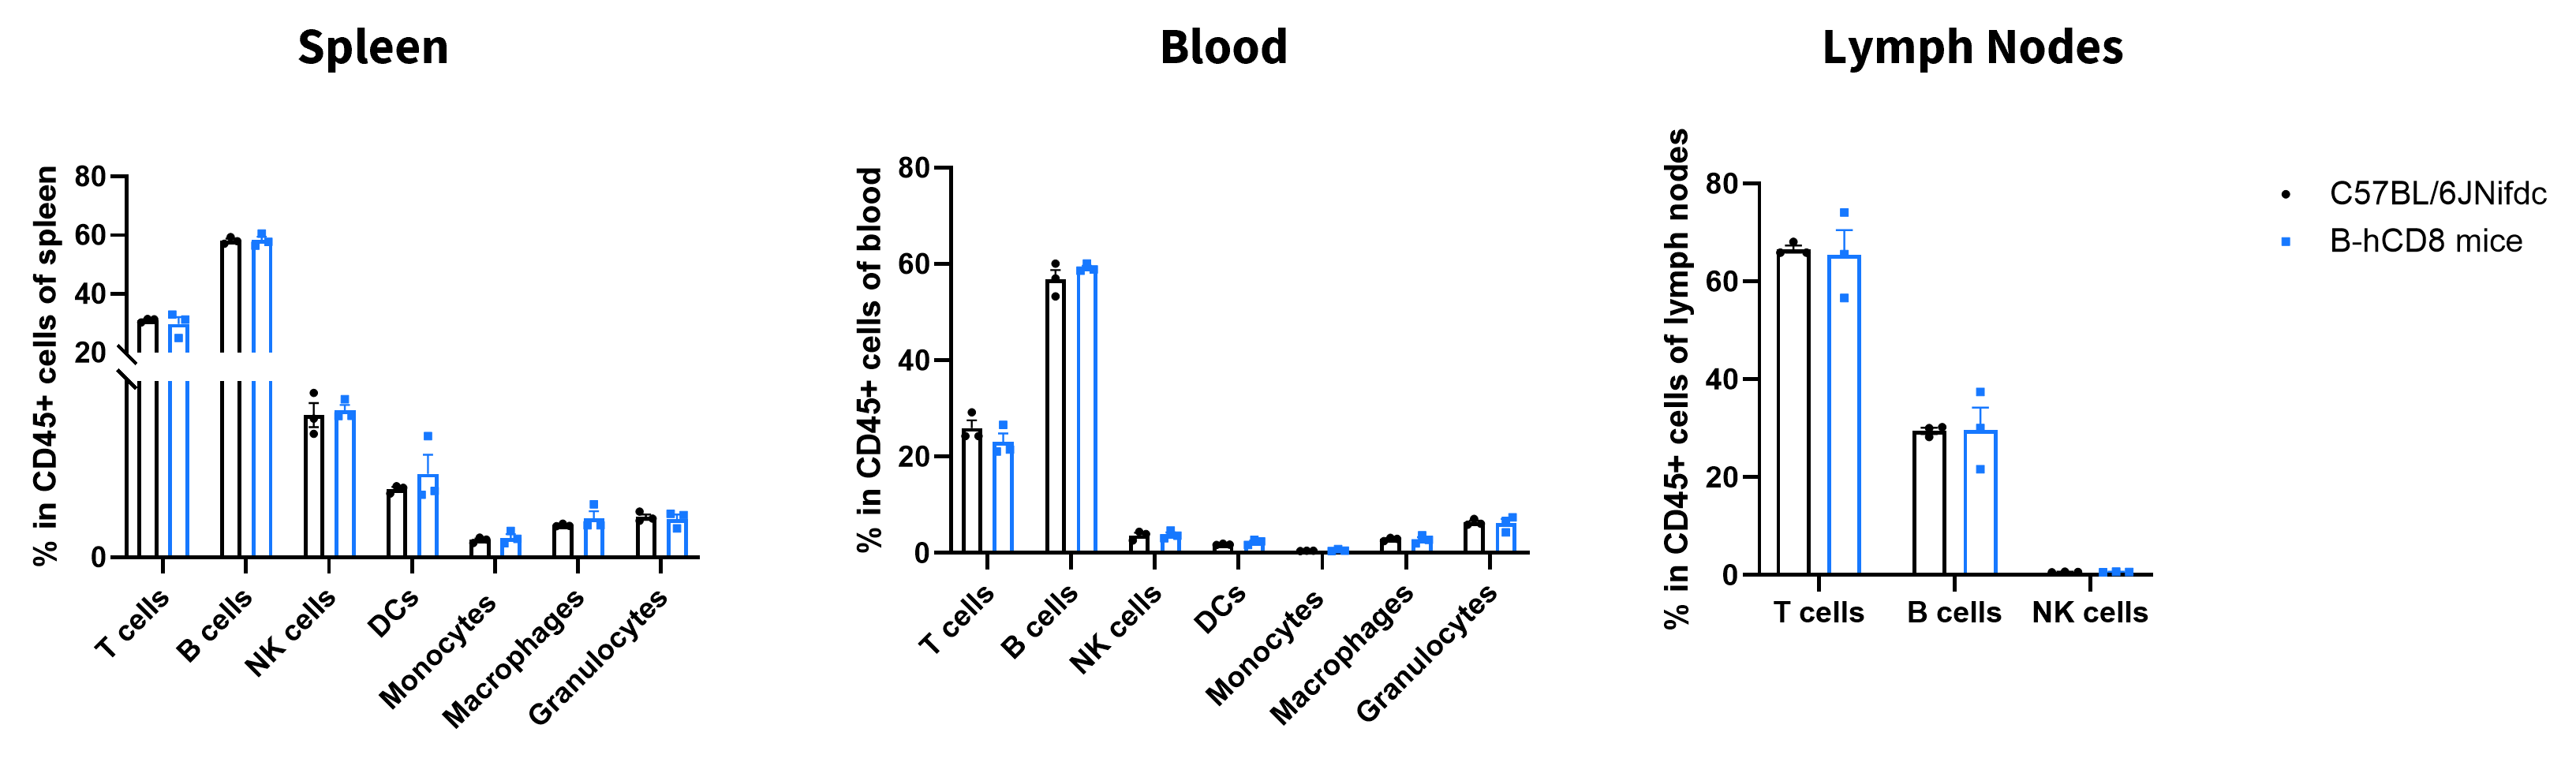
Analysis of Leukocyte Subpopulations
- The percentages of T cells, B cells, NK cells, DCs, neutrophils, monocytes, and macrophages in homozygous B-hCD8 mice are similar to those in C57BL/6JNifdc mice.
- Humanization of CD8 does not affect normal immune cell development or distribution.
Analysis of leukocyte subpopulations by flow cytometry in immune organs and blood. Splenocytes, peripheral blood, and lymph nodes were isolated from female C57BL/6JNifdc and B-hCD8 mice (female, 9-week-old, n=3). Single live cells were gated on the CD45⁺ population and analyzed by flow cytometry as indicated. Values are expressed as mean ± SEM.
Analysis of T Cell Subpopulations
- The proportions of CD4⁺ T cells, CD8⁺ T cells, and Tregs in homozygous B-hCD8 mice are comparable to those in C57BL/6JNifdc mice.
- Humanization of CD8 does not affect normal T cell development, differentiation, or distribution.
Analysis of T-cell subpopulations by flow cytometry in immune organs and blood. Splenocytes, peripheral blood, and lymph nodes were isolated from female C57BL/6JNifdc and B-hCD8 mice (female, 9-week-old, n = 3). Single live cells were gated on the T-cell population and analyzed by flow cytometry as indicated. Values are expressed as mean ± SEM.
Functional Validation
- B-hCD8 mice have normal T cell immunogenic function in OVA-induced immune responses.
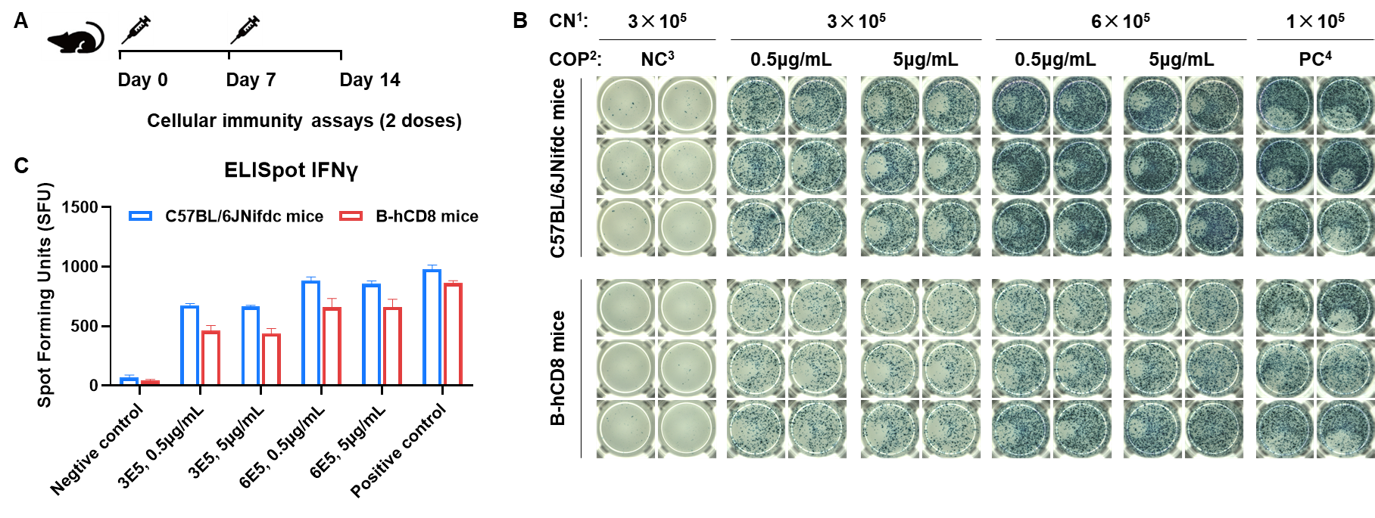
Detection of OVA-induced immune responses in B-hCD8 mice by IFN-γ ELISpot assay. (A) Scheme of OVA immunization and testing. Female wild-type C57BL/6JNifdc mice and B-hCD8 mice at the age of 9–10 weeks were immunized with intraperitoneal injection of 0.5 mg of OVA protein (Sigma, A5503-25MG) and 50 μg poly (I:C) (InvivoGen, tlrl-pic). Mice were immunized with OVA two times at 1-week interval. One week after the last immunization, mice were sacrificed. The splenocytes were extracted, stimulated with OVA peptide257–264, or no peptide as negative control (NC), or Cell Activation Cocktail (without Brefeldin A), (Biolegend, 42330) as positive control, and then measured for IFN-γ secretion. No significant difference in body weight among groups (Data was not shown). (B) Representative results showing stimulation of splenocytes harvested from immunized mice with negative control, or OVA peptide257–264, or positive control in duplicates. (C) Summary of results. 1, CN: Cell number. 2, COP: Concentration of the peptide. 3, NC: negative control. 4, PC: positive control.
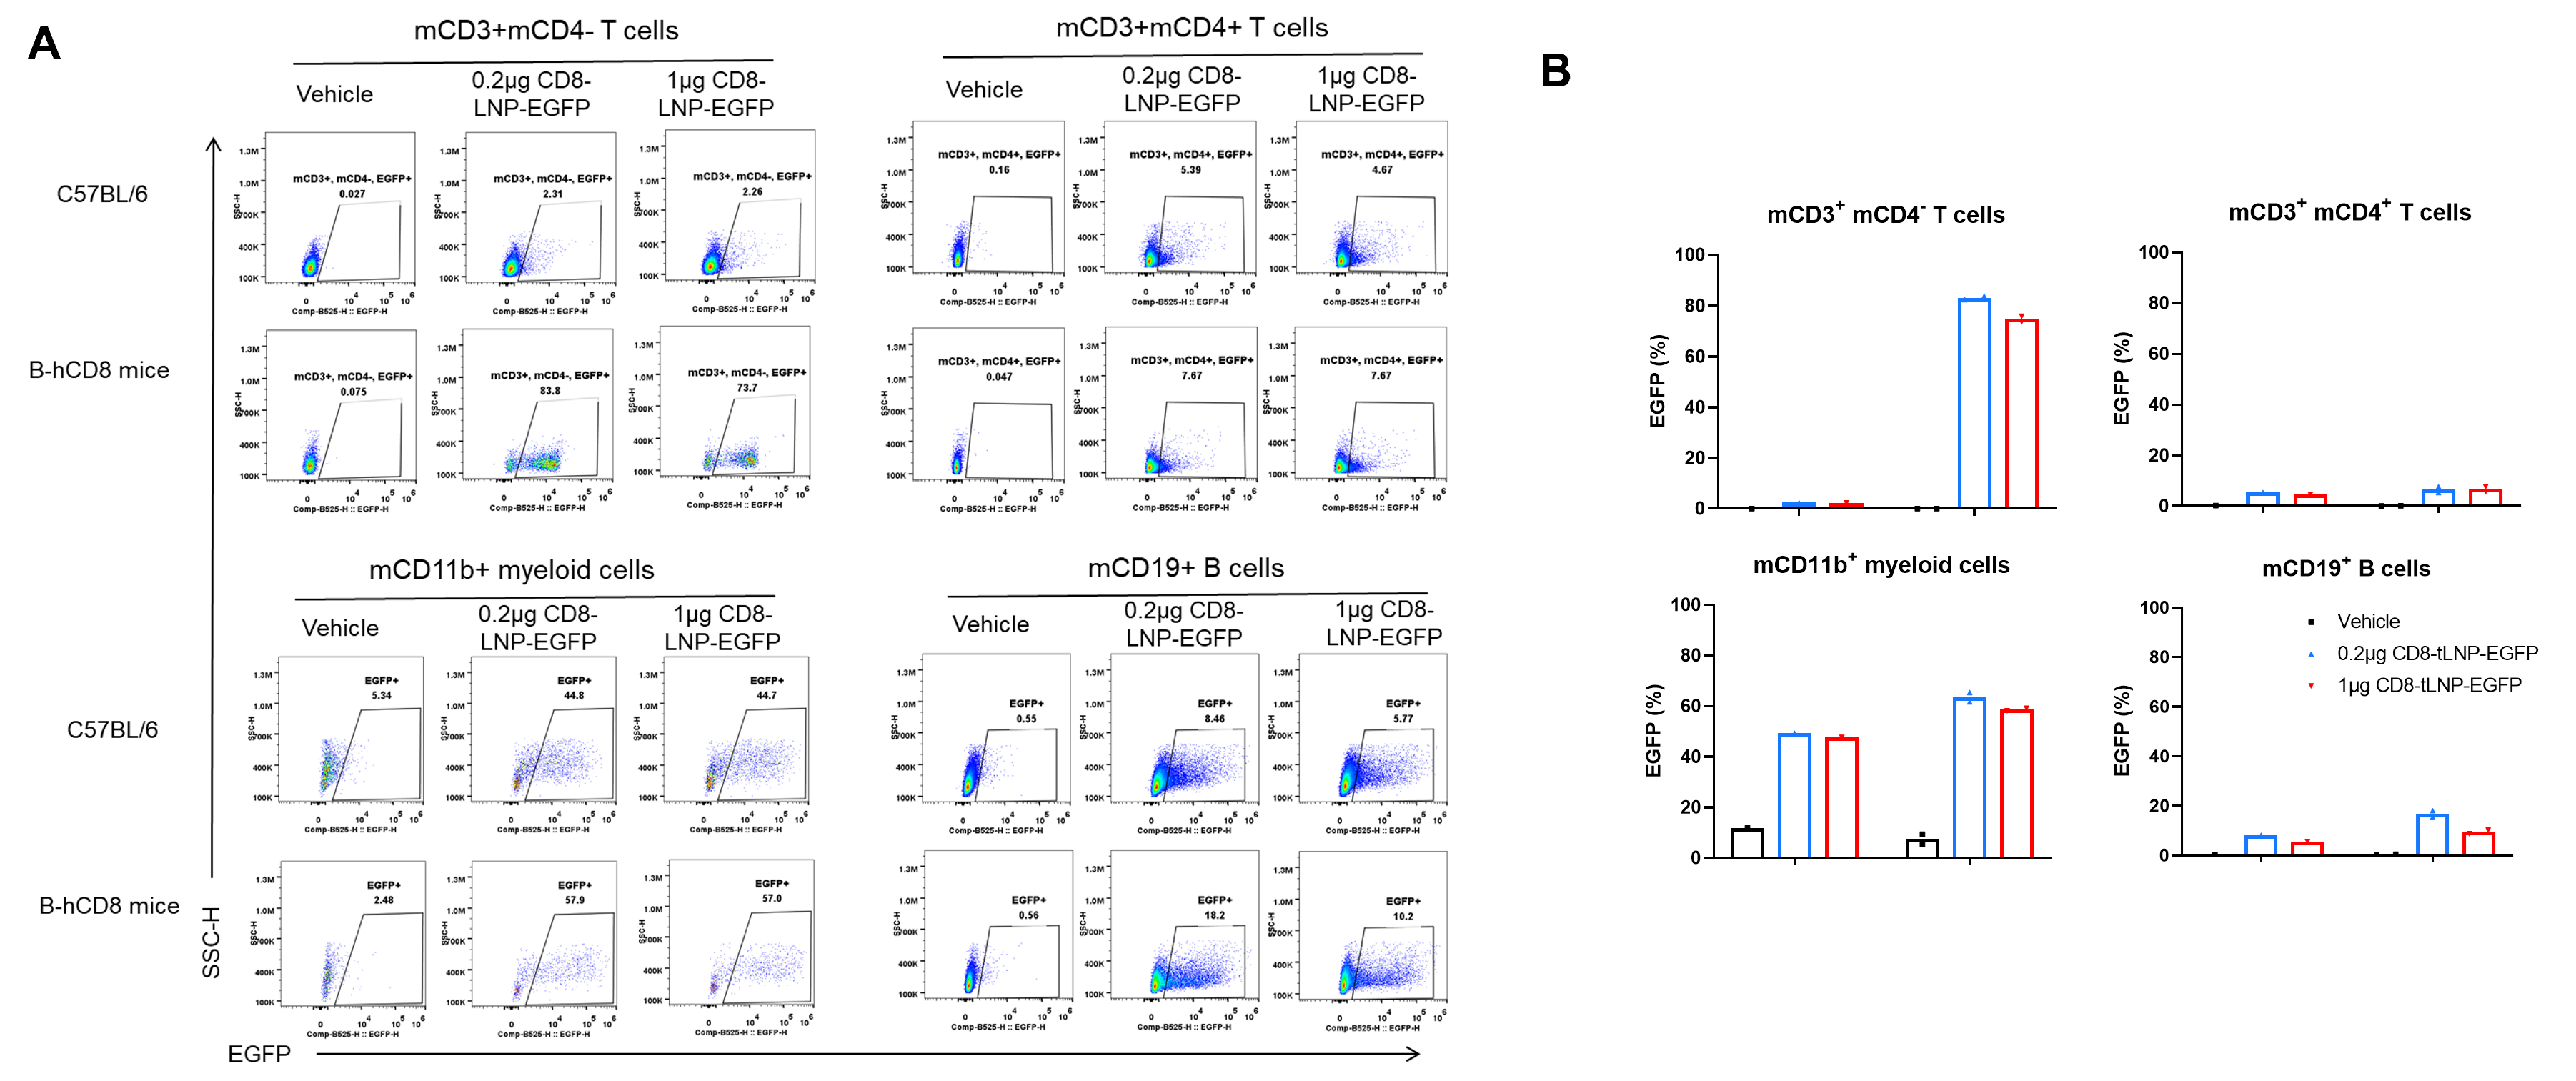
Delivery Assessment of CD8‑tLNP in B‑hCD8 mice in vitro
- CD8+ T cells from B-hCD8 mice demonstrate highly efficient and specific delivery of CD8-tLNPs in vitro
The efficient and specific delivery analysis of CD8-tLNP to CD8+ T cells in B-hCD8 mice. EGFP expression in mCD3+ mCD4- T cells, mCD3+ mCD4+ T cells, mCD11b+ myeloid cells and mCD19+ B cells. Murine splenocytes were isolated from the C57BL/6 mice and B-hCD8 mice (n=2) , stimulated with CD8‑tLNP‑EGFP for 24 hours in vitro. (A) Flow Cytometry. (B) Statistical Graph.
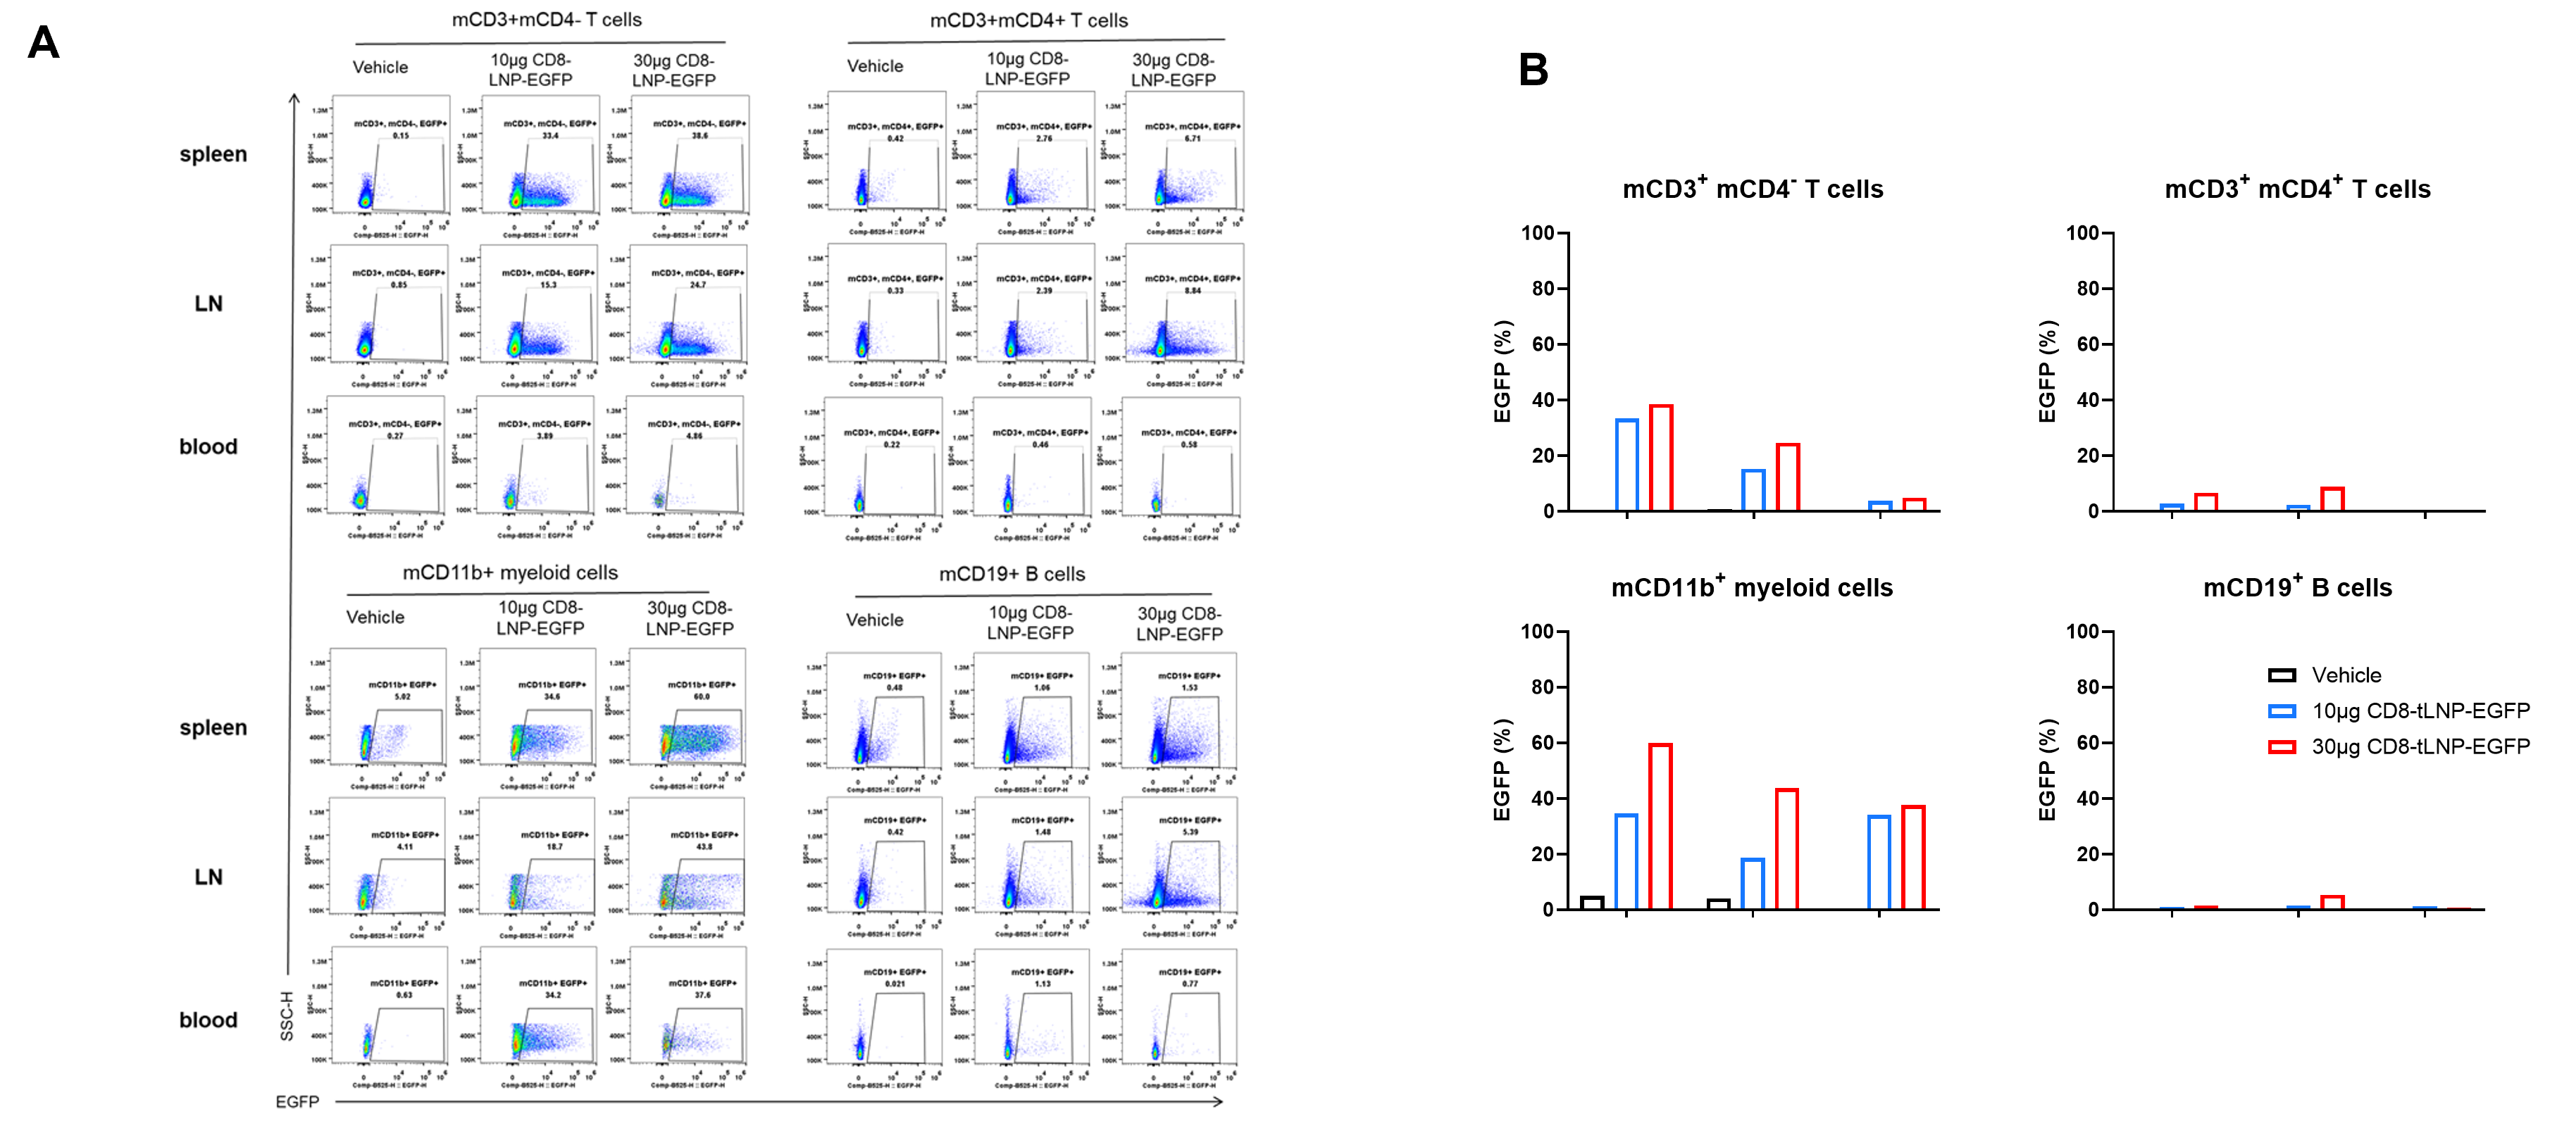
Delivery Assessment of CD8‑tLNP in B‑hCD8 mice in vivo
- CD8+ T cells from B-hCD8 mice demonstrate highly efficient and specific delivery of CD8-tLNPs in vivo
The efficient and specific delivery analysis of CD8-tLNP to CD8+ T cells in B-hCD8 mice. EGFP expression in mCD3+ mCD4- T cells, mCD3+ mCD4+ T cells, mCD11b+ myeloid cells and mCD19+ B cells 24 hours after intravenous dosing of CD8-tLNP-EGFP in B-hCD8 mice (n=1). (A) Flow Cytometry. (B) Statistical Graph.
The OVA induced immune responses in B-hCD8 mice
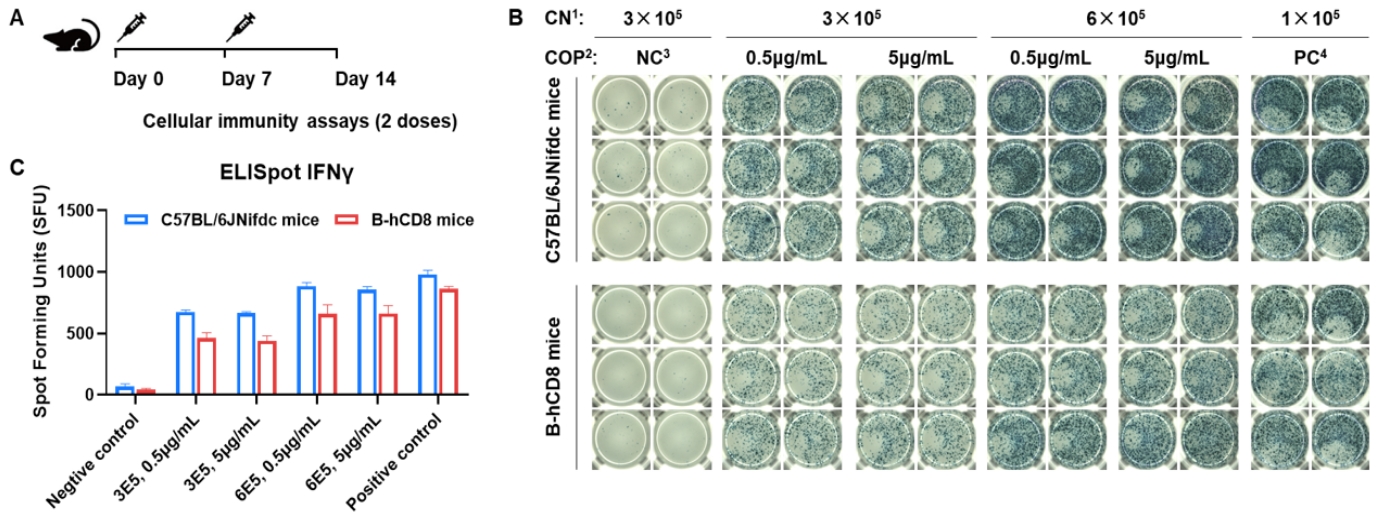
Detection of OVA-induced immune responses in CD8 humanized mice by IFN-γ ELISpot assay. (A) Scheme of OVA immunization and testing. Female wild-type C57BL/6JNifdc mice and CD8 humanized mice at 9–10 weeks of age were immunized by intraperitoneal injection of 0.5 mg OVA protein (Sigma, A5503-25MG) and 50 μg poly(I:C) (InvivoGen, tlrl-pic). Mice were immunized twice at a 1-week interval. One week after the final immunization, mice were sacrificed. Splenocytes were extracted and stimulated with OVA peptide 257–264, no peptide as a negative control (NC), or Cell Activation Cocktail (without Brefeldin A; Biolegend, 42330) as a positive control, followed by measurement of IFN-γ secretion. No significant difference in body weight was observed among groups (data not shown). (B) Representative results show splenocyte stimulation with negative control, OVA peptide 257–264, or positive control in duplicates. (C) Summary of results. These data indicate that CD8 humanized mice have normal T-cell immunogenic function. 1, CN: Cell number. 2, COP: Concentration of the peptide. 3, NC: Negative control. 4, PC: Positive control.
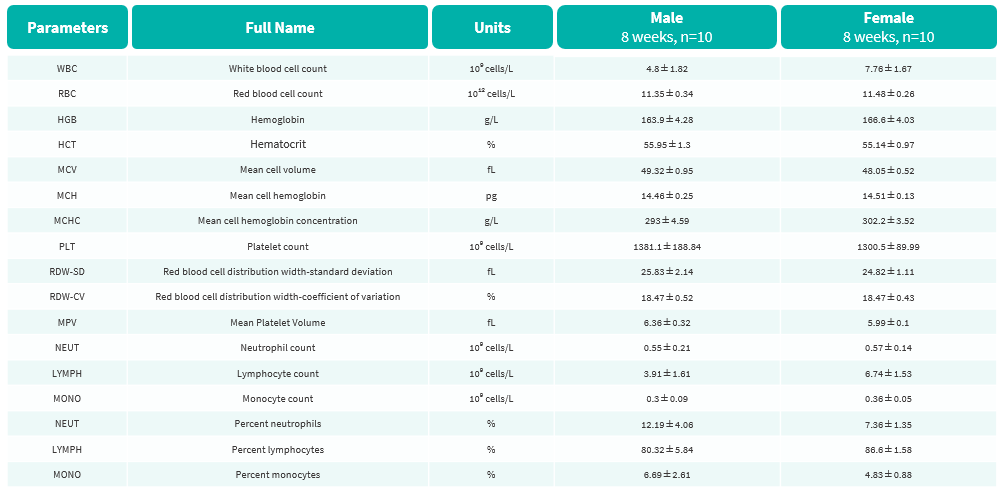
Hematology Analysis
- No significant differences were observed compared with wild-type mice.
Complete blood count (CBC) of B-hCD8 mice. Values are expressed as mean ± SD.
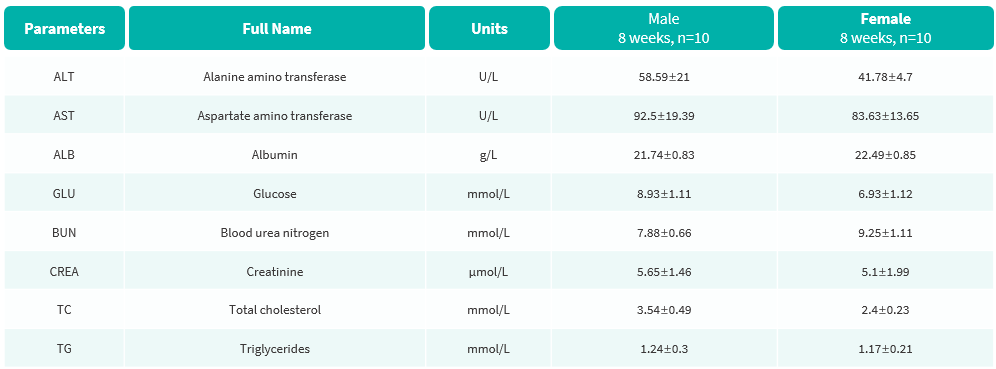
Blood Biochemical Analysis
- No significant differences were observed compared with wild-type mice.
Blood biochemical parameters of B-hCD8 mice are shown. Values are expressed as mean ± SD.
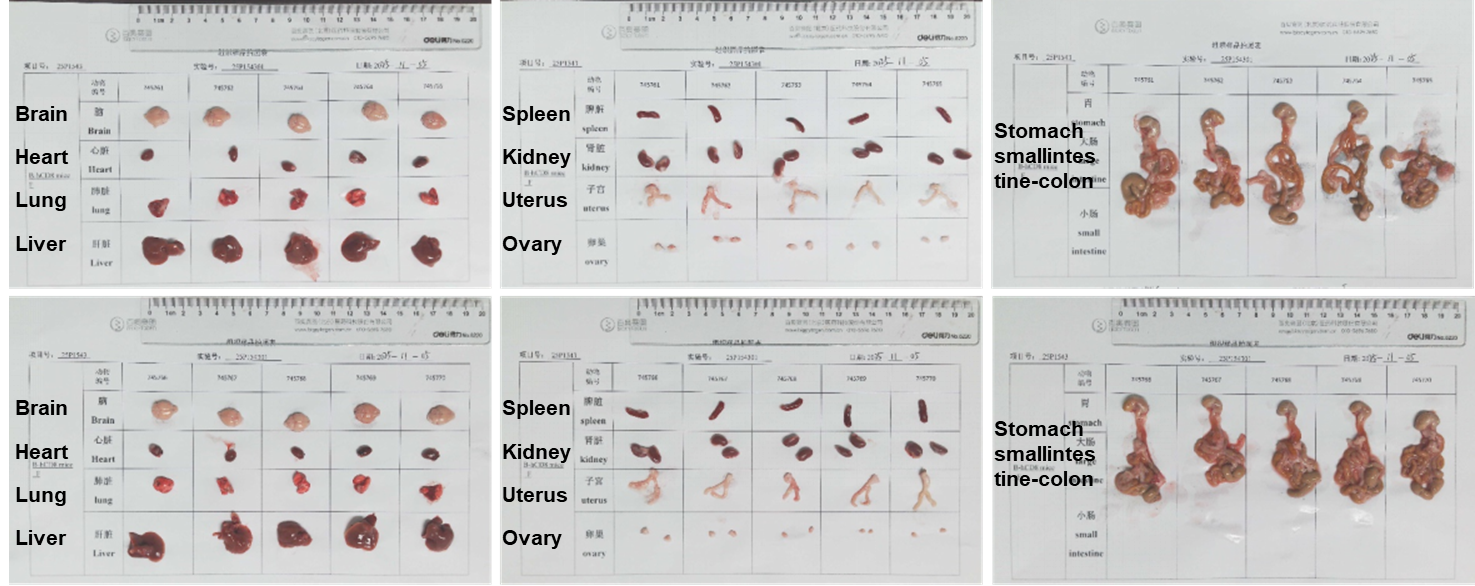
Gross Organ Anatomy (Female)
- No abnormalities were observed.
Organs of female B-hCD8 mice (12-week-old, n = 10).
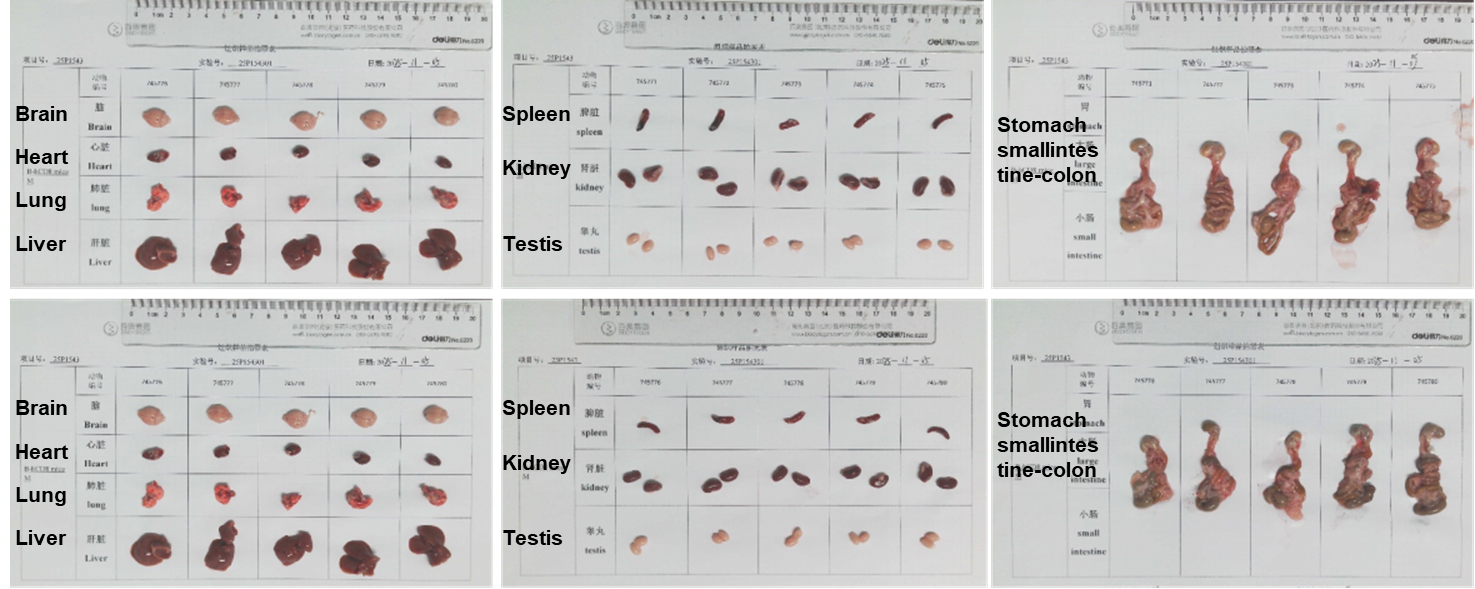
Gross Organ Anatomy (Male)
- No abnormalities were observed.
Organs of male B-hCD8 mice (12-week-old, n = 10).
Organ Weight
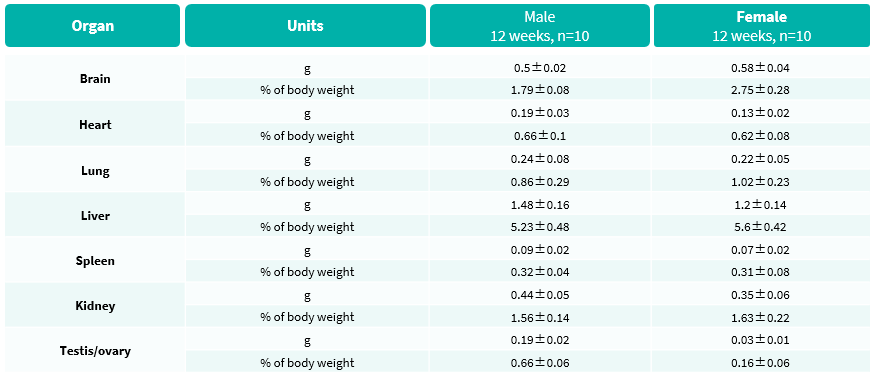
No abnormalities were observed.
Average weights of major organs in B-hCD8 mice.
Histopathological Analysis
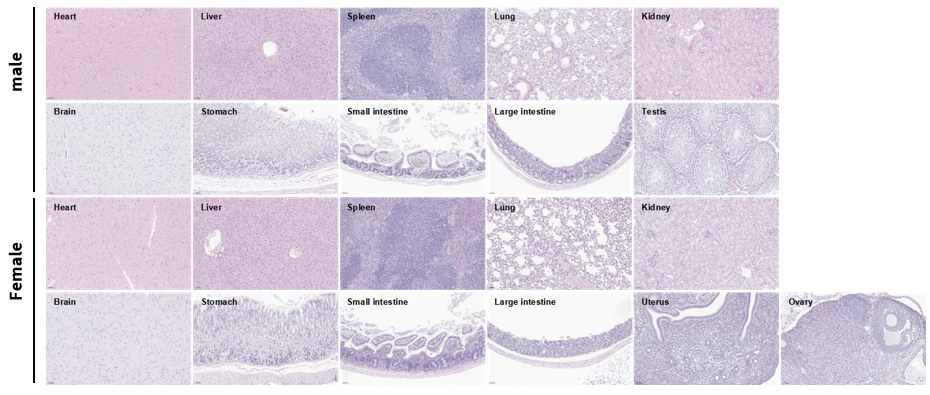
- No obvious abnormalities were observed in any organs examined (heart, liver, spleen, lung, kidney, brain, stomach, small intestine, large intestine, testis, uterus , ovary).
Histopathological analysis of organs in B-hCD8 mice. Major organs from B-hCD8 mice were collected at 8 weeks of age and analyzed by H&E staining (male, n = 10; female, n = 10).
Efficacy Evaluation of anti-PD-1 antibody between C57BL/6 mice and B-hCD8 mice
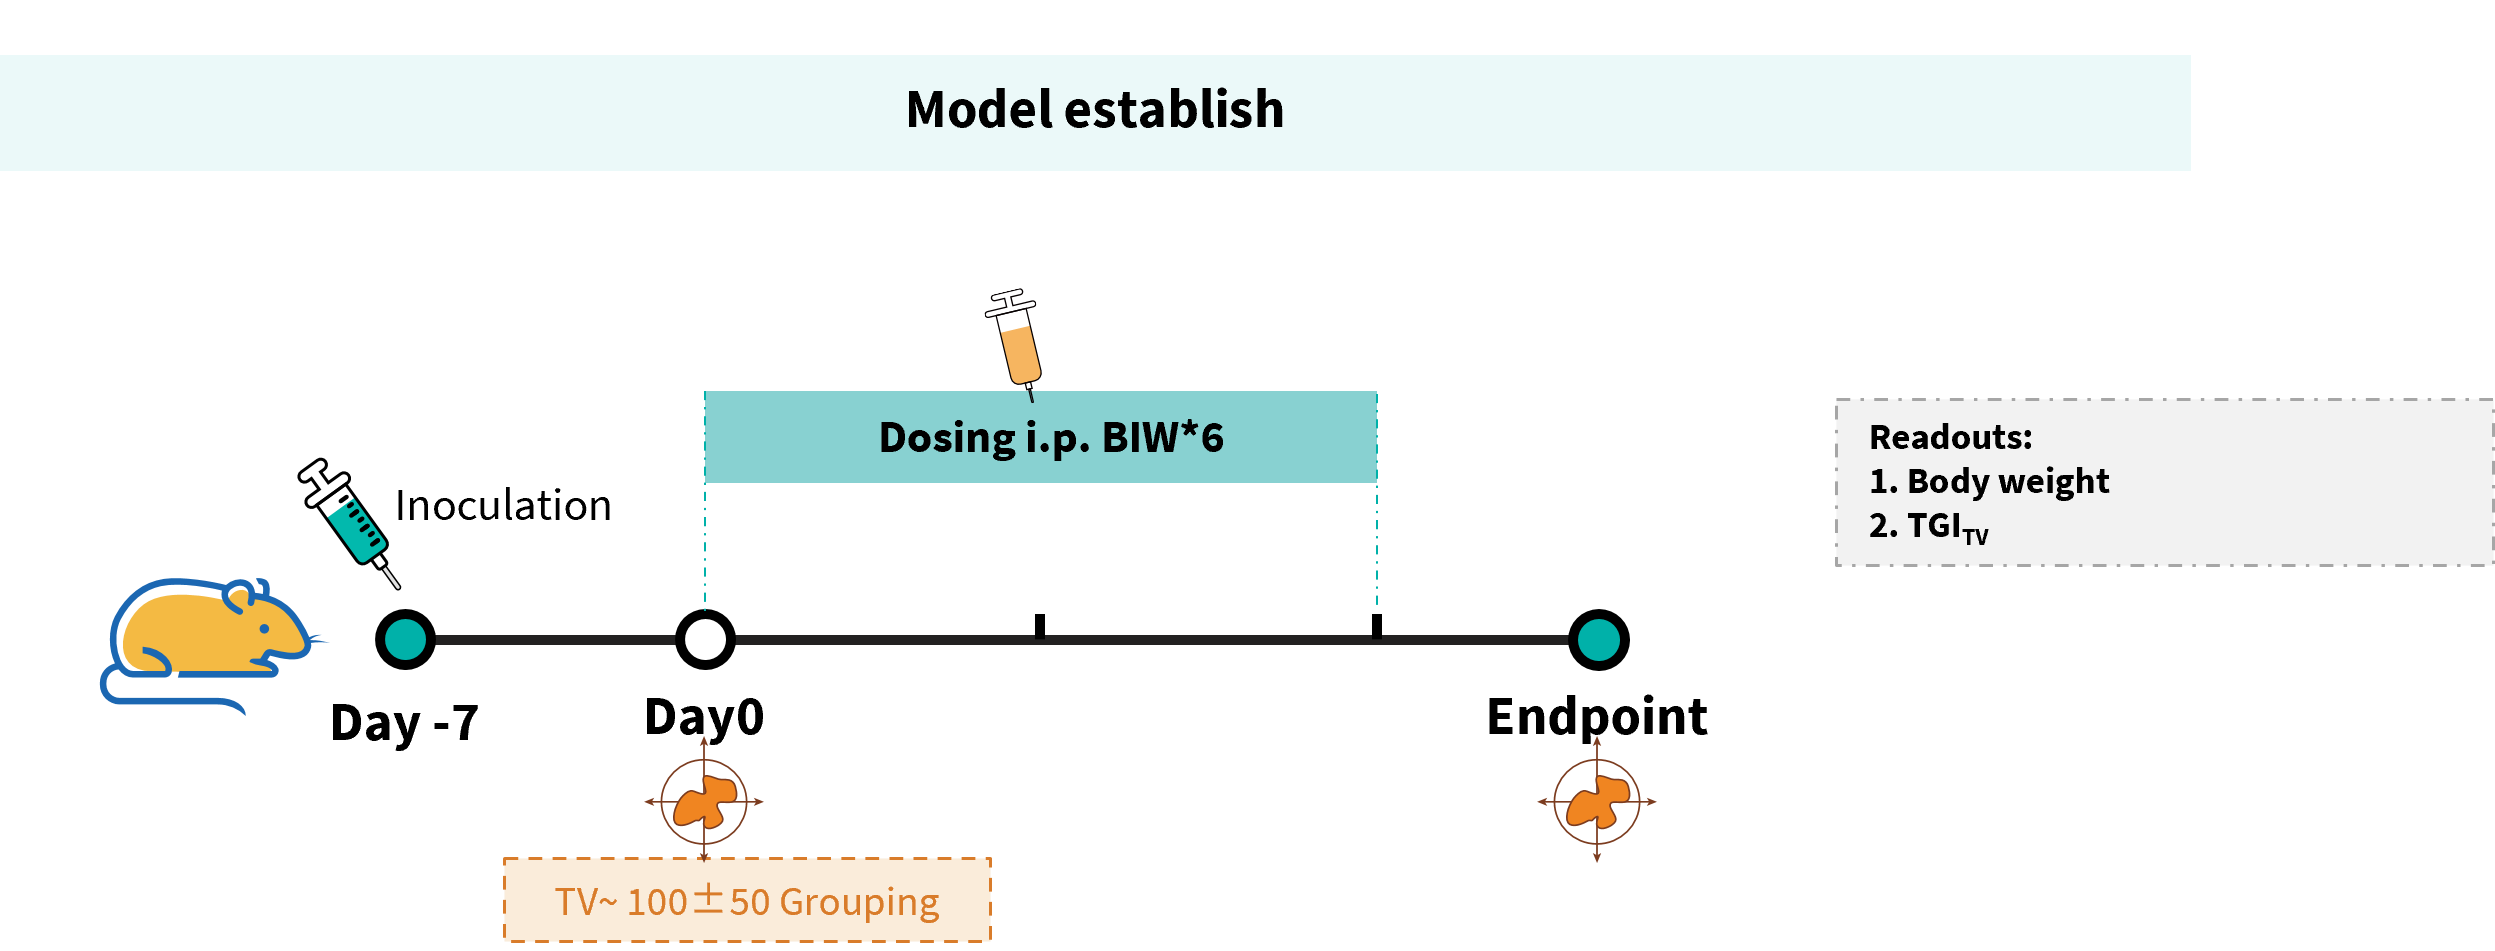
Comparison of anti-PD-1 antibody efficacy between C57BL/6 mice and B-hCD8 mice in a MC38 tumor model. 5×10⁵ MC38 cells were subcutaneously implanted into both C57BL/6 mice and B-hCD8 mice (female, 7–week-old, n=6). Mice were grouped when tumor volume reached approximately 100 mm³, at which time they were injected intraperitoneally with anti-mouse PD-1 antibodies.
Efficacy Evaluation of anti-PD-1 Antibody between C57BL/6 mice and B-hCD8 mice
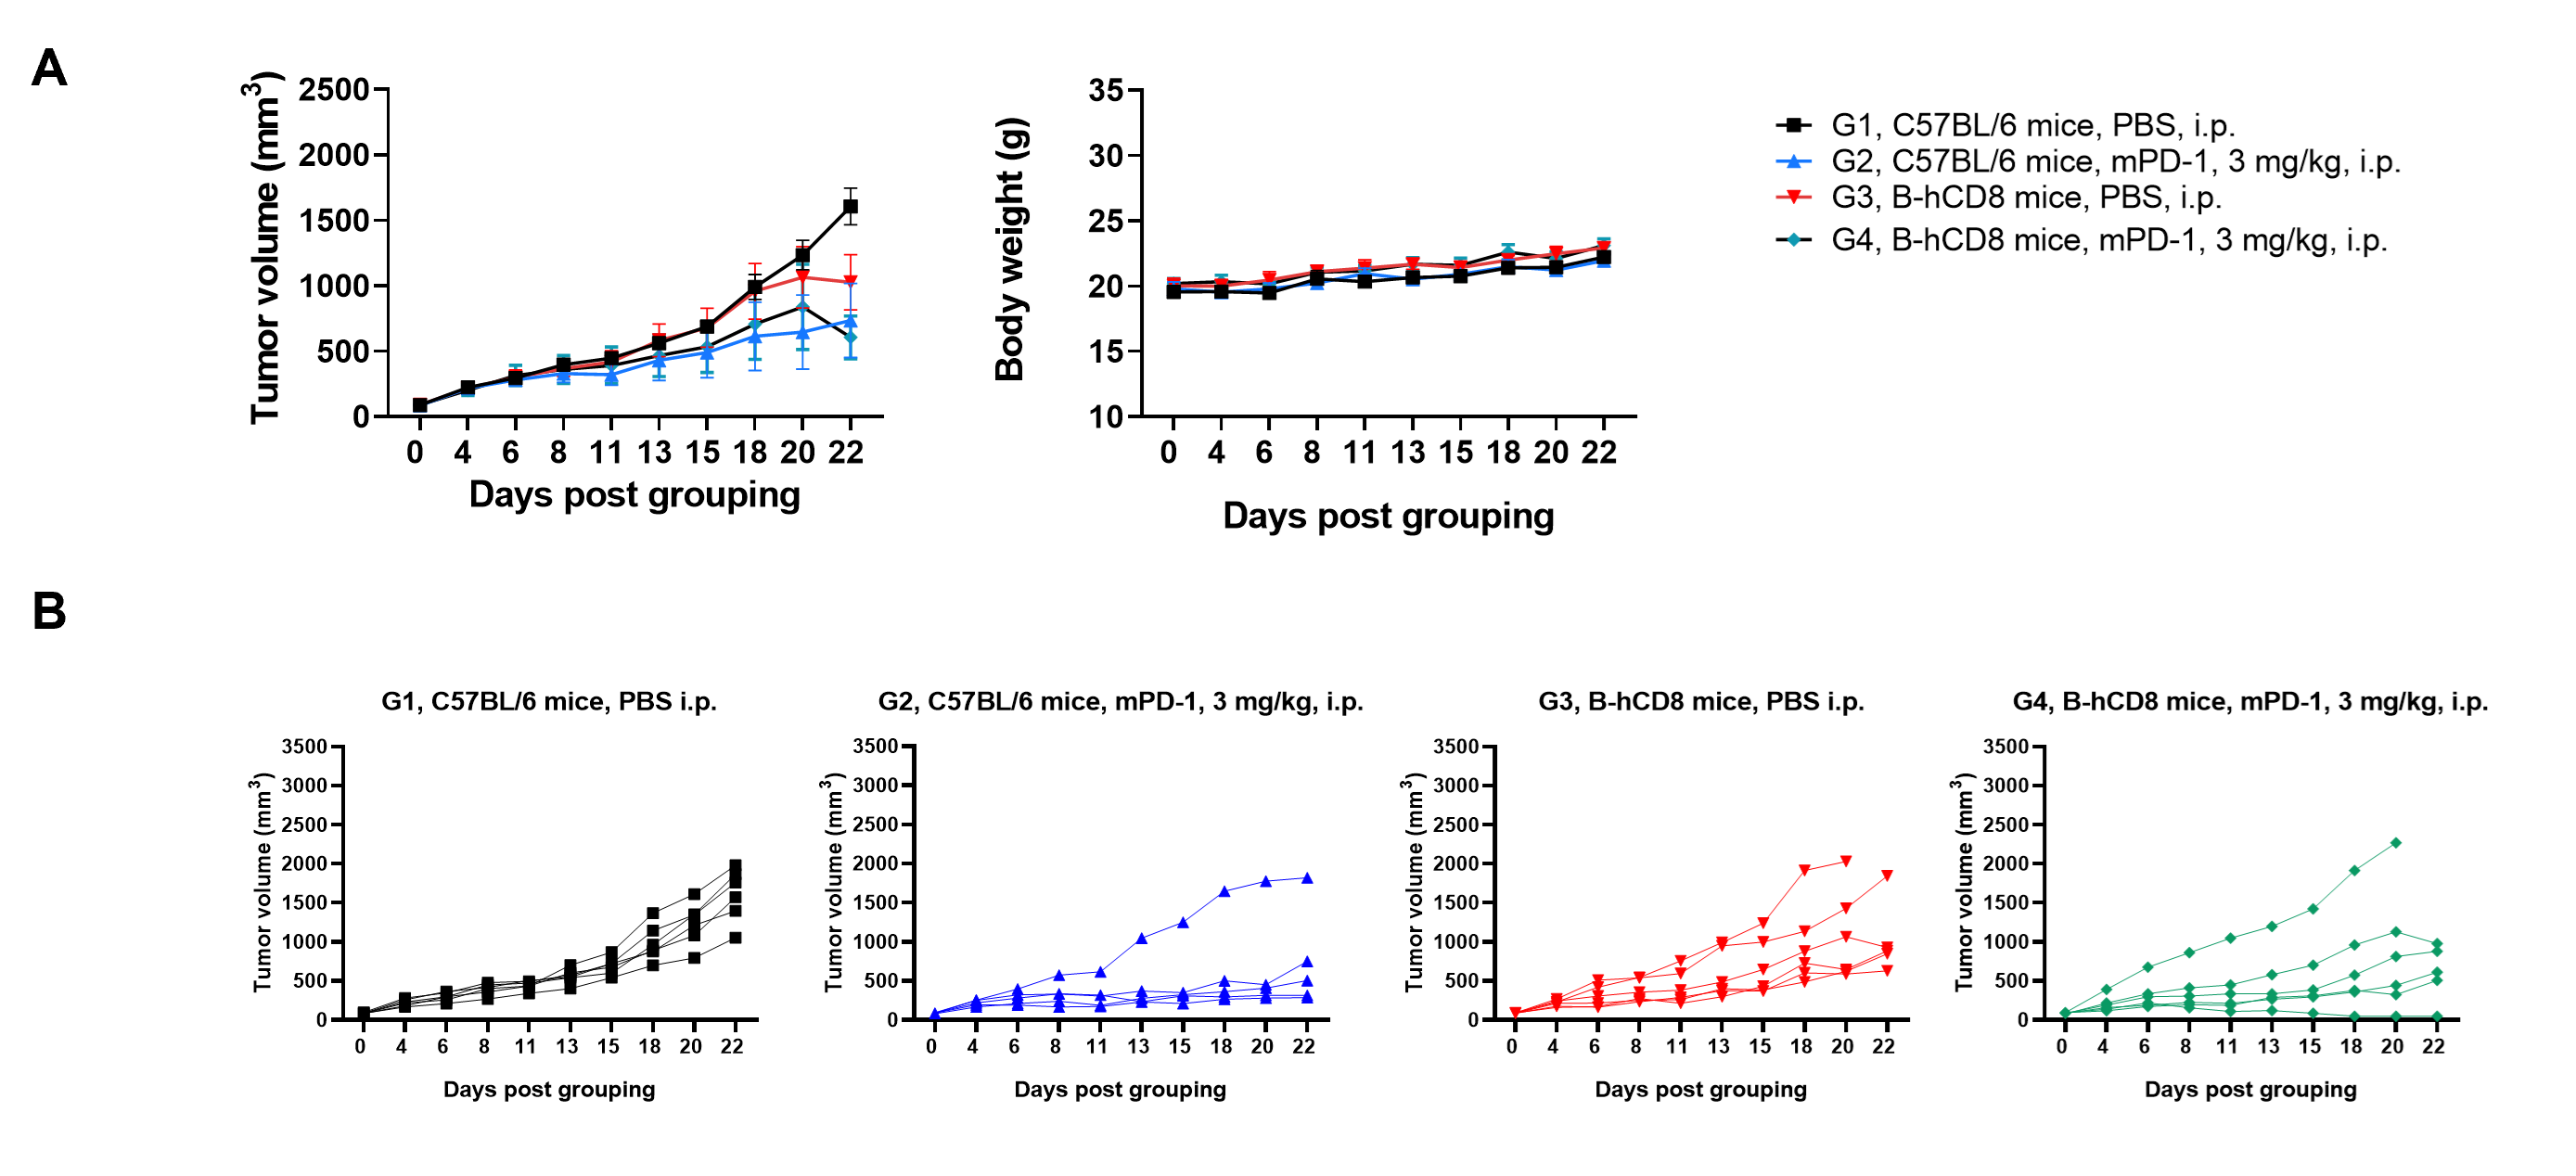
- B-hCD8 mice exhibited anti-tumor efficacy comparable to wild-type C57BL/6JNifdc mice, confirming its functional competence in mediating tumor cell killing
Efficacy of anti-mouse PD-1 antibodies in B-hCD8 mice. (A) Tumor growth curves and body weight changes during treatment. (B) Tumor growth curves from individual mice. Values are expressed as mean ± SEM.
Evaluating the CD8+T cell-Dependent Activity of anti-PD-1 Therapy in B-hCD8 mice
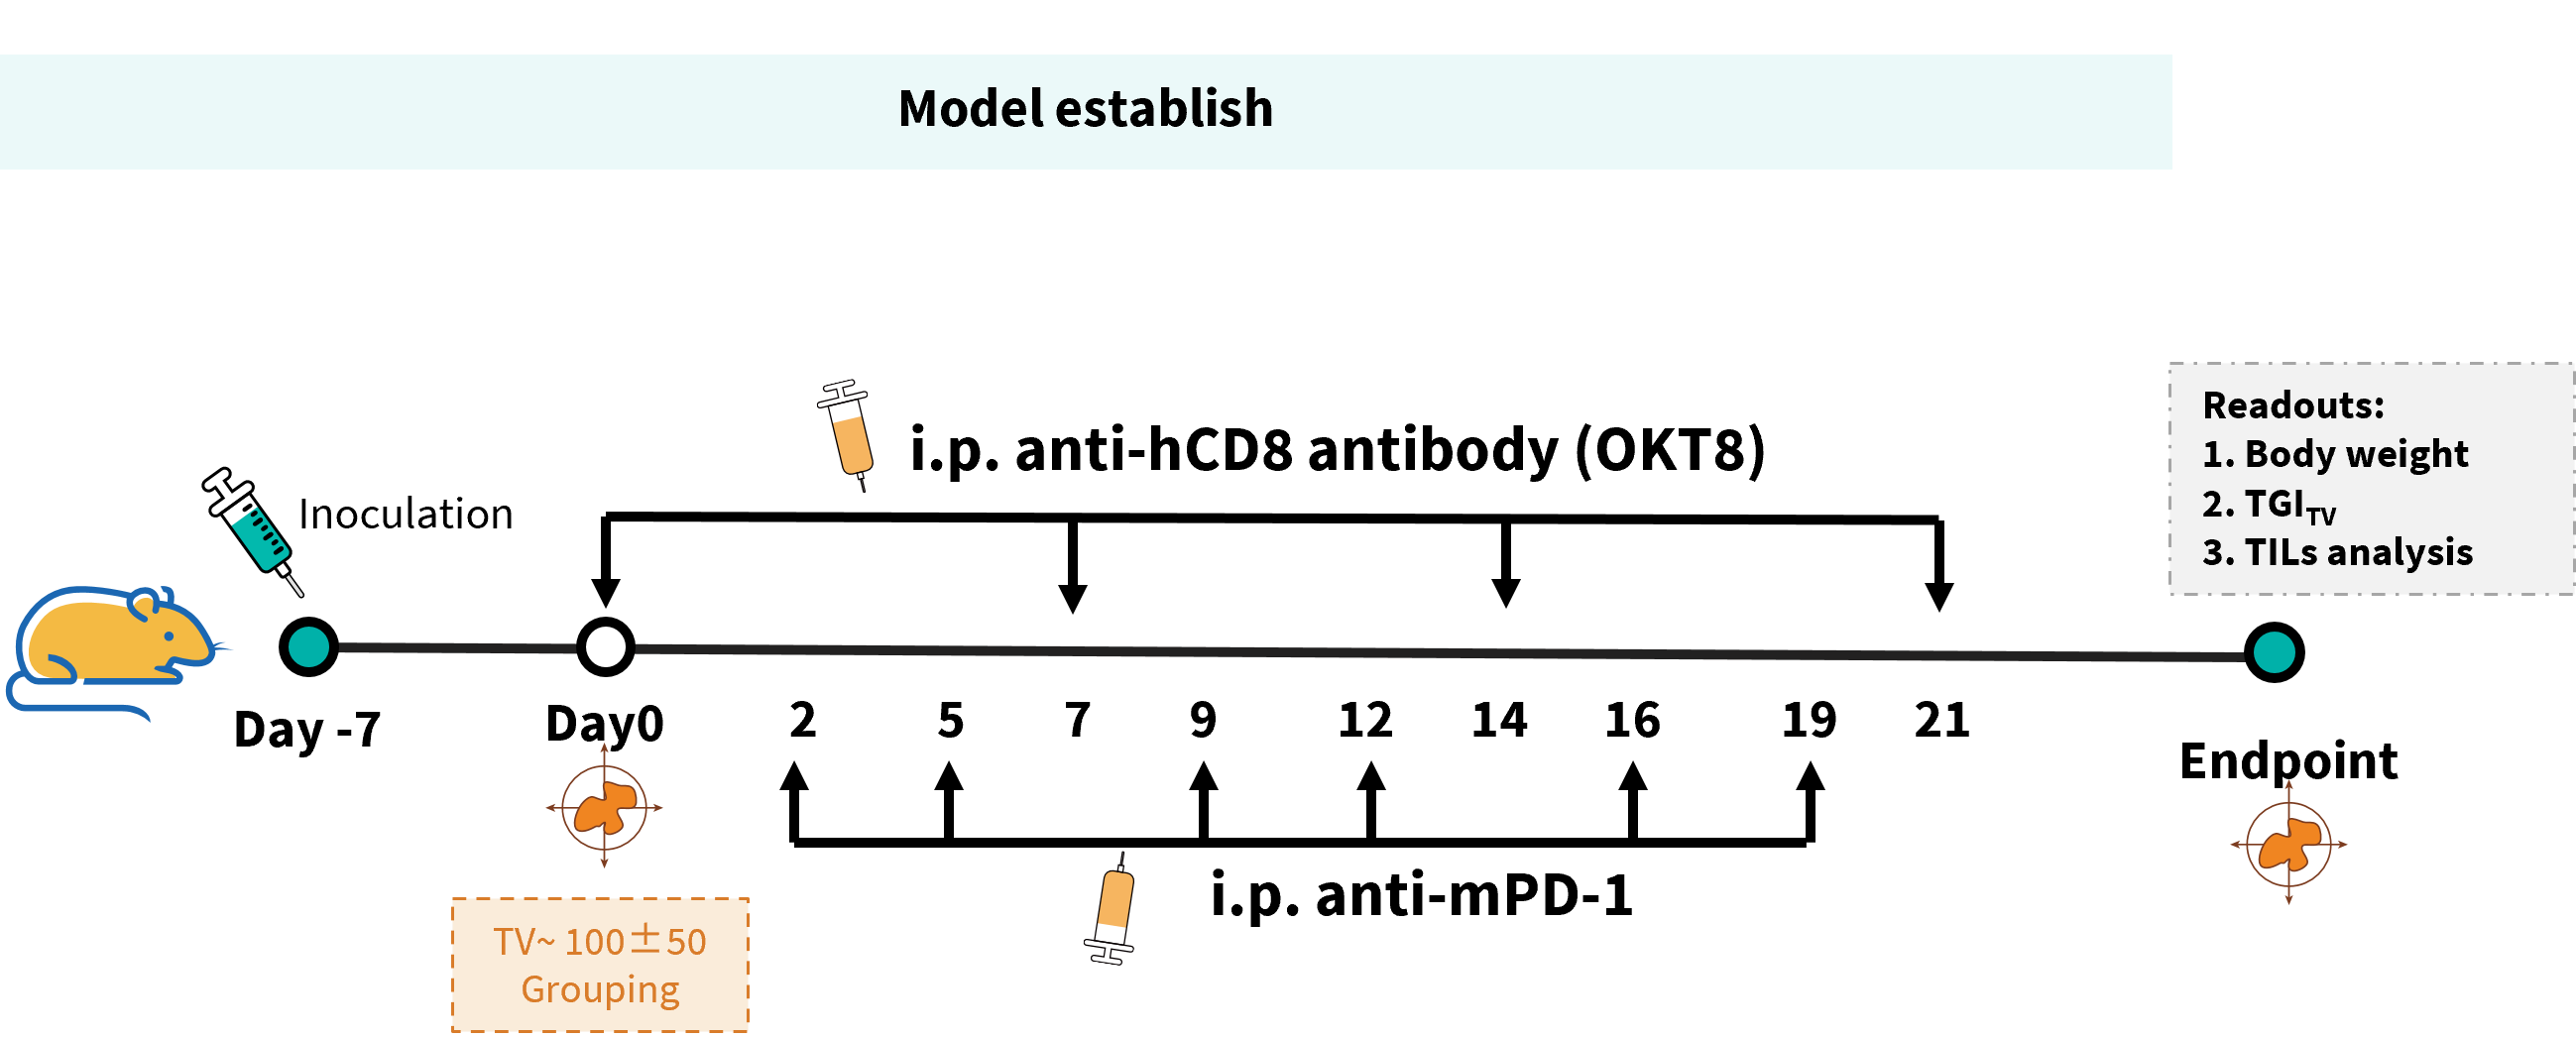
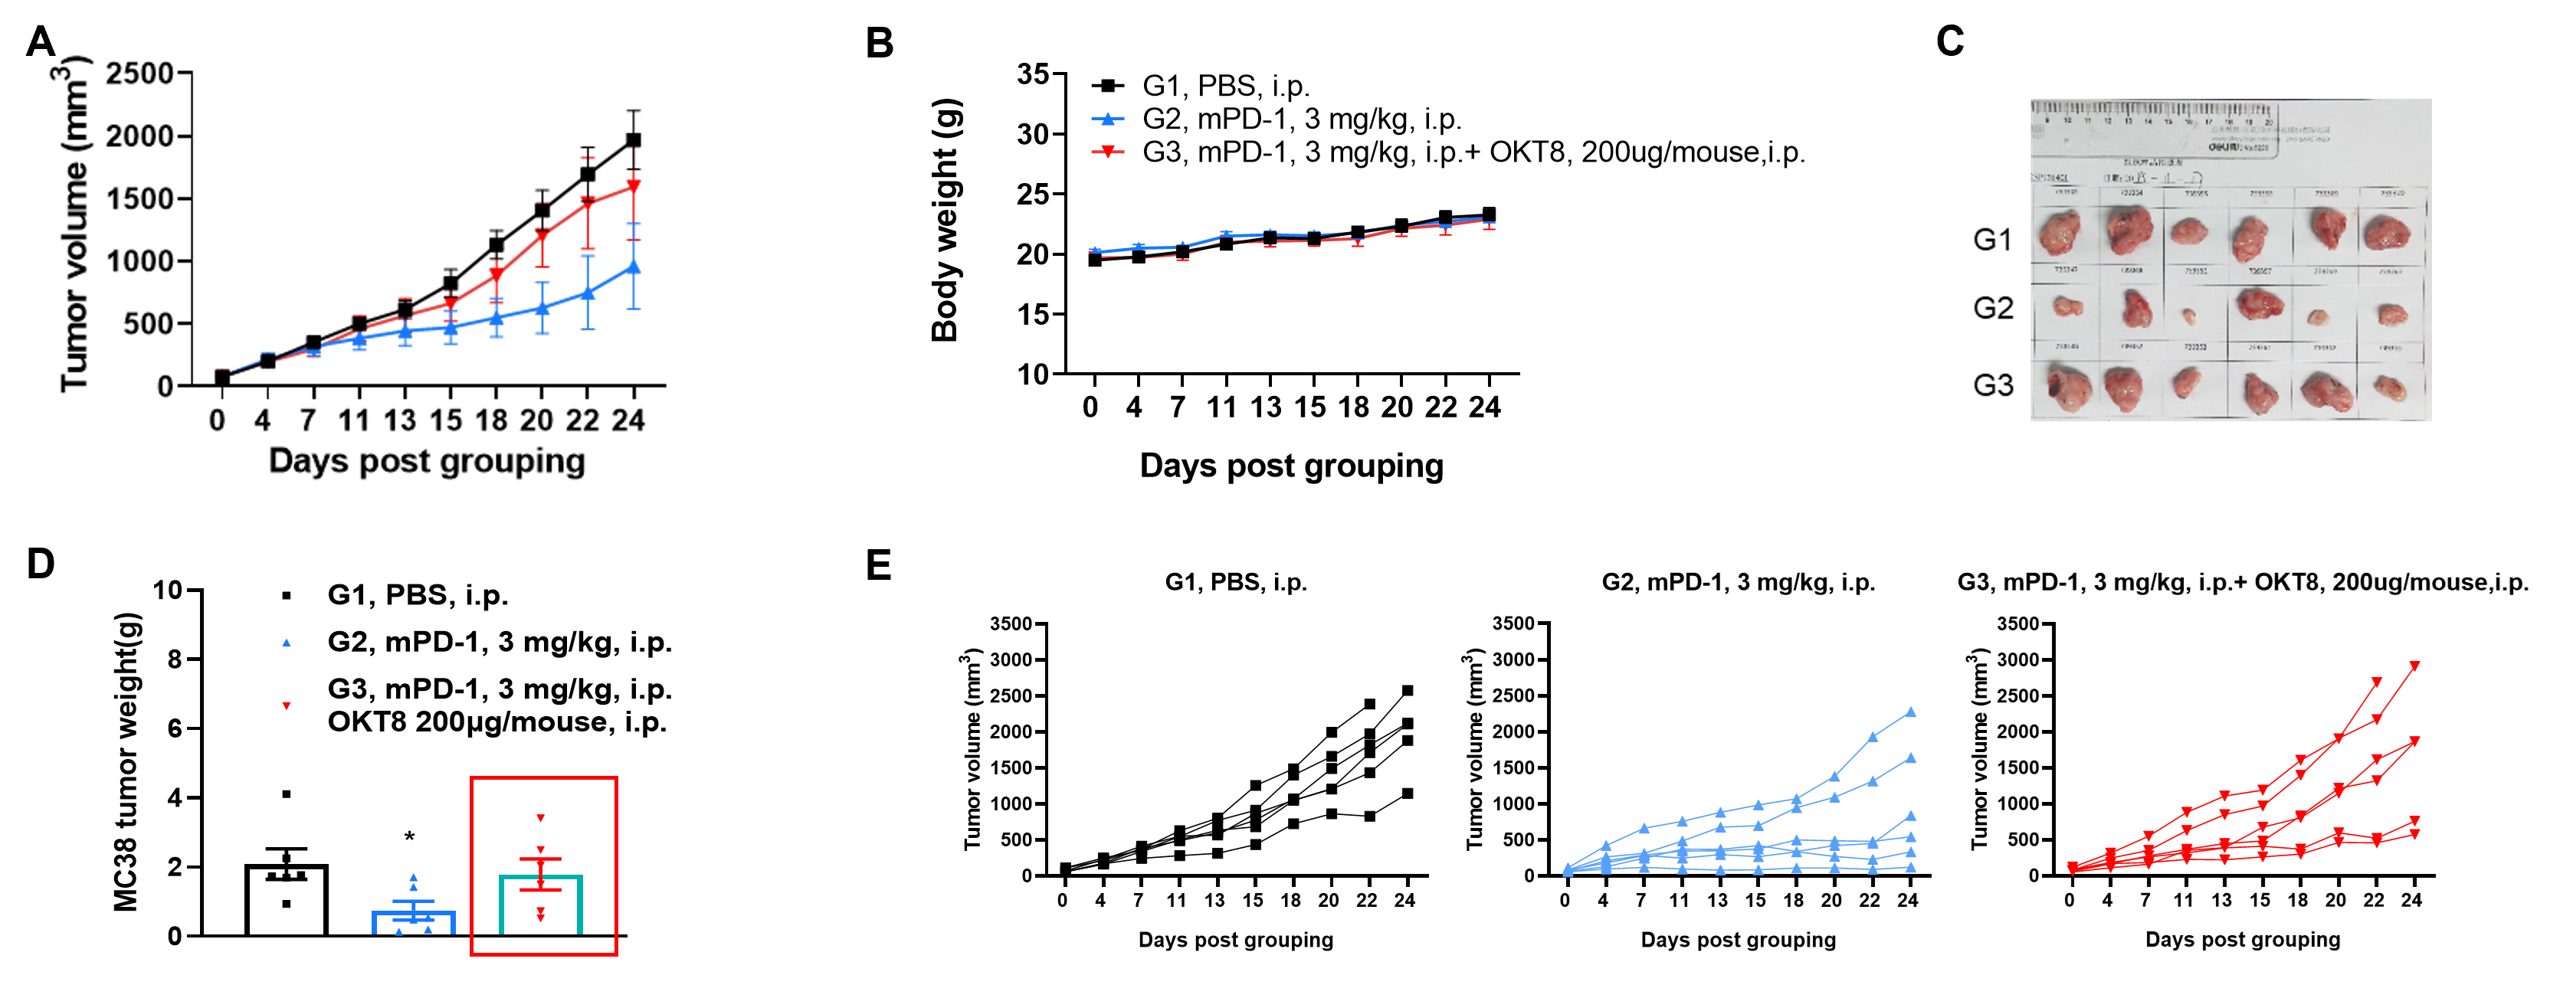
Evaluating the CD8+T cell-dependent activity of anti-PD-1 therapy in a MC38 tumor model. 5×10⁵ MC38 cells were subcutaneously implanted into B-hCD8 mice (female, 7–week-old, n=6). Mice were grouped when tumor volume reached approximately 100 mm³, at which time they were injected intraperitoneally with the CD8+ T cell-depleting antibody OKT8 (QW). And the mice were treatment with anti-mouse PD-1 antibody (BIW) from day 2.
- B-hCD8 mice as a powerful preclinical model for in vivo assessment of anti-tumor efficacy in the context of a humanized CD8+ T cell compartment.
The impact of CD8 + T cell depletion on the efficacy of anti-mouse PD-1 antibody . (A) Tumor growth curves. (B) body weight changes during treatment. (C-D) MC38 tumor weight measurement after the mice were sacrificed. (E) MC38 tumor cells growth of individual mice. Values are expressed as mean ± SEM.
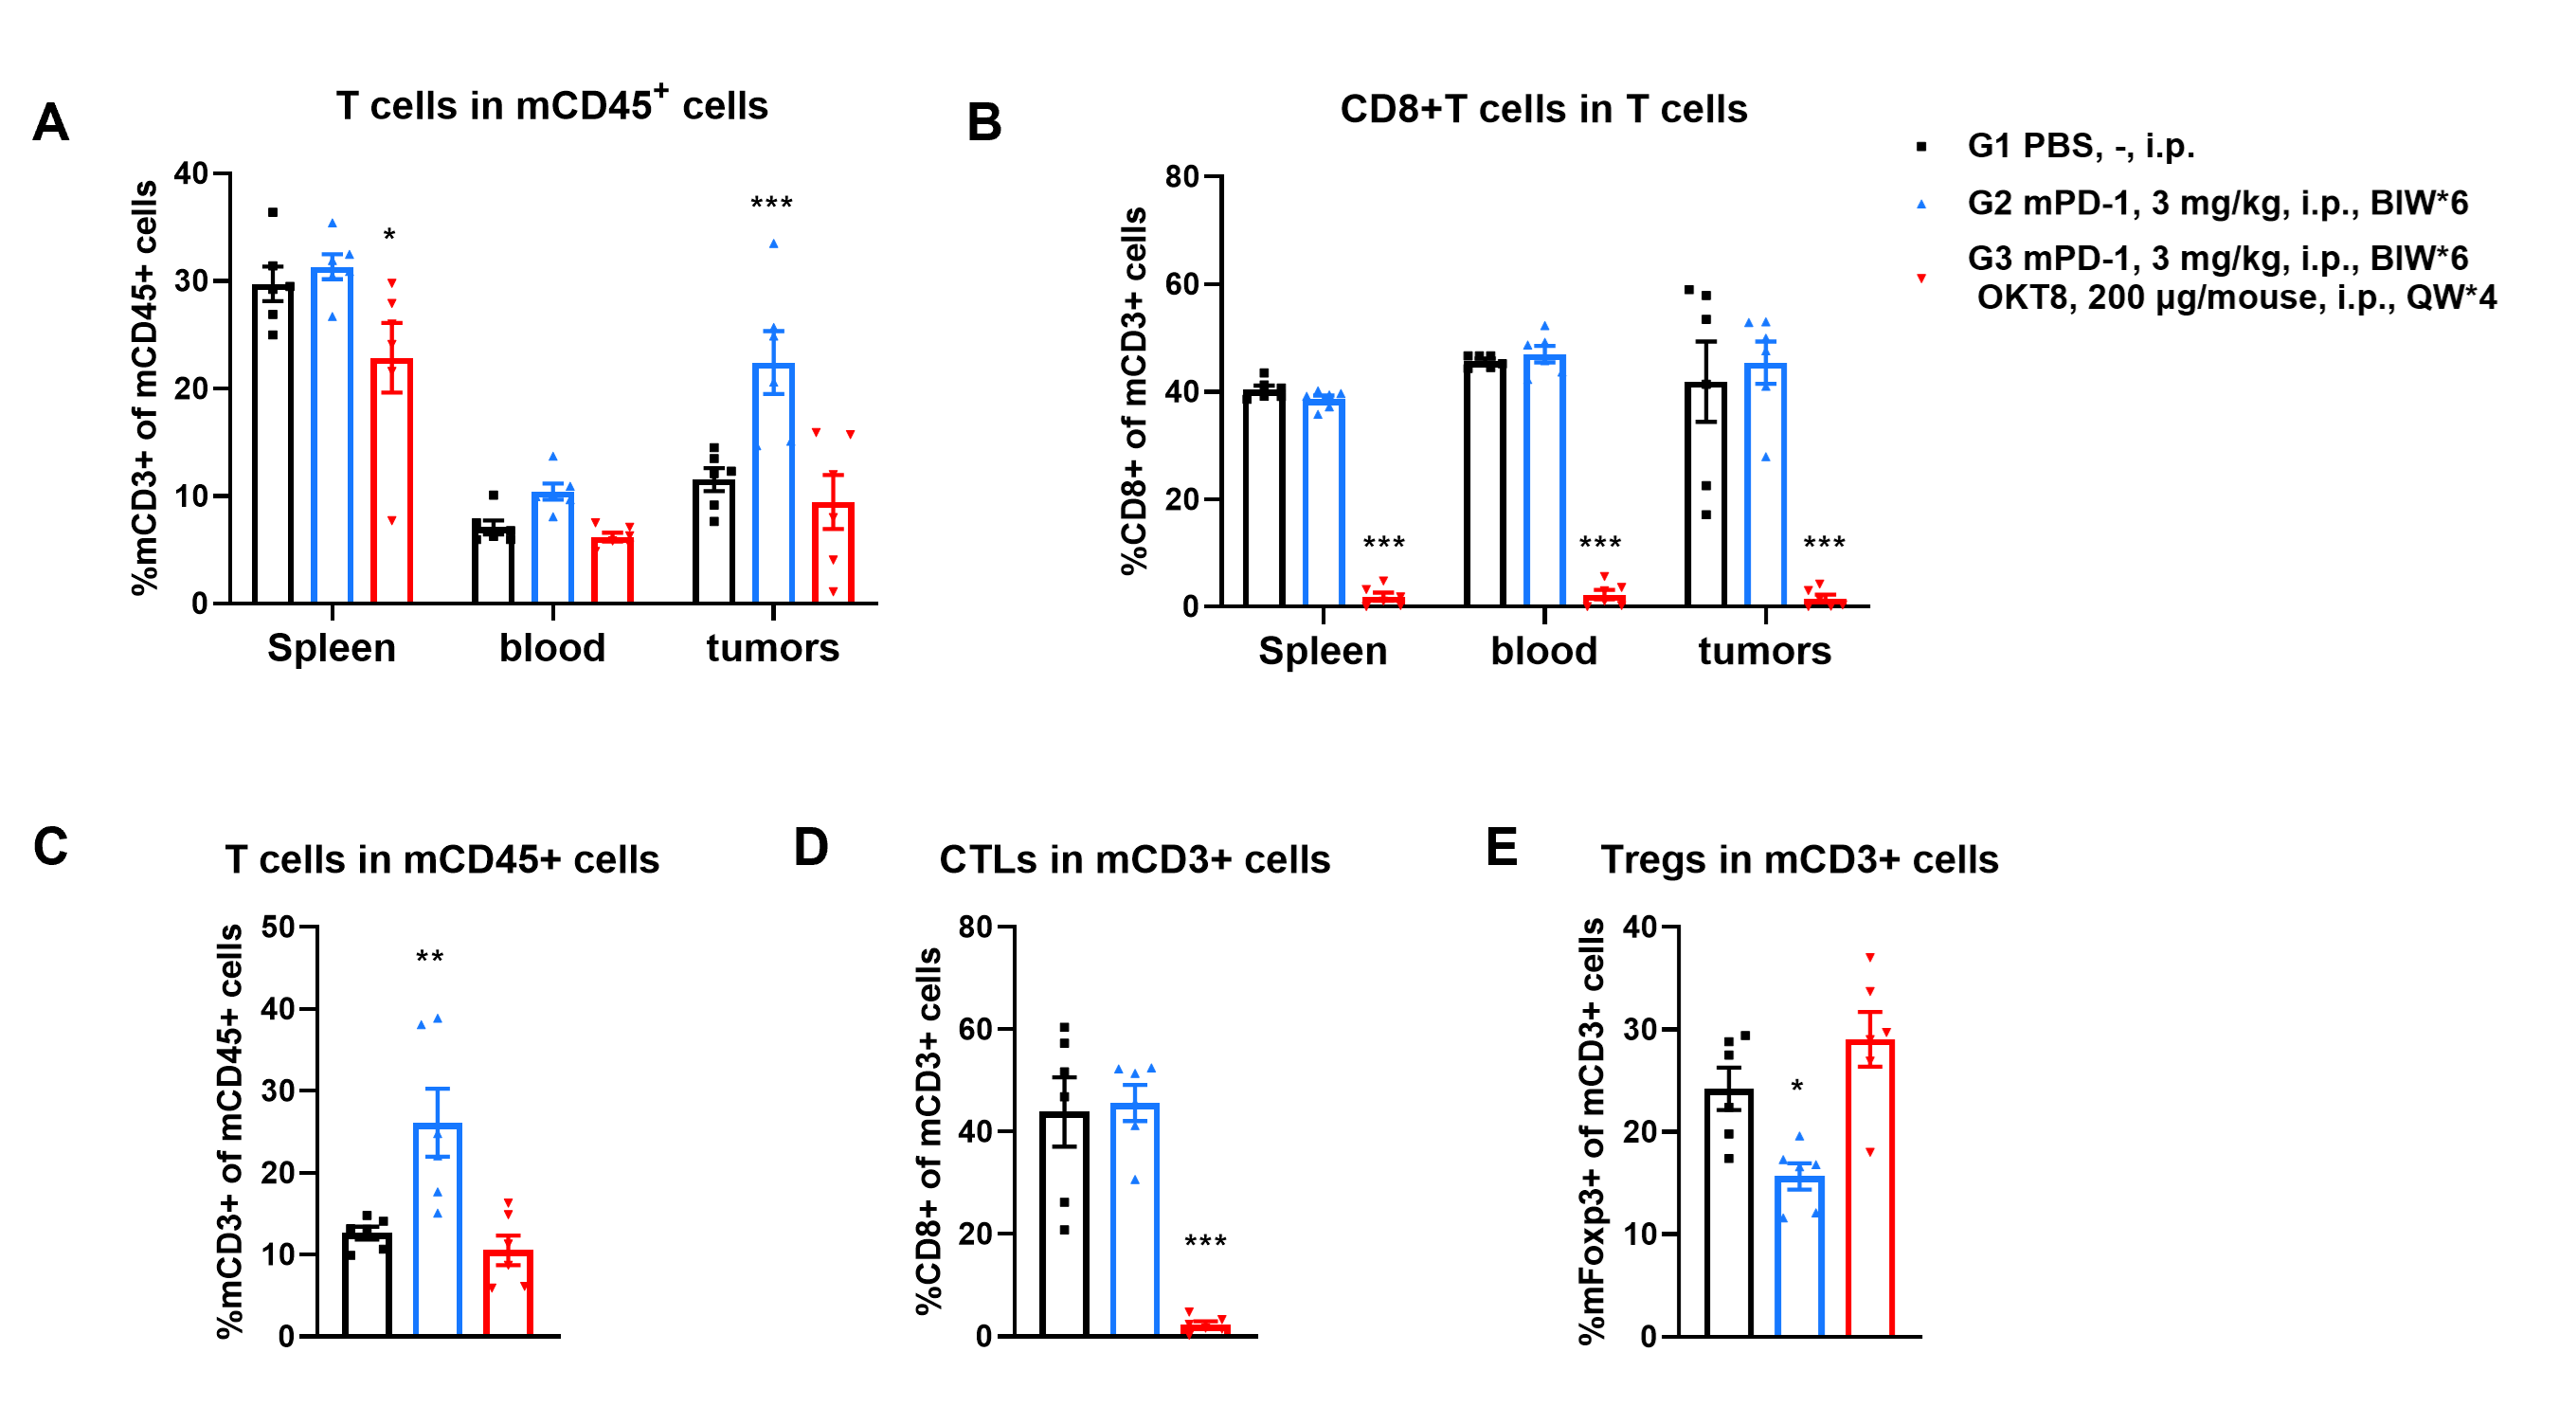
The impact of CD8 + T cell depletion on the efficacy of anti-mouse PD-1 antibody. (A-B) Demonstration of CD8+ T cell depletion by flow cytometry. Depletion was performed by OKT8 administration once per week (200 μg/mouse) starting 2 days prior to start of treatments. There was a significant decreasing of CD3+ T cells in the spleen, whereas no significance was observed in the blood and tumors for the combination of anti-mPD-1 antibody and OKT8. (A). Demonstration of near complete CD8+ T cell depletion in spleen, blood and tumor on day 24 from last OKT8 administration in combination of anti-mPD-1 antibody and OKT8 (B). (C-E) Tumors from MC38 tumor-bearing mice that were treatmented with the PBS, anti-mPD-1, and combination of anti-mPD-1 antibody and OKT8 were analyzed on day 24. Analysis of CD3+ T, CD8+ T and Tregs in the tumors determined by the flow cytometric assay. For tumor-infiltrated T (C) and Tregs (E), the percentages (in CD45+ cells) were not significantly changed, tumor-infiltrated CD8+ T cells was decreased significantly in combination of anti-mPD-1 antibody and OKT8 (D).
B cell Depletion Efficacy of CD8‑tLNP (CD19 CAR) in B-hCD8 mice
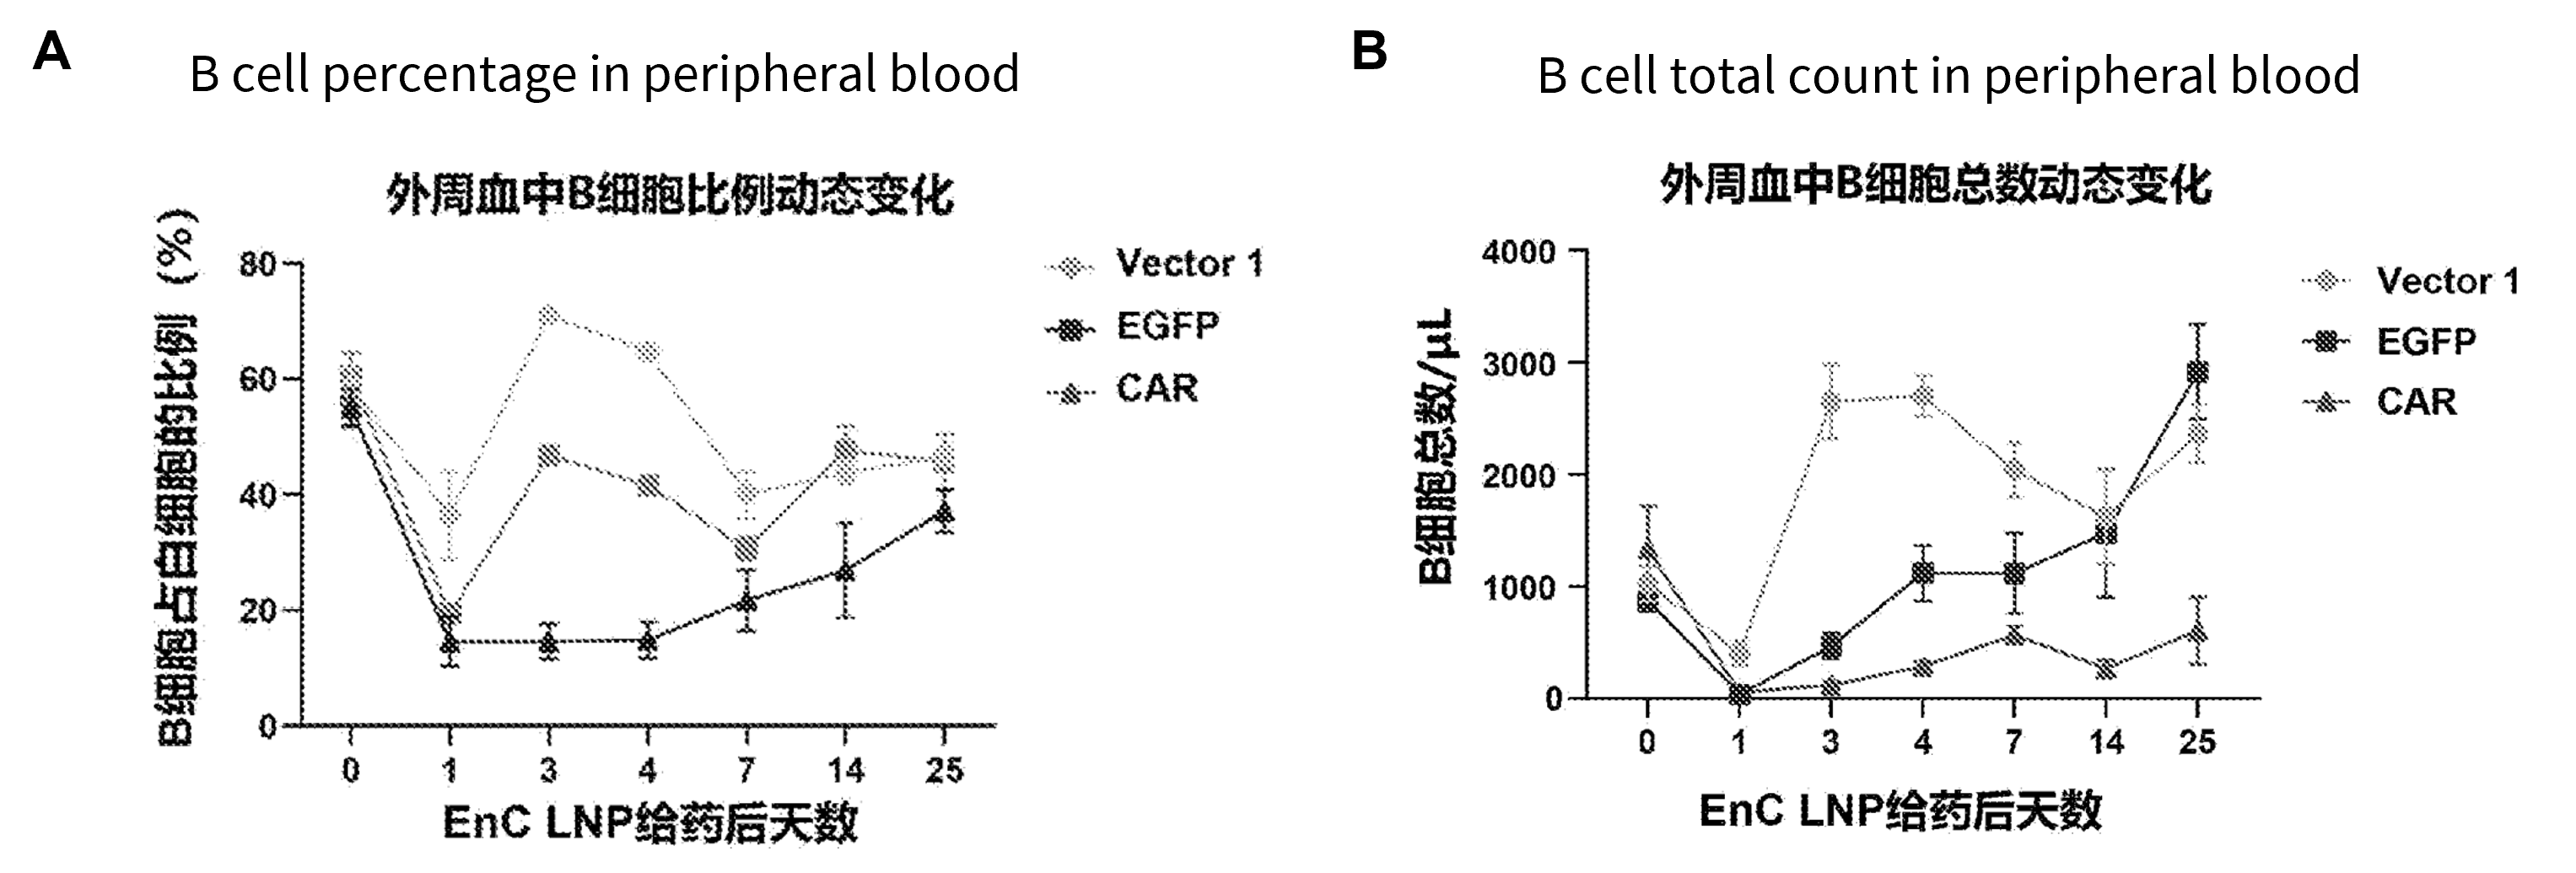
- CD8‑tLNP8 (CD19 CAR) can effectively eliminate B cells in B-hCD8 mice.
Evaluation of B cell depletion efficacy of CD8‑tLNP (CD19 CAR) in B-hCD8 mice. B-hCD8 mice (n=9) were received tail vein injections of CD8-tLNP8 encapsulating different mRNAs (1.0 mpk of mRNA-LNP/200μL/per). The Vector 1 group was injected with empty LNPs (not encapsulating RNA). The eGFP group was injected with CD8-tLNP8 encapsulating mRNA encoding EGFP. The CAR group was injected with CD8-tLNP encapsulating mRNA encoding CD19 CAR. Peripheral blood was collected from the mice on Day 0 (pre-dose), and on Days 1, 3, 4, 7, 14, and 28 post-dose to assess the proportion and count of B cells. (A) The statistical graph depicting changes in the proportion of B cells. (B) The statistical graph for changes in the total B cell count.
Efficacy of CD8‑tLNP (CD19 CAR) in Experimental autoimmune myositis (EAM) of B-hCD8 mice
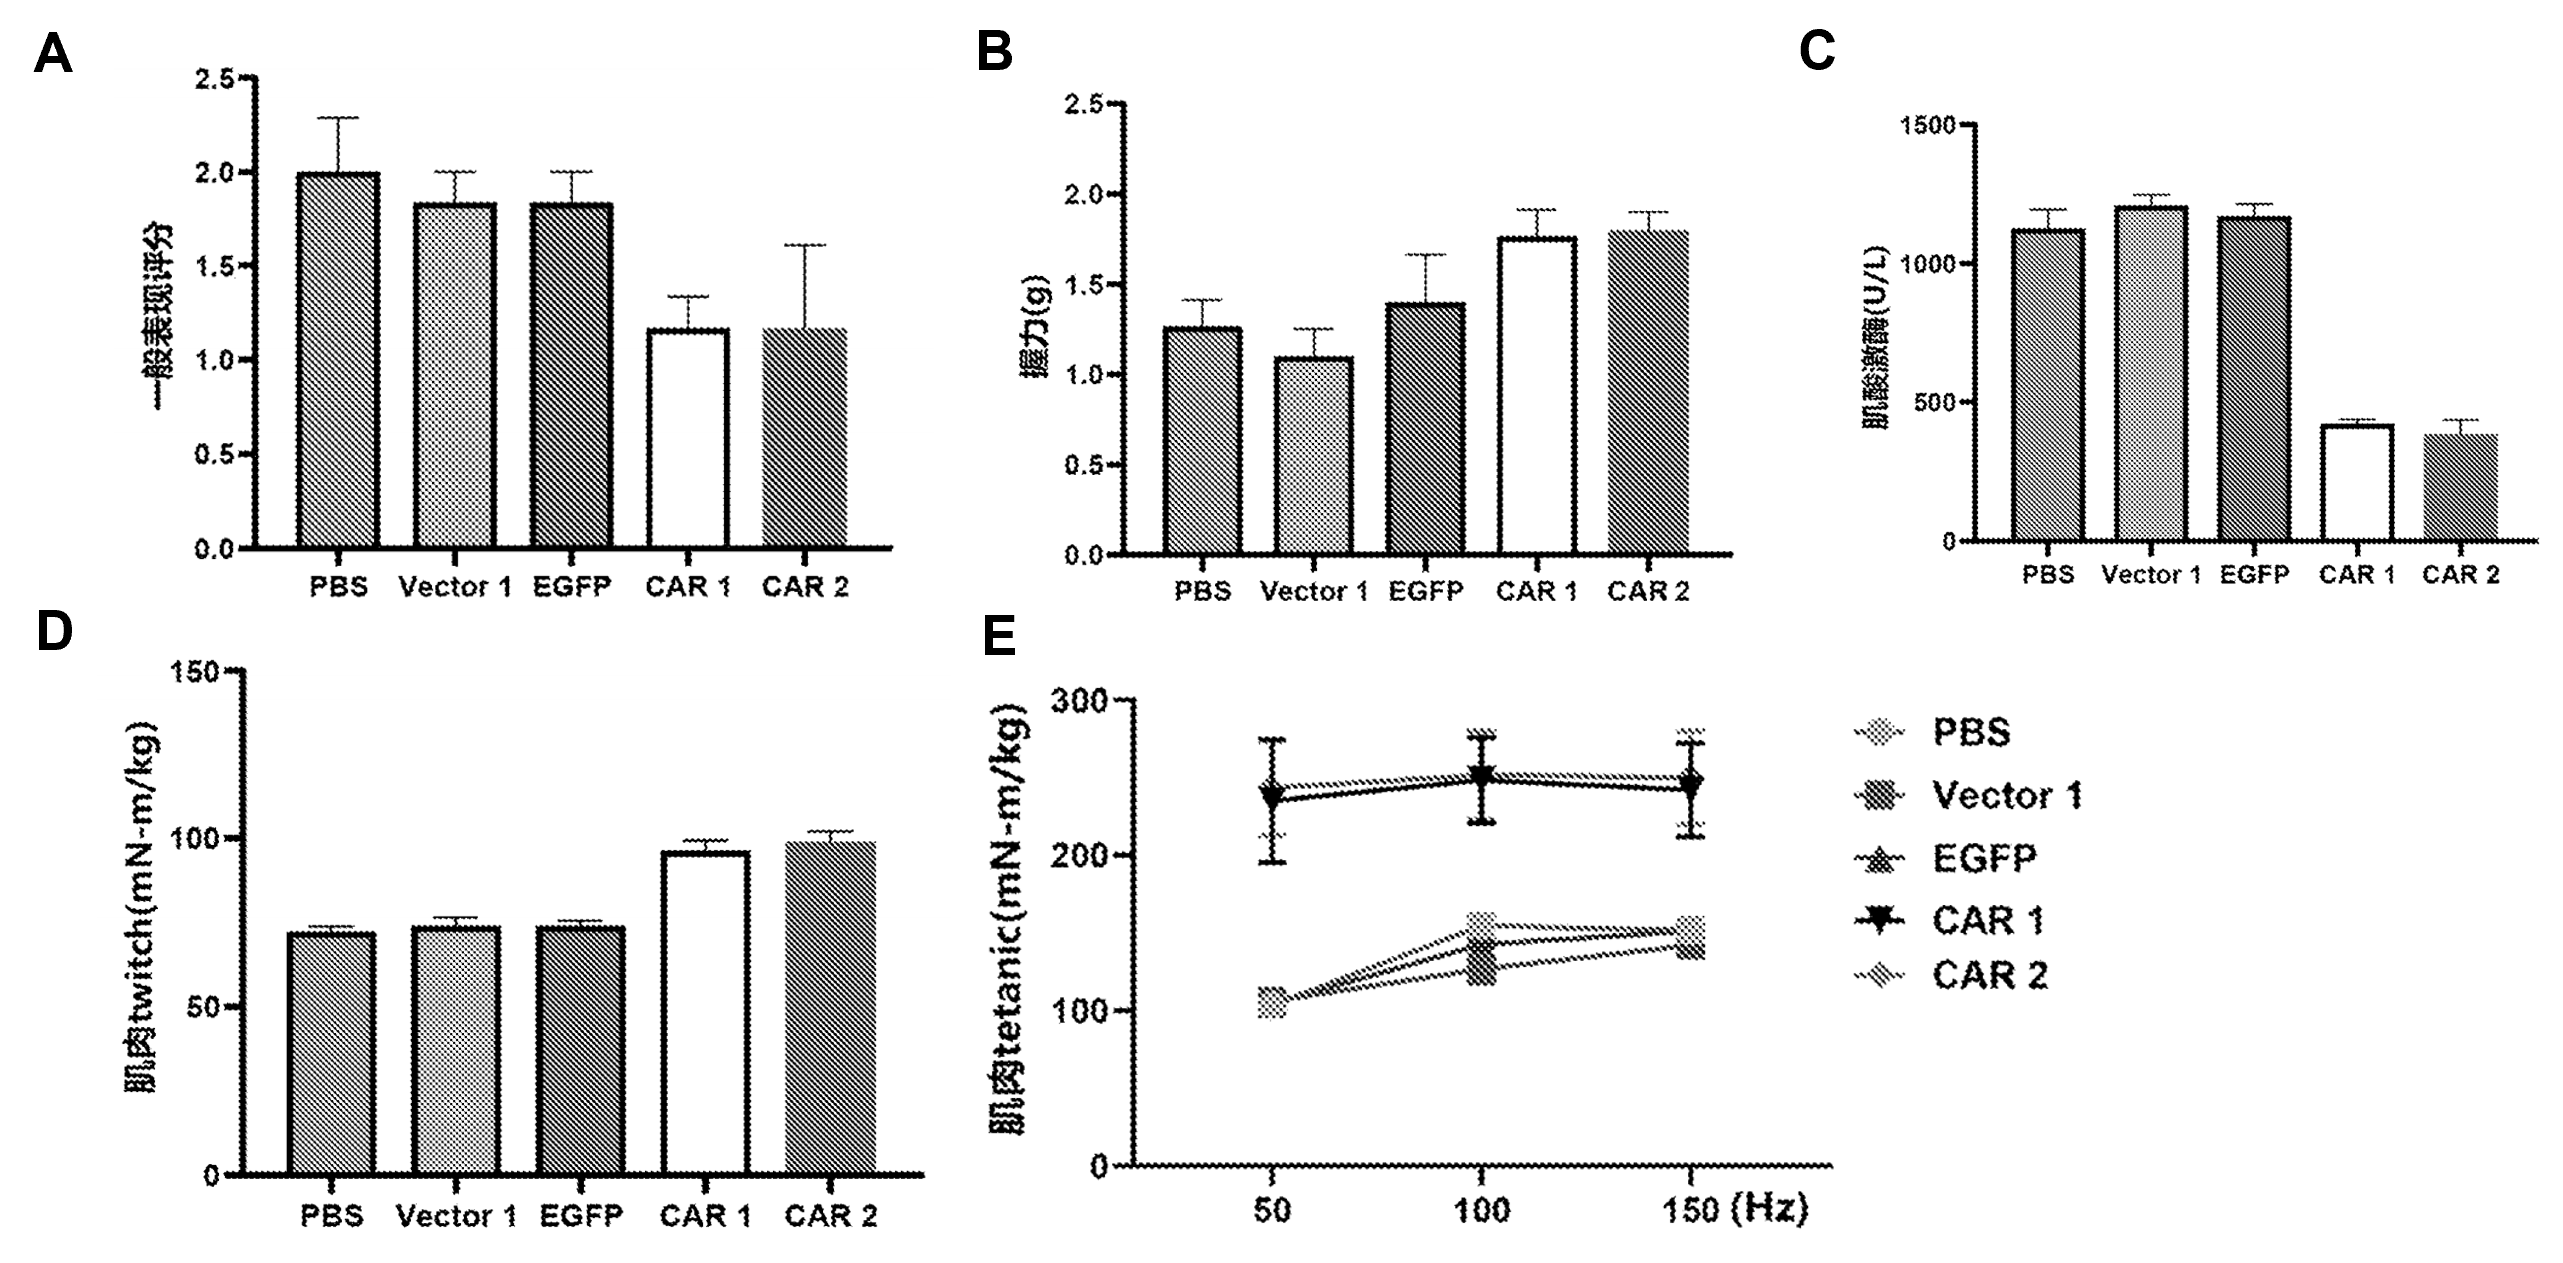
- CD8‑tLNP (CD19 CAR) can alleviation of the myositis condition in the EAM model of B-hCD8 mice.
- It is demonstrated that B-hCD8 mice can serve as a robust model for evaluating in vivo CAR-T efficacy.
Efficacy Evaluation of CD8‑tLNP (CD19 CAR) in Myosin-induced EAM mouse model of B-hCD8 mice . B-hCD8 mice (n=3) were induced EAM by Myosin, which were injected tail vein injection of corresponding CD8-tLNP formulations when mice developed myasthenic symptoms (with a score >1). The general appearance score (A), limb grip strength (B), plasma creatine kinase (CK) levels (C), and muscle contractility (twitch/tetanic force) (D &E) were assessment one week post-administration.
* When publishing results obtained using this animal model, please acknowledge the source as follows: The animal model [B-hCD8 mice] (Cat# 112811) was purchased from Biocytogen.