mRNA Expression Analysis
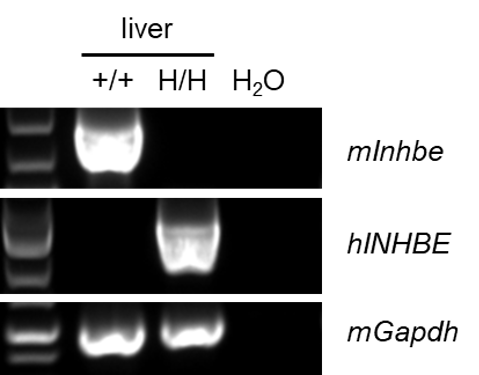
- Mouse Inhbe mRNA was detectable only in wild-type C57BL/6JNifdc mice.
- Human INHBE mRNA was detectable only in homozygous B-hINHBE mice but not in wild-type mice.
Strain-specific analysis of INHBE mRNA expression in wild-type C57BL/6JNifdc mice and B-hINHBE mice by RT-PCR. Liver RNA was isolated from wild-type C57BL/6JNifdc mice (+/+) and homozygous B-hINHBE mice (H/H), then cDNA libraries were synthesized by reverse transcription, followed by PCR with mouse or human INHBE primers. Mouse Inhbe mRNA was detectable only in wild-type C57BL/6JNifdc mice. Human INHBE mRNA was detectable only in homozygous B-hINHBE mice but not in wild-type mice.
INHBE Protein Expression Analysis
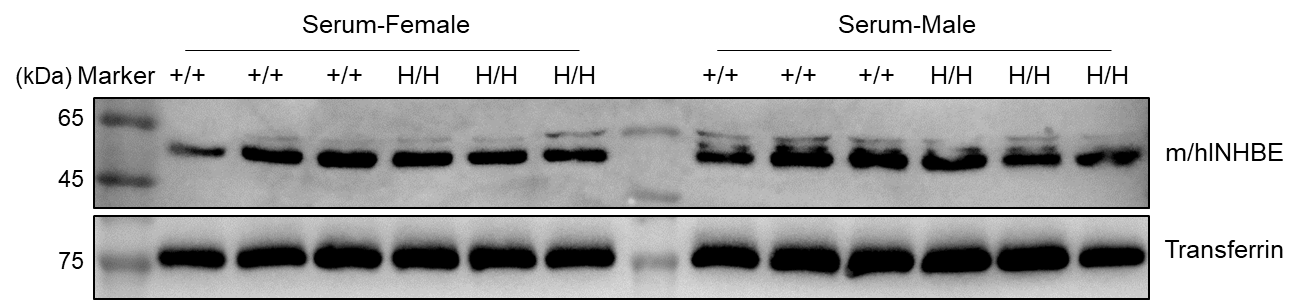
- INHBE was detected in the serum of wild-type mice and homozygous B-hINHBE mice, as the antibody cross-recognizes both human and mouse INHBE.
Western blot analysis of INHBE protein expression in homozygous B-hINHBE mice. Serum was collected from wild-type C57BL/6JNifdc mice (+/+) and homozygous B-hINHBE mice (H/H), and then analyzed by western blot with anti-INHBE antibody (Anti-Inhibin beta E chain antibody, ab103167). 20 μg (for INHBE) or 8 μg (for Transferrin) total proteins were loaded for western blot analysis. INHBE was detected in the serum of wild-type mice and homozygous B-hINHBE mice, as the antibody cross-recognizes both human and mouse INHBE.
Blood Chemistry
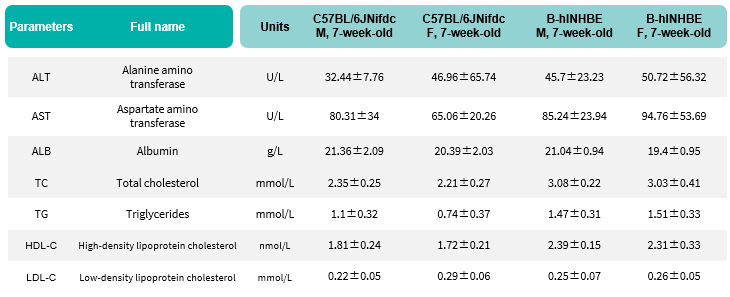
- Humanization of INHBE does not alter blood chemistry parameters in 7-week-old.
Biochemical test of B-hINHBE mice. Values are expressed as mean ± SD.
The Inhibitory Efficiency of the Nucleic Acid Drugs Against Human INHBE
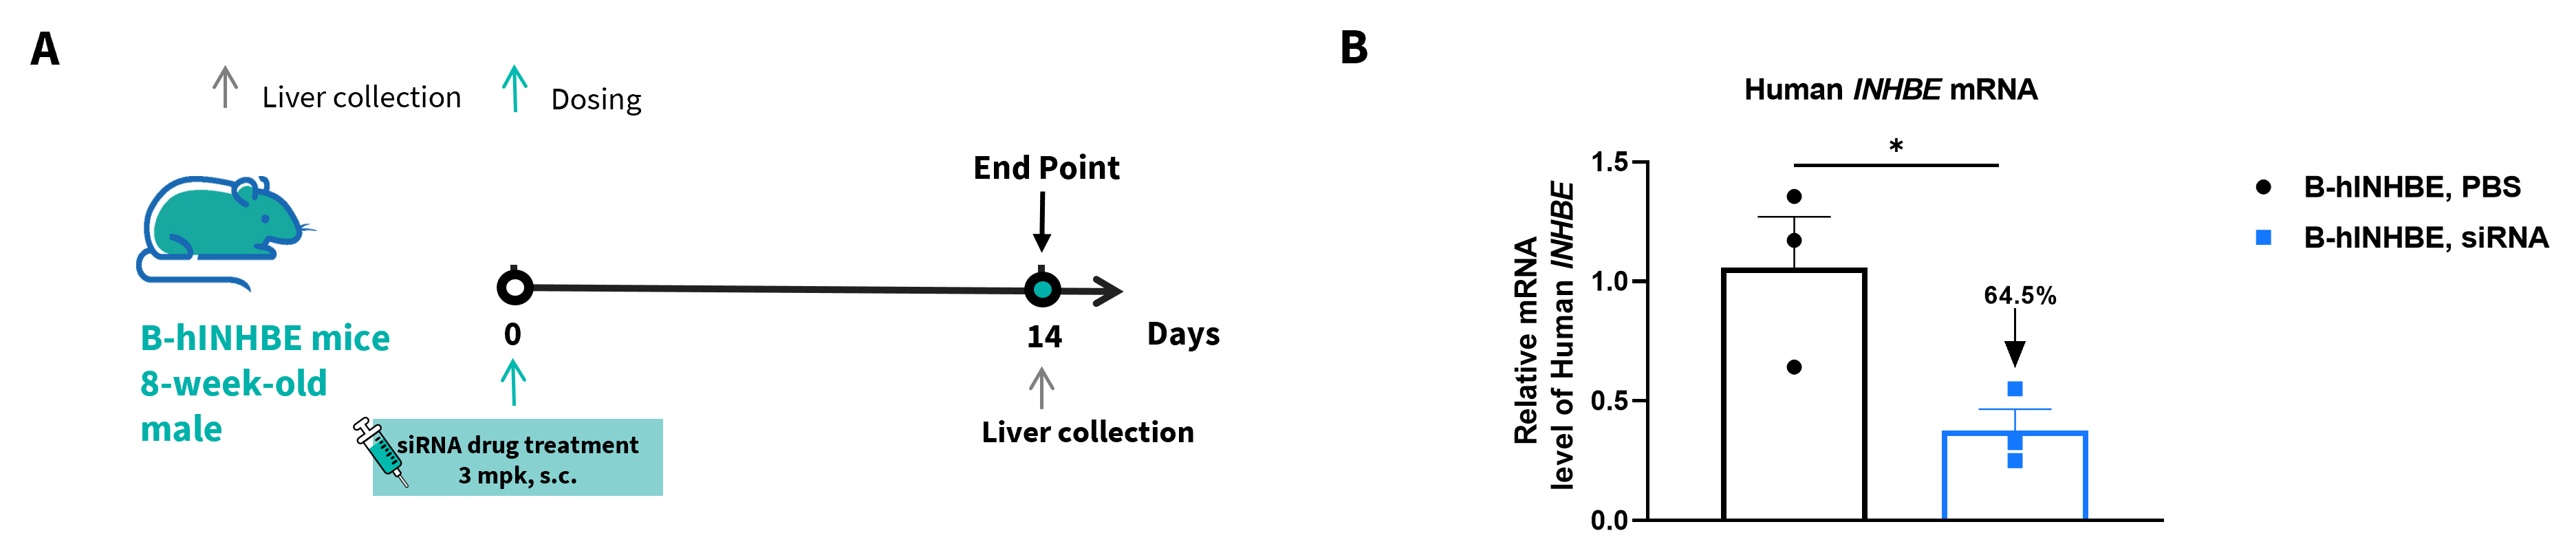
- The human INHBE levels in the treatment group were reduced compared to the control group, demonstrating that B-hINHBE mice provide a powerful preclinical model for in vivo evaluation of human INHBE-targeted nucleic acid drugs.
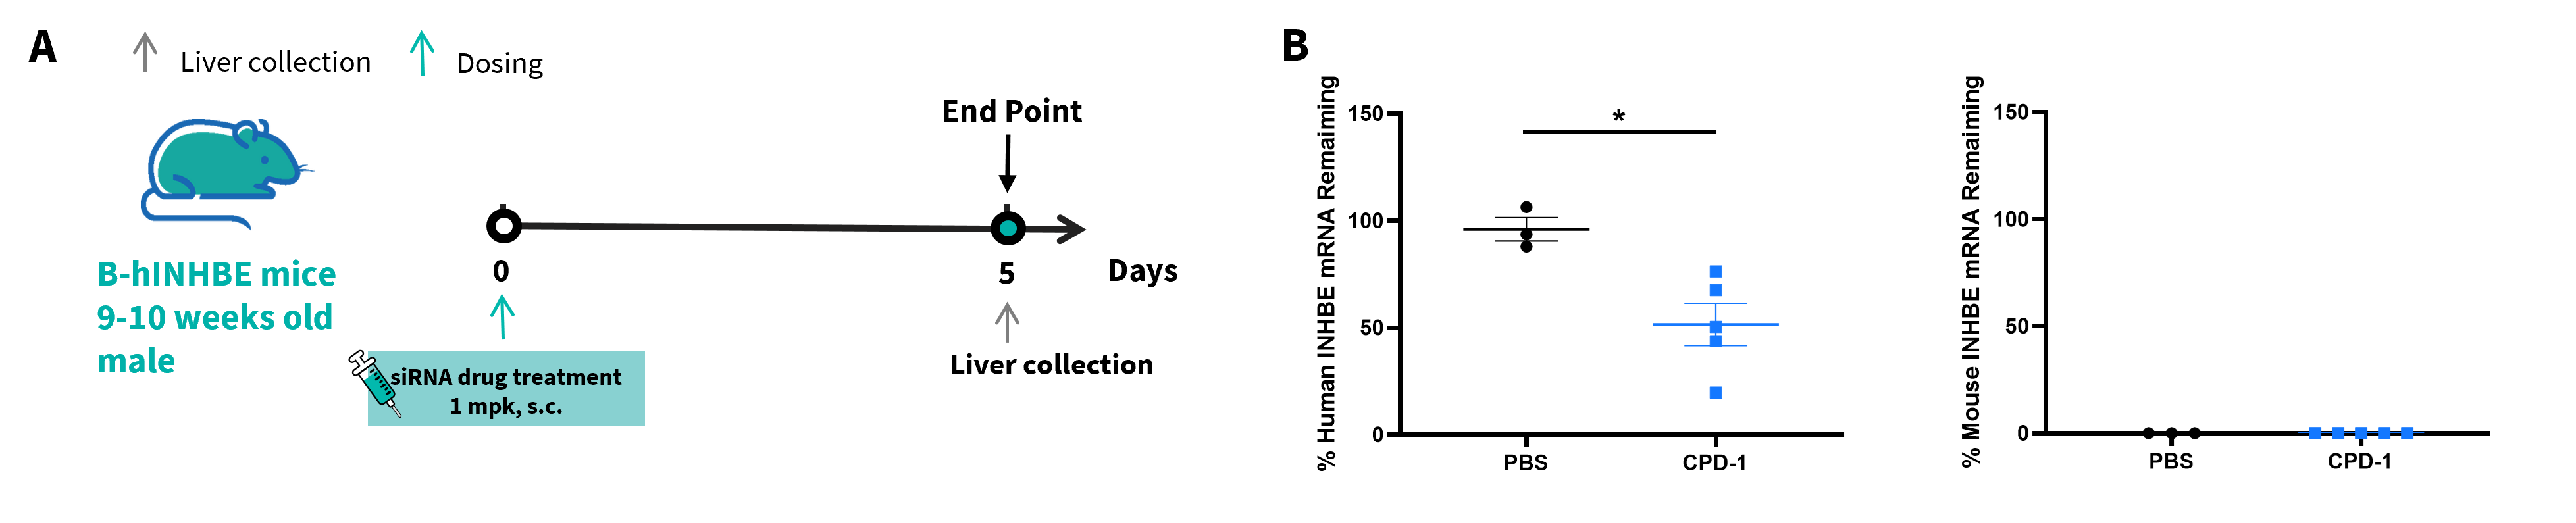
The inhibitory efficiency of the nucleic acid drugs against human INHBE in B-hINHBE mice. B-hINHBE mice were randomly divided into two groups (male, 9-10 weeks old). The human INHBE targeted nucleic acid drugs (provided by a client), and PBS were administered to the mice individually. The nucleic acid drugs was administered in the form of PBS aqueous solution. The mice were sacrificed on day 5, and the liver tissue was collected to detect the expression level of human INHBE mRNA by qPCR. (A) The schematic diagram of experimental processing. (B) The expression of human INHBE mRNA in the liver. The human INHBE in the CPD-1 group was significantly reduced compared to the control group. Significance was determined by t-test, *P<0.05. Values are expressed as mean ± SEM.
- The human INHBE levels in the treatment group were reduced compared to the control group, demonstrating that B-hINHBE mice provide a powerful preclinical model for in vivo evaluation of human INHBE-targeted nucleic acid drugs.
The inhibitory efficiency of the nucleic acid drugs against human INHBE in B-hINHBE mice. B-hINHBE mice were randomly divided into two groups (Male, 6-7 weeks old). The human INHBE targeted nucleic acid drugs (synthesized according to patents), and PBS were administered to the mice individually. The mice were sacrificed on day 14, and the liver tissue was collected to detect the expression level of human INHBE mRNA by qPCR. (A) The schematic diagram of experimental processing. (B) The expression of human INHBE mRNA in the liver. Significance was determined by t-test, *P<0.05. Values are expressed as mean ± SEM.
In Vivo Efficiency of HFD-induced B-hINHBE Mice
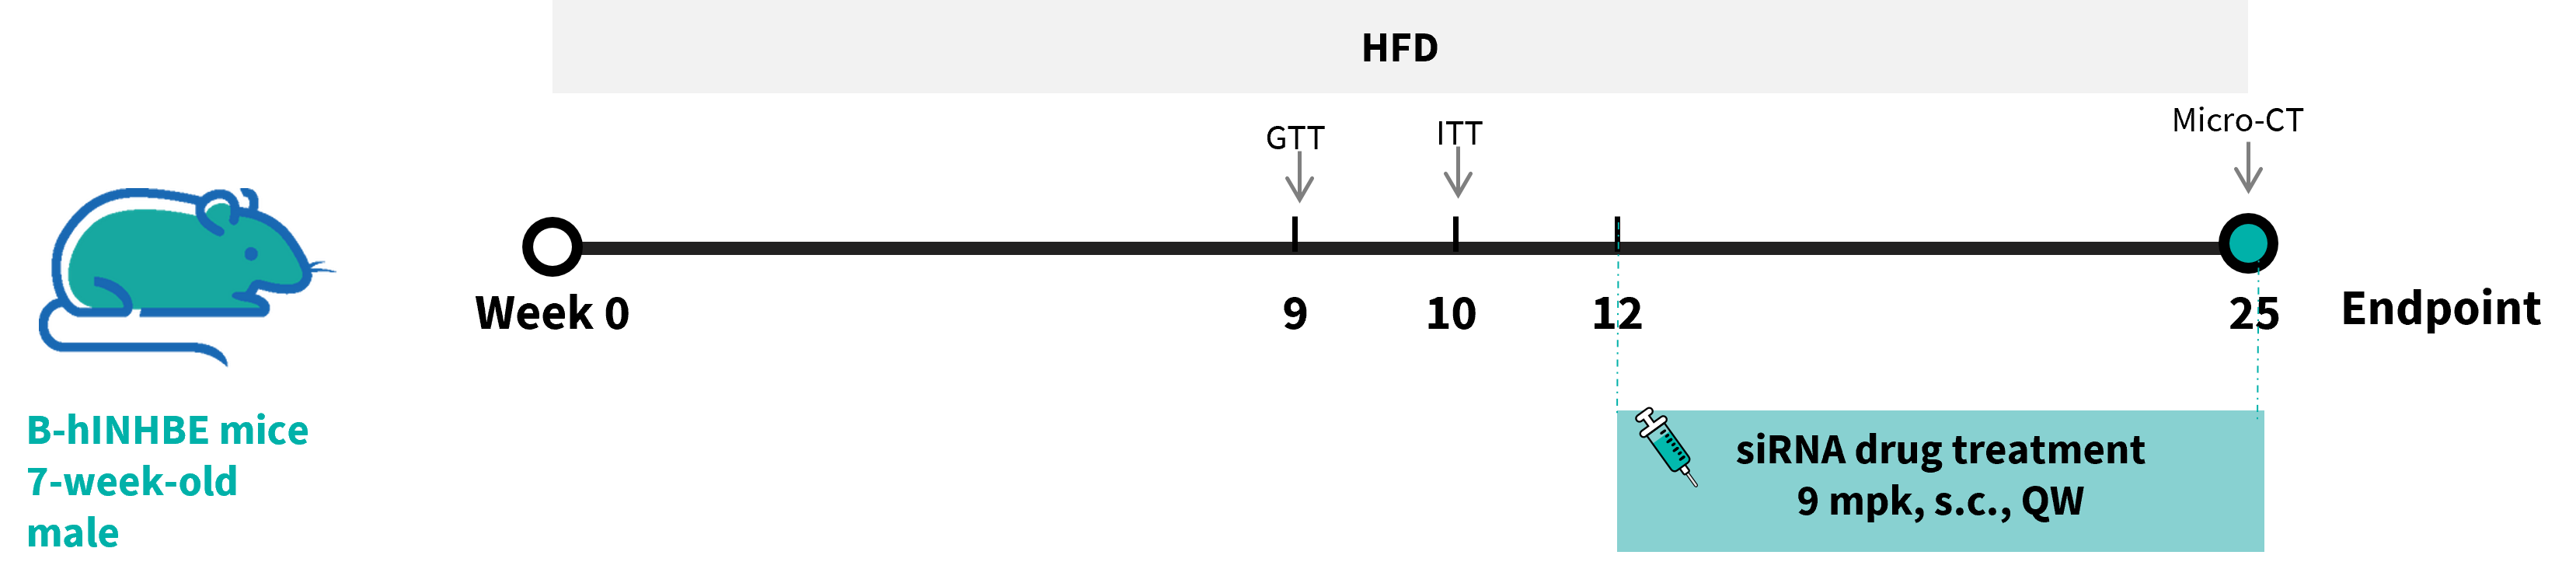
High-Fat Diet-Induced B-hINHBE mice. C57BL/6JNifdc mice and B-hINHBE mice (male, 7 weeks old) were fed with high-fat diet (60 kcal% Fat) for 12 weeks to induce obesity. The human INHBE targeted nucleic acid drugs and PBS were administered to the mice individually.
High-Fat Diet-Induced B-hINHBE Mice
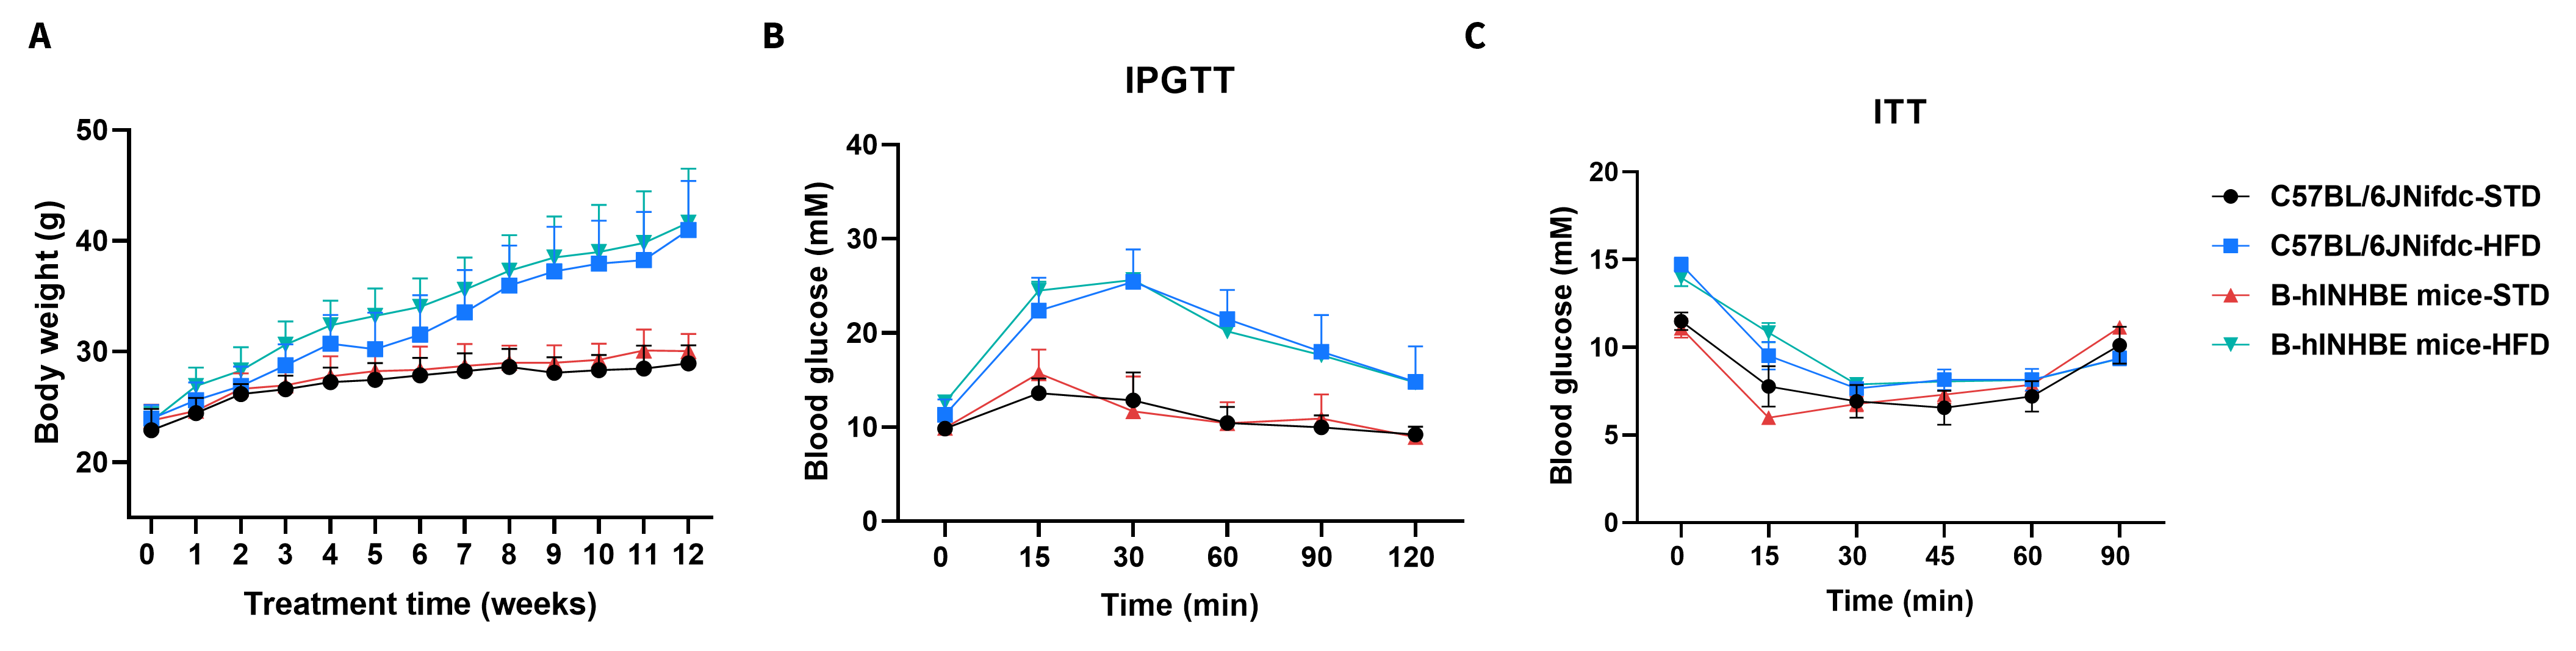
- B-hINHBE mice exhibit physiological phenotypes that are highly comparable to those of wild-type C57BL/6JNifdc mice under both standard diet (STD) and high-fat diet (HFD) conditions.
High-Fat Diet-Induced B-hINHBE mice. C57BL/6JNifdc mice and B-hINHBE mice (male, 7 weeks old) were fed with a high-fat diet (60 kcal% Fat) for 12 weeks to induce obesity. (A) Body weight after HFD induction. (B) After fasting for 6 hours, mice were intraperitoneally injected with 15% Glucose (1.5 g/kg) for Glucose Tolerance Tests after 9 weeks of induction. (C) After fasting for 4 hours, mice were intraperitoneally injected with 0.5 U/kg insulin for the Insulin Tolerance Test after 10 weeks of induction.
In Vivo Efficiency of HFD-induced B-hINHBE Mice
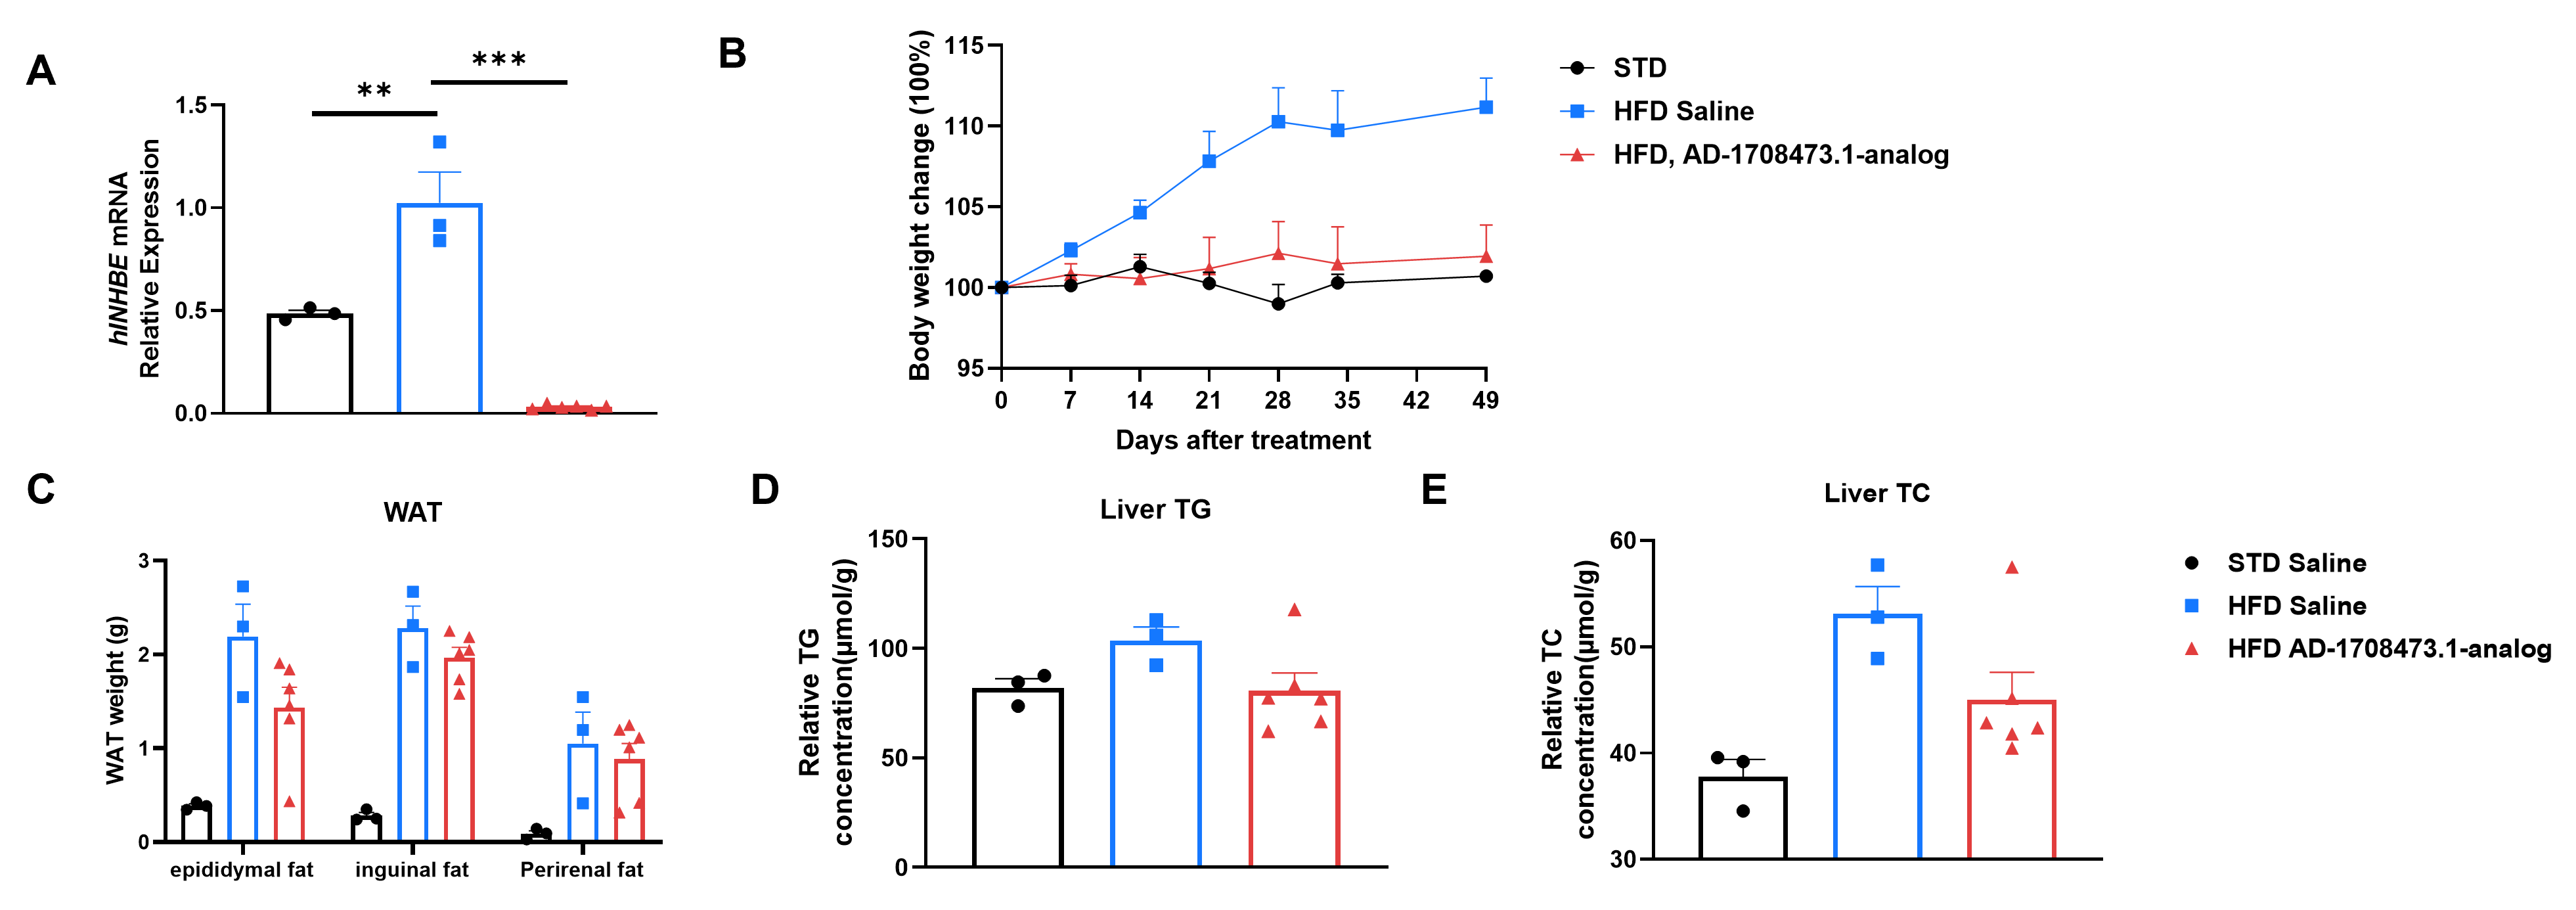
- AD-1708473.1-analog effectively knocks down hINHBE mRNA expression, mitigates high-fat diet (HFD)-induced obesity, white adipose tissue accumulation, and hepatic lipid accumulation in B-hINHBE mice.
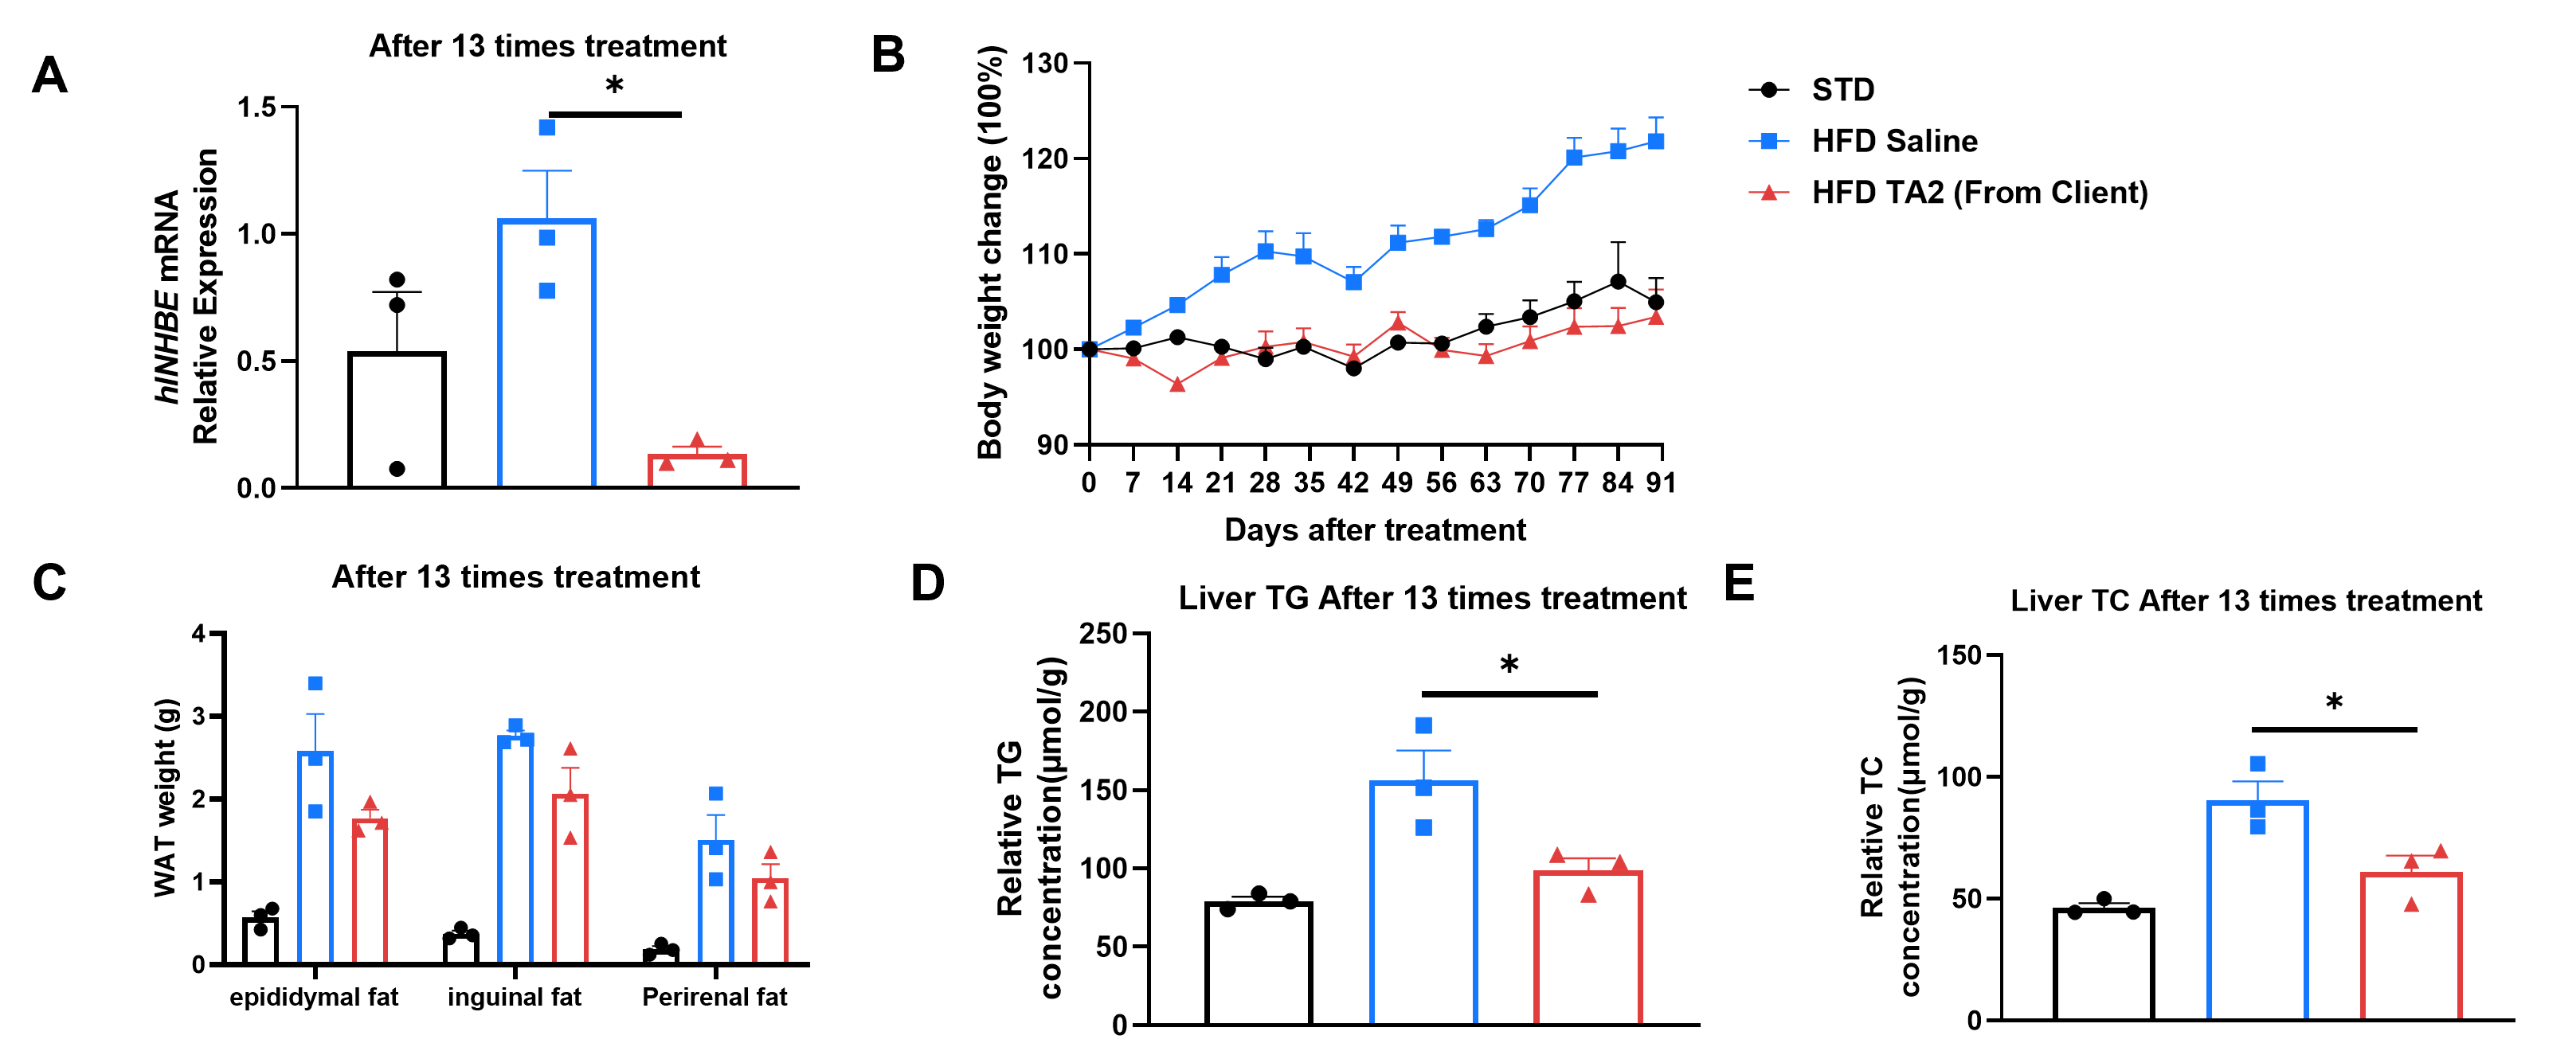
Efficacy study of INHBE-siRNA in HFD-induced B-hINHBE mice. (A) The expression of human INHBE mRNA in the liver at the end of the treatment. (B) Body weight changes after treatment. (C) Weight of white adipose tissue at the end of the treatment. (D-E) Hepatic TC and TG at the end of the treatment. Analyzed by one way-ANOVA, *P<0.05, **P<0.01, ***P<0.001. Values are expressed as mean ± SEM.
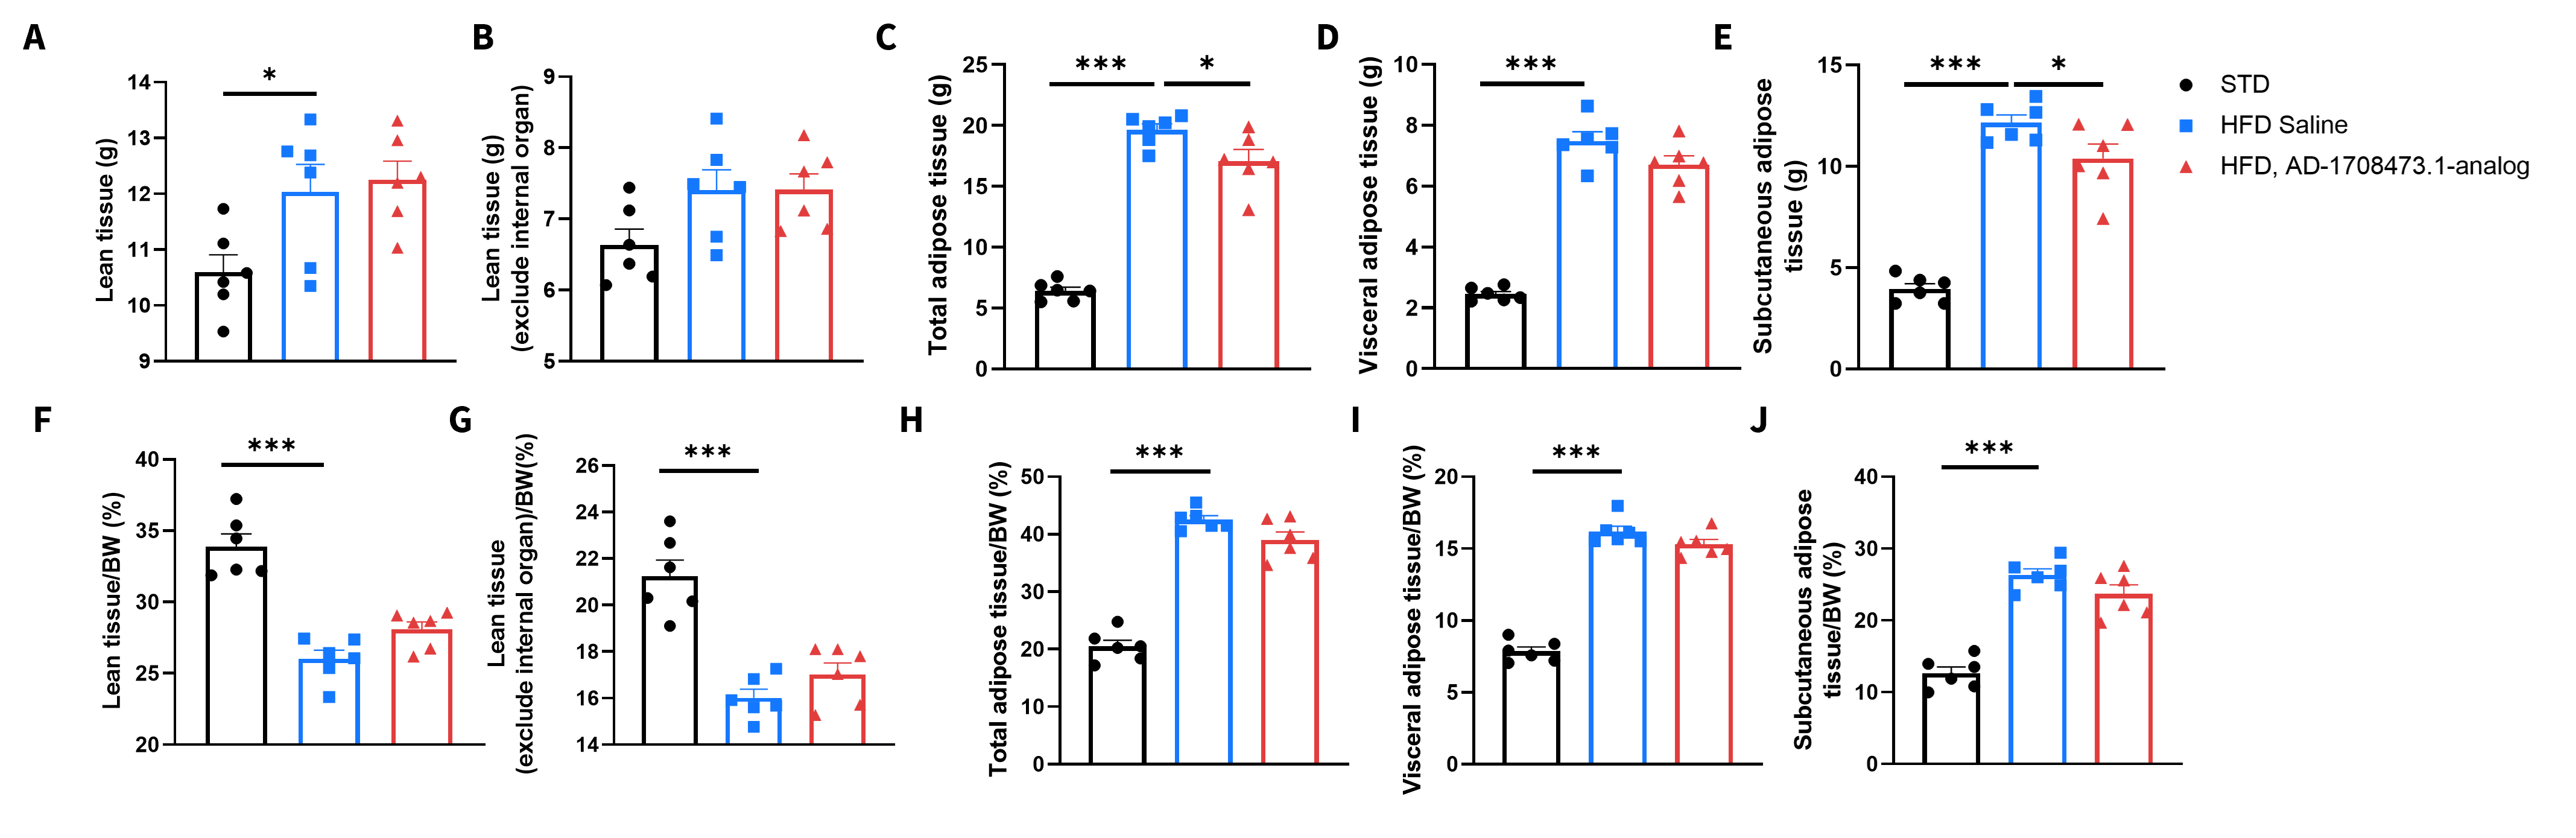
- AD-1708473.1-analog significantly reduces white adipose tissue weights in high-fat diet-fed mice without affecting lean tissue mass.
Efficacy study of INHBE-siRNA in HFD-induced B-hINHBE mice. The 3D reconstruction analysis of lean tissue and adipose tissue by micro-CT after 6 times of treatment. (A-E) The weight of lean tissue, lean tissue which excludes internal organs, total adipose tissue, visceral adipose tissue, and subcutaneous adipose tissue. (F-J) The percentages of lean tissue, lean tissue which excludes internal organs, total adipose tissue, visceral adipose tissue, and subcutaneous adipose tissue with the mouse body weight. Analyzed by one way-ANOVA, *P<0.05, **P<0.01, ***P<0.001.
High-Fat Diet-Induced B-hINHBE mice. C57BL/6JNifdc mice and B-hINHBE mice (male, 7 weeks old) were fed with high-fat diet (60 kcal% Fat) for 12 weeks to induce obesity. The human INHBE targeted nucleic acid drugs and PBS were administered to the mice individually.
- INHBE-target siRNA effectively knocks down hINHBE mRNA expression, mitigates high-fat diet (HFD)-induced obesity, white adipose tissue accumulation, and hepatic lipid accumulation in B-hINHBE mice.
Efficacy study of INHBE-siRNA in HFD-induced B-hINHBE mice. (A) The expression of human INHBE mRNA in the liver at the end of the treatment. (B) Body weight changes after treatment. (C) Weight of white adipose tissue at the end of the treatment. (D-E) Hepatic TC and TG at the end of the treatment. Analyzed by one way-ANOVA, *P<0.05, **P<0.01, ***P<0.001.
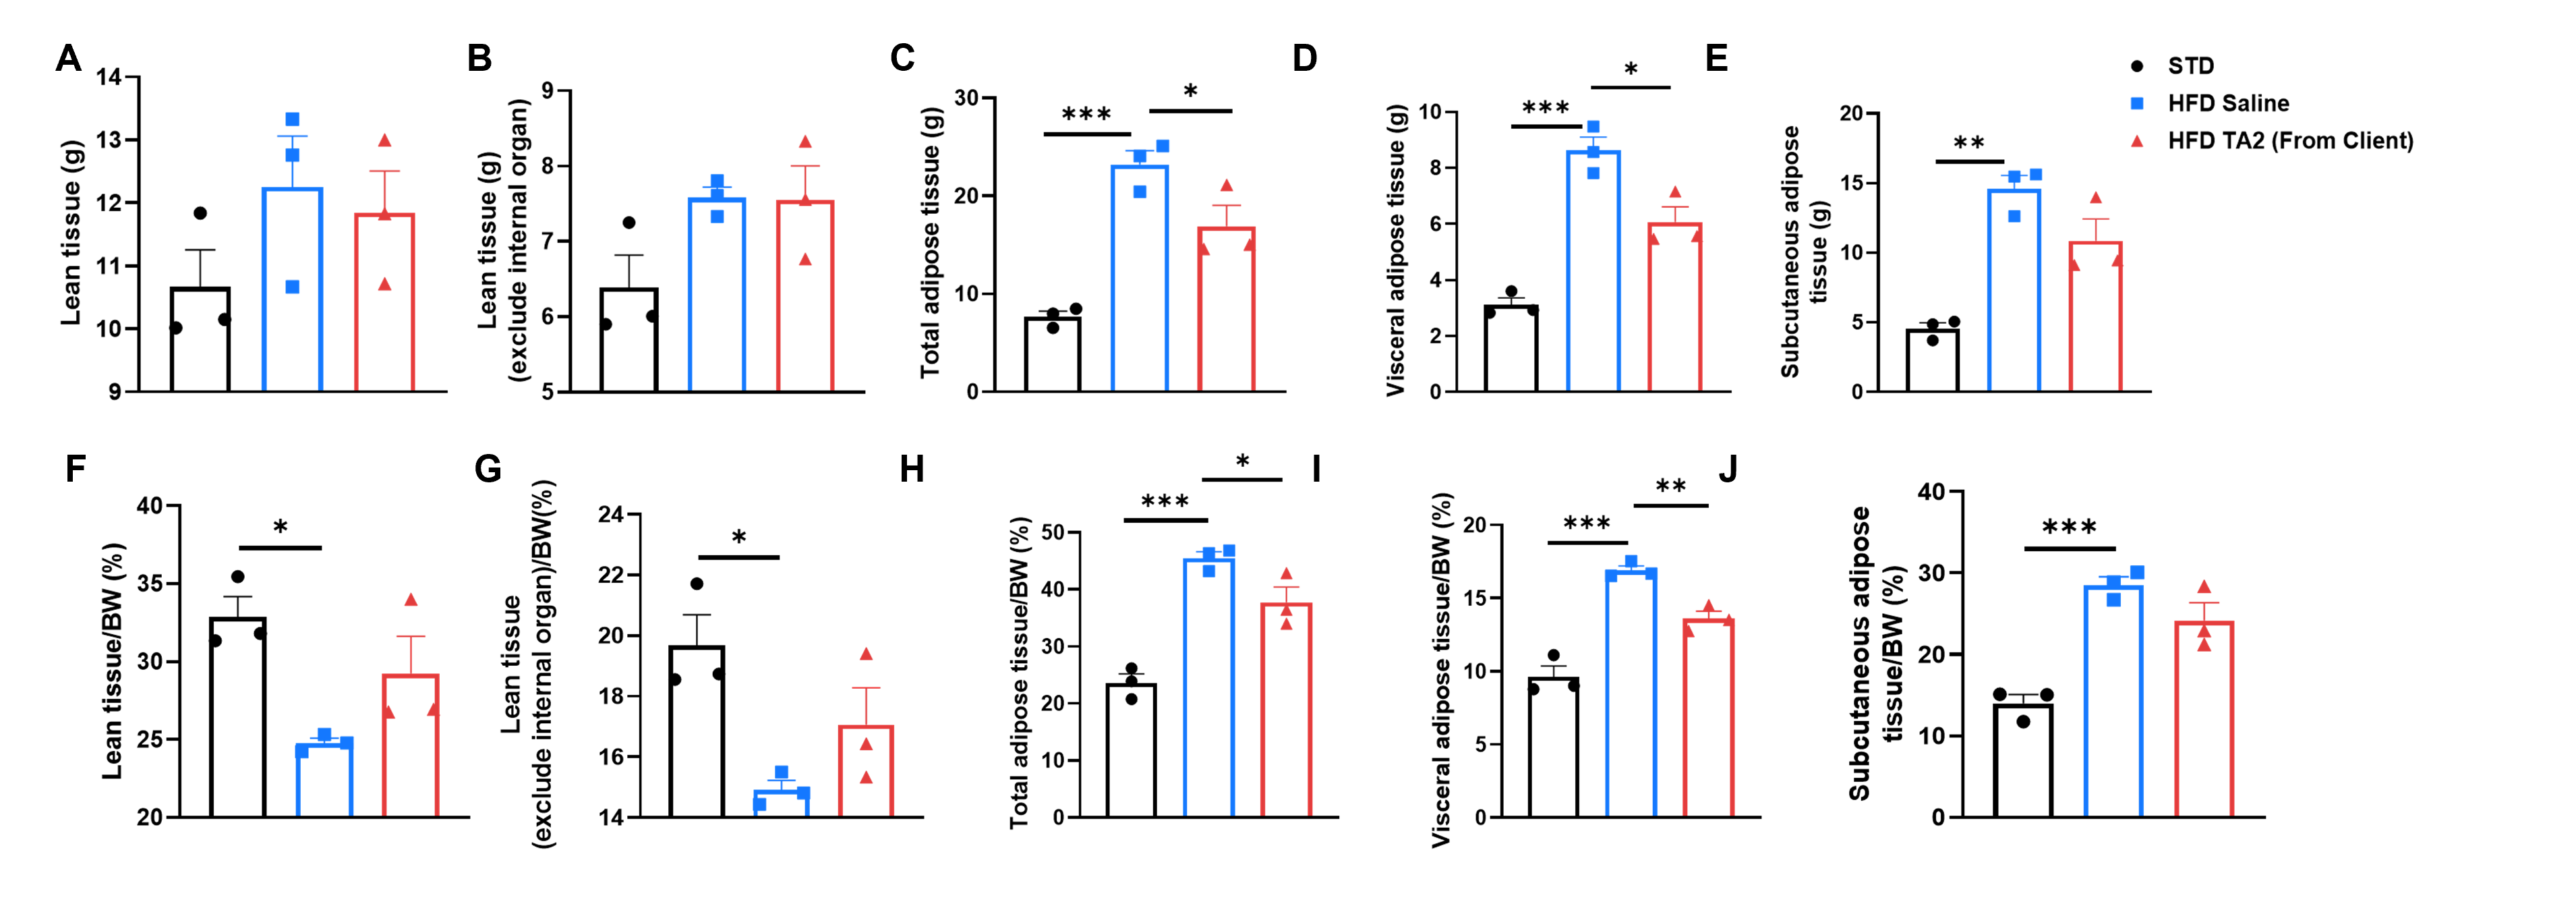
- INHBE-target siRNA significantly reduces white adipose tissue weights in high-fat diet-fed mice without affecting lean tissue mass.
Efficacy study of INHBE-siRNA in HFD-induced B-hINHBE mice. The 3D reconstruction analysis of lean tissue and adipose tissue by micro-CT after 13 times of treatment. (A-E) The weight of lean tissue, lean tissue which excludes internal organs, total adipose tissue, visceral adipose tissue, and subcutaneous adipose tissue. (F-J) The percentages of lean tissue, lean tissue which excludes internal organs, total adipose tissue, visceral adipose tissue, and subcutaneous adipose tissue with the mouse body weight. Analyzed by one way-ANOVA, *P<0.05, **P<0.01, ***P<0.001.
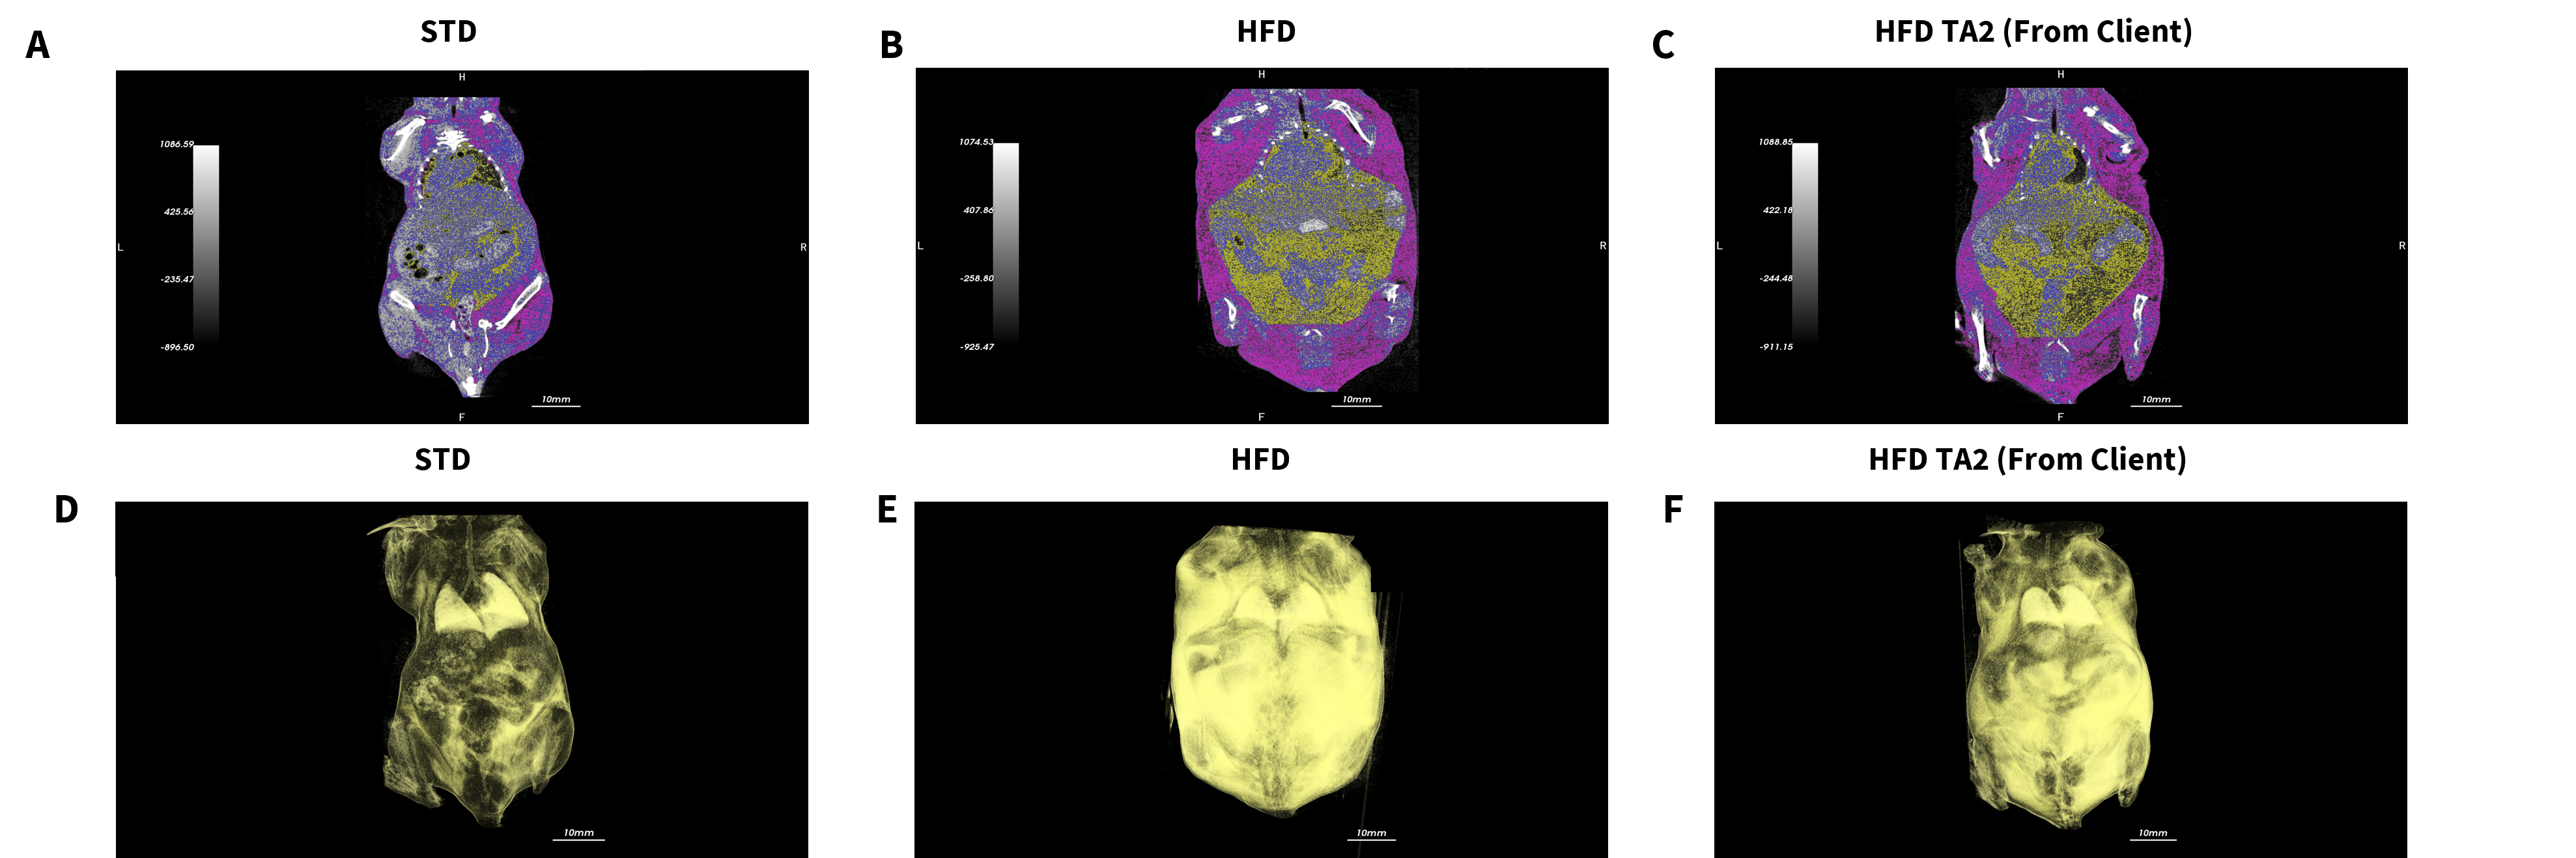
- INHBE-target siRNA significantly reduces white adipose tissue weights in high-fat diet-fed mice without affecting lean tissue mass.
Efficacy study of INHBE-siRNA in HFD-induced B-hINHBE mice. The 3D reconstruction analysis of lean tissue and adipose tissue was done by micro-CT after 13 treatments. (A-C) Representative images of the coronal plane by micro-CT. (D-F) Representative images of 3D reconstruction by micro-CT.
* When publishing results obtained using this animal model, please acknowledge the source as follows: The animal model [B-hINHBE mice] (Cat# 112773) was purchased from Biocytogen.