

BALB/cCrSlcNifdc-Pdcd1tm1(PDCD1)BcgenCd274tm1(CD274)Bcgen/Bcgen • 112489
on this page

PD-1/hPD-L1: An immune-checkpoint and tumor-associated target for therapeutic intervention
•Gene Information: PD-1 (PDCD1/CD279) is an inhibitory immune-checkpoint receptor. PD-L1 (CD274/B7-H1) is a key PD-1 ligand that mediates immune suppression in tumors and antigen-presenting-cell contexts.
•Protein Expression: PD-1 is induced after antigen-specific T-cell stimulation and is often sustained during chronic activation. PD-L1 can be constitutively expressed by tumor cells or induced by IFN-γ and other inflammatory cues.
•Signaling Pathway: PD-L1/PD-1 interaction initiates inhibitory signaling, including dephosphorylation events that suppress TCR downstream signaling. This reduces T-cell activation, cytotoxicity, and tumor-cell killing.
•Therapeutic Inhibition: Anti-PD-1 or anti-PD-L1 monoclonal antibodies block the inhibitory interaction and restore cytotoxic T-cell activity. B-hPD-1/hPD-L1 mice(C) provide an in vivo platform for evaluating PD-1/PD-L1 checkpoint blockade and combination therapies.

PD-1
•A chimeric CDS including human PD-1 gene encoding the signal peptide and extracellular region, mouse PD-1 gene encoding the transmembrane and cytoplasmic region, a stop sequence WPRE were inserted after the initiation codon ATG of mouse PD-1 gene in B-hPD-1/hPD-L1 mice(C).
•The endogenous mouse promoter and 5′ UTR are retained. The chimeric PD-1 expression is driven by the endogenous mouse PD-1 promoter, while endogenous mouse PD-1 transcription and translation are disrupted.
PD-L1
•Exon 3 of the mouse PD-L1 gene, which encode the IgV domain, was replaced with human PD-L1 exon 3 in B-hPD-1/hPD-L1 mice(C).
•The endogenous mouse promoter, 5′ UTR, 3′ UTR, and genomic regions encoding the signal peptide, non-IgV domain of the Extracellular domain, transmembrane and cytoplasmic domains are retained. The chimeric PD-L1 expression is driven by the endogenous mouse PD-L1 promoter, while endogenous mouse PD-L1 transcription and translation are disrupted.

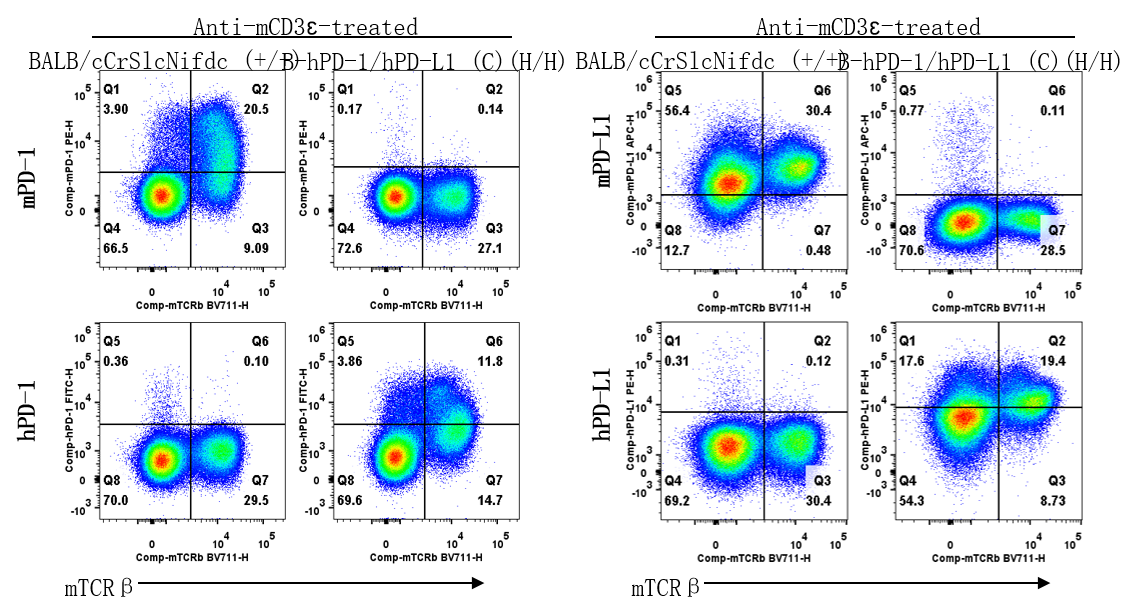
Strain-specific analysis of PD-1 protein expression in wild-type BALB/cCrSlcNifdc mice and homozygous B-hPD-1/hPD-L1 mice(C) by flow cytometry. Splenocytes were isolated from wild-type BALB/cCrSlcNifdc mice (+/+) and homozygous B-hPD-1/hPD-L1 mice(C) (H/H) and stimulated with anti-mouse CD3ε antibody. PD-1 expression was analyzed using anti-mouse PD-1 antibody (Biolegend, 109104) and anti-human PD-1 antibody (Biolegend, 329904). PD-L1 expression was analyzed using anti-mouse PD-1 antibody (Biolegend, 124312) and anti-human PD-1 antibody (Biolegend, 329706).
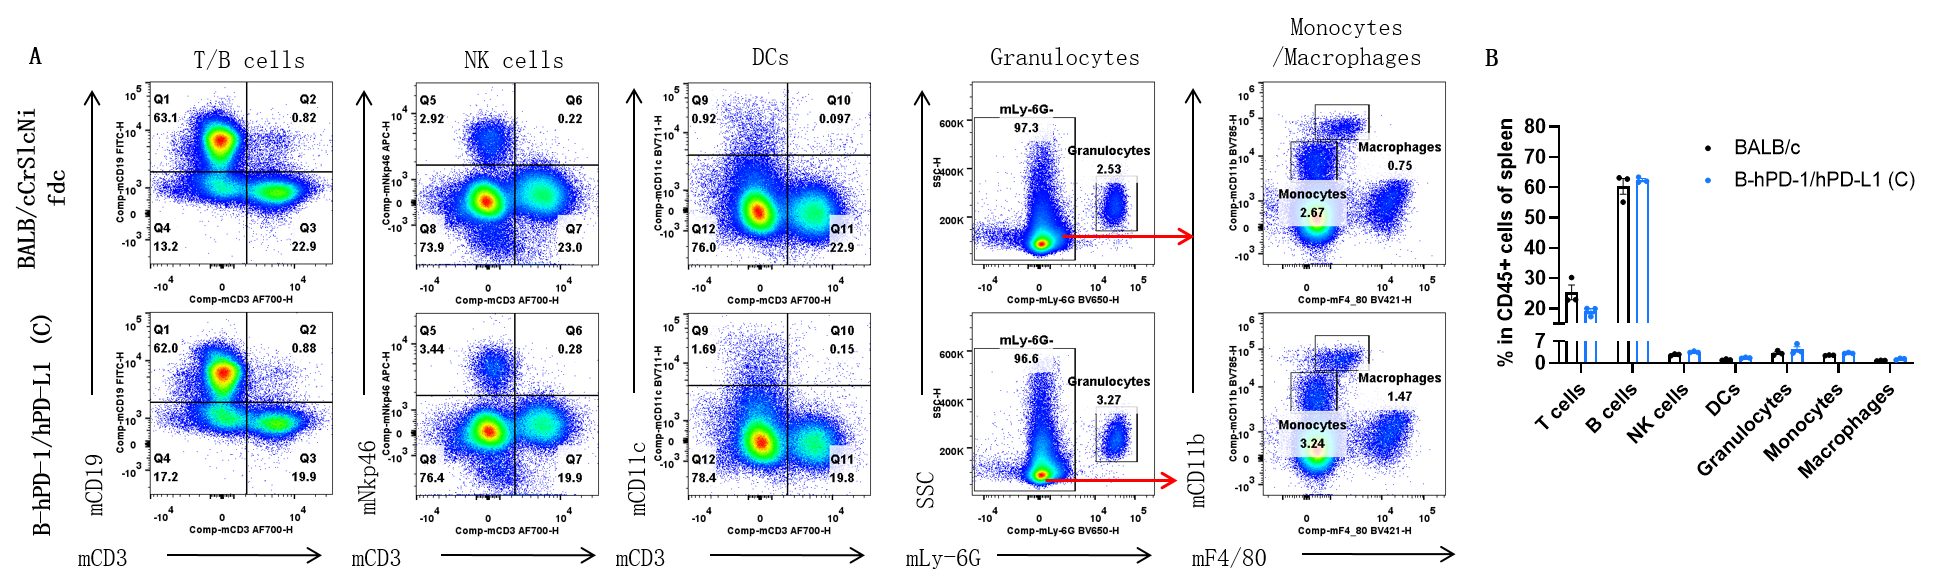
Analysis of spleen leukocyte subpopulations by FACS. Splenocytes were collected from female BALB/cCrSlcNifdc and B-hPD-1/hPD-L1 mice(C) (n=3, 7-week-old). Flow cytometry analysis of the splenocytes was performed to assess leukocyte subpopulations. A. Representative FACS plots. Single live cells were gated for the CD45+ population and used for further analysis as indicated here. B. Results of FACS analysis. The percentages of T cells, B cells, NK cells, dendritic cells, granulocytes, monocytes, and macrophages in homozygous B-hPD-1/hPD-L1 mice(C) were comparable to those in BALB/cCrSlcNifdc controls, indicating that PD-1 and PD-L1 humanization does not alter the overall development, differentiation, or distribution of these leukocyte populations in spleen. Values are expressed as mean ± SEM.
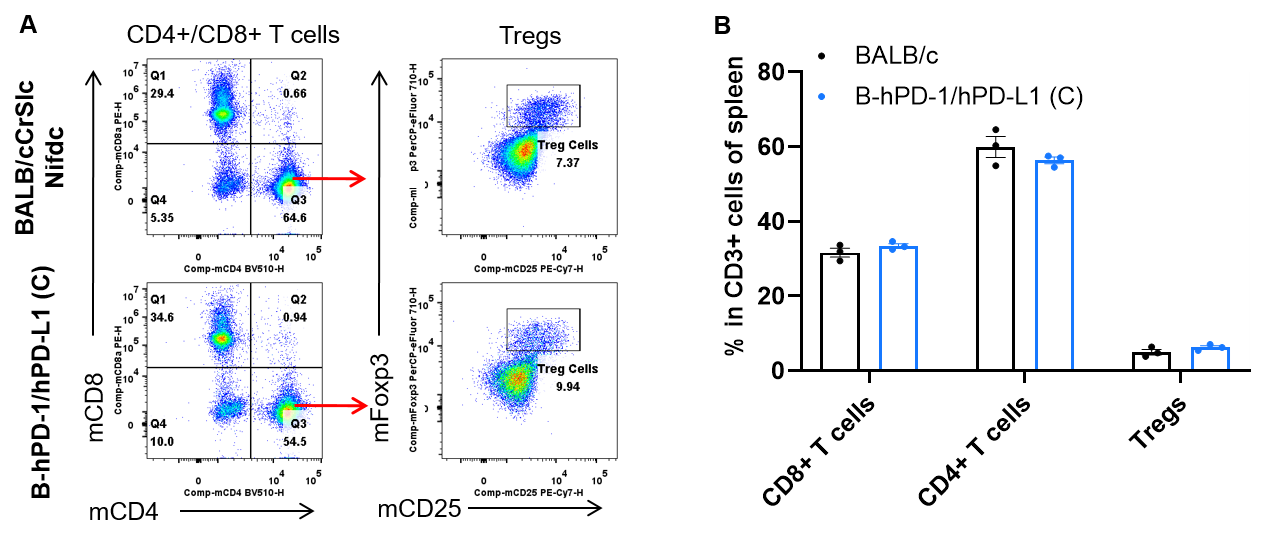
Analysis of spleen T cell subpopulations by FACS. Splenocytes were isolated from female BALB/cCrSlcNifdc and B-hPD-1/hPD-L1 mice(C) (n=3, 7-week-old). Single live CD45+ cells were gated for the CD3+ T-cell population and used for further analysis. The percentages of CD4+ T cells, CD8+ T cells, and Tregs in homozygous B-hPD-1/hPD-L1 mice(C) were comparable to those in BALB/cCrSlcNifdc controls, indicating that replacement of mouse PD-1 with human PD-1 does not alter the overall development, differentiation, or distribution of these T-cell subtypes in spleen. Values are expressed as mean ± SEM.
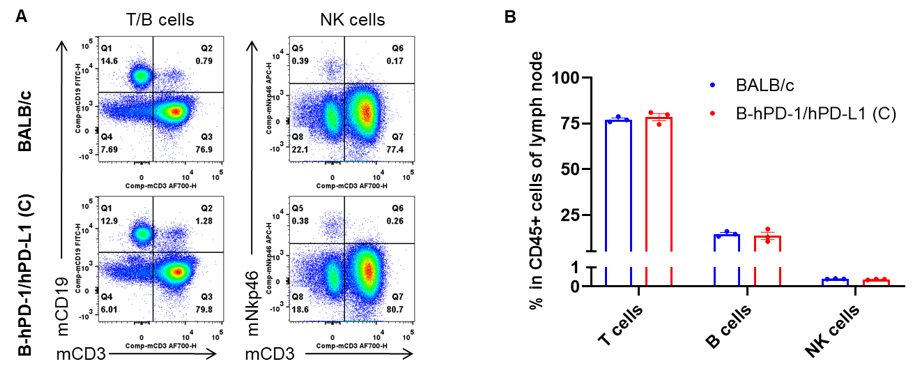
Analysis of lymph node leukocyte subpopulations by FACS. Lymph nodes were isolated from female BALB/cCrSlcNifdc and B-hPD-1/hPD-L1 mice(C) (n = 3, 7-week-old). Single live cells were gated for the CD45+ population and used for further analysis. The percentages of T cells, B cells, CD4+ T cells, CD8+ T cells, Tregs, and NK cells in homozygous B-hPD-1/hPD-L1 mice(C) were comparable to those in BALB/cCrSlcNifdc controls, indicating that PD-1 and PD-L1 humanization does not alter the overall development, differentiation, or distribution of these immune-cell populations in lymph nodes. Values are expressed as mean ± SEM.
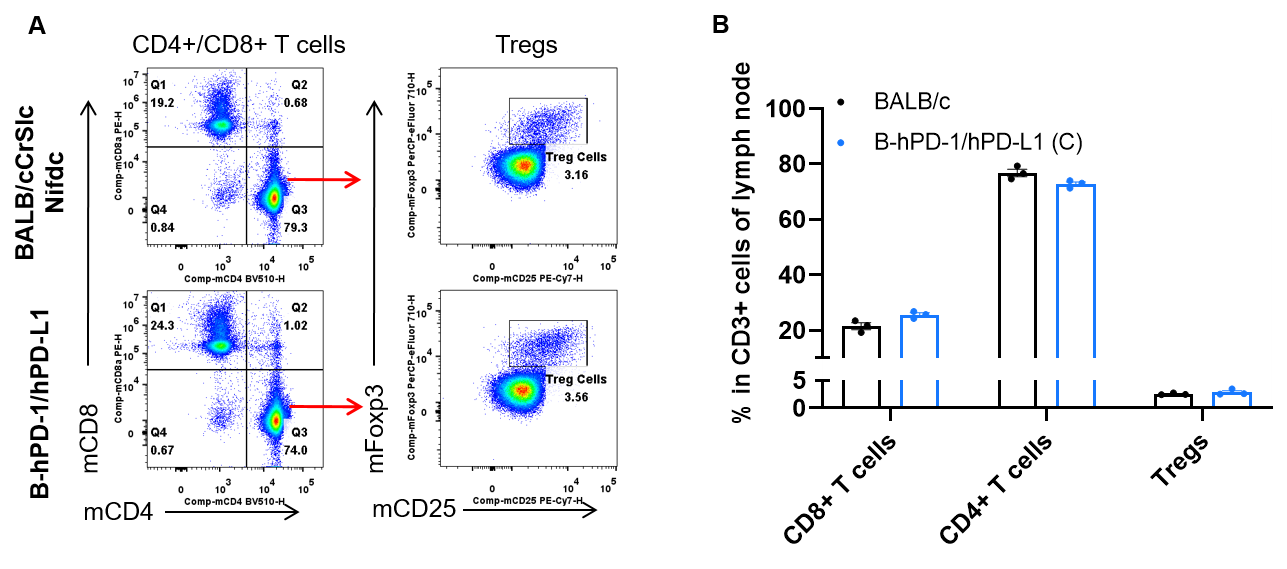
Analysis of lymph node T cell subpopulations by FACS. Lymph nodes were isolated from female BALB/cCrSlcNifdc and B-hPD-1/hPD-L1 mice(C) (n=3, 7-week-old). Single live CD45+ cells were gated for the CD3+ T-cell population and used for further analysis. The percentages of CD4+ T cells, CD8+ T cells, and Tregs in homozygous B-hPD-1/hPD-L1 mice(C) were comparable to those in BALB/cCrSlcNifdc controls, indicating that replacement of PD-1 and PD-L1 humanization does not alter the overall development, differentiation, or distribution of these T-cell subtypes in lymph nodes. Values are expressed as mean ± SEM.
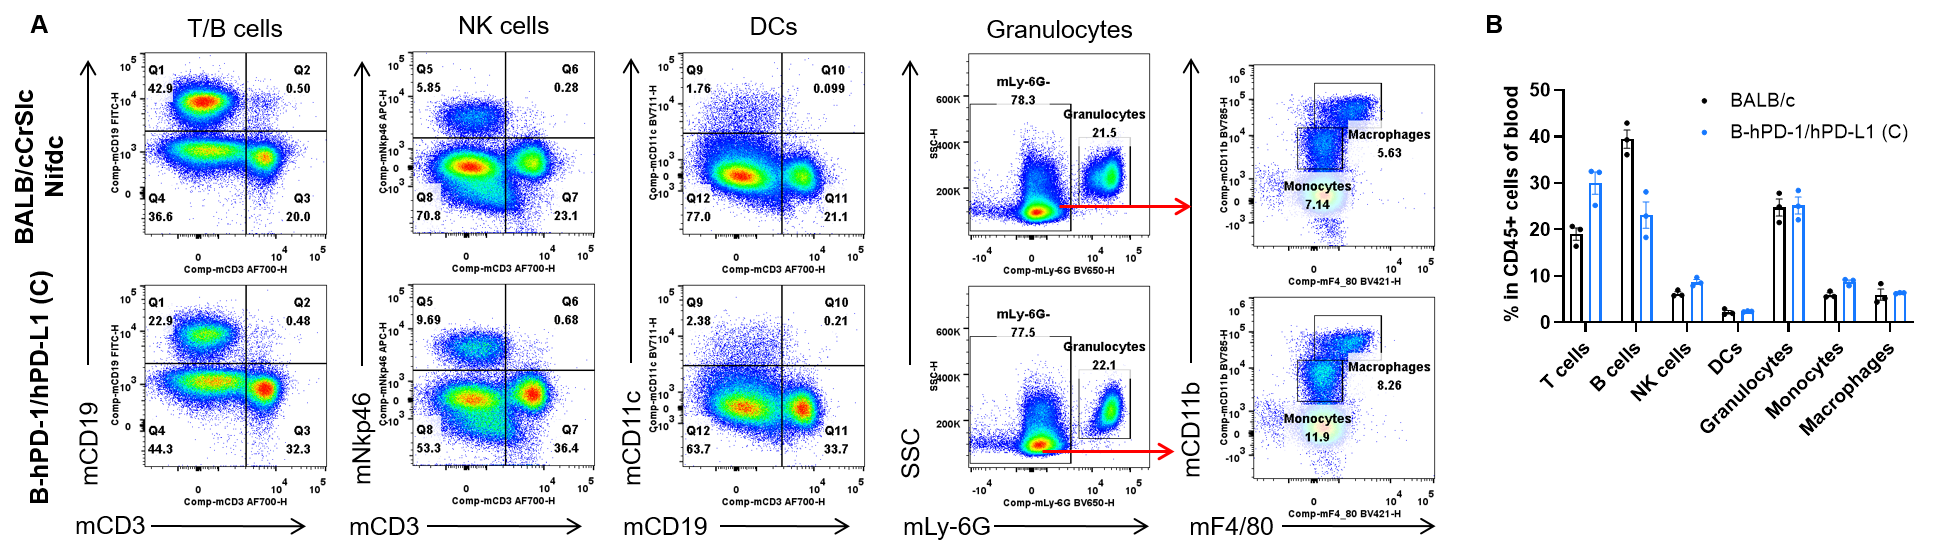
Analysis of blood leukocyte subpopulations by FACS. Blood cells were isolated from female BALB/cCrSlcNifdc and B-hPD-1/hPD-L1 mice(C) (n = 3, 7-week-old). Single live cells were gated for the CD45+ population and used for further analysis. The percentages of T cells, B cells, CD4+ T cells, CD8+ T cells, Tregs, and NK cells in homozygous B-hPD-1/hPD-L1 mice(C) were comparable to those in BALB/cCrSlcNifdc controls, indicating that PD-1 and PD-L1 humanization does not alter the overall development, differentiation, or distribution of these immune-cell populations in blood. Values are expressed as mean ± SEM.
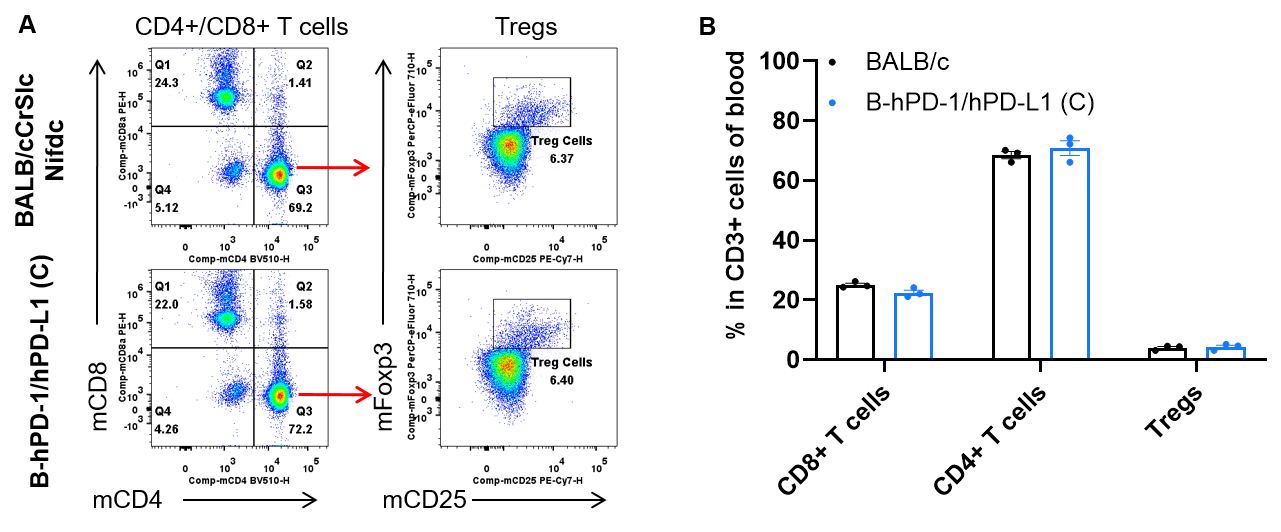
Analysis of blood T cell subpopulations by FACS. Blood cells were isolated from female BALB/cCrSlcNifdc and B-hPD-1/hPD-L1 mice(C) (n=3, 7-week-old). Single live CD45+ cells were gated for the CD3+ T-cell population and used for further analysis. The percentages of CD4+ T cells, CD8+ T cells, and Tregs in homozygous B-hPD-1/hPD-L1 mice(C) were comparable to those in BALB/cCrSlcNifdc controls, indicating that replacement of PD-1 and PD-L1 humanization does not alter the overall development, differentiation, or distribution of these T-cell subtypes in blood. Values are expressed as mean ± SEM.

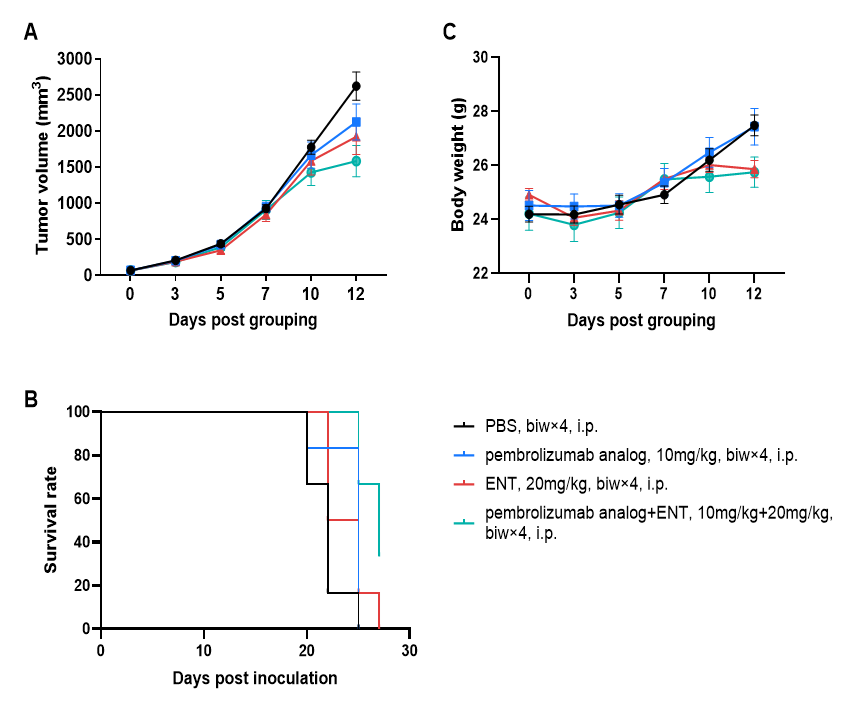
Antitumor activity of combination of pembrolizumab analog (in-house) and entinostat (ENT) in B-hPD-1/hPD-L1 mice(C). (A) Combination of pembrolizumab analog and ENT inhibited B-hPD-L1 CT26.WT tumor growth in B-hPD-1/hPD-L1 mice(C). Murine colon cancer B-hPD-L1 CT26.WT cells were subcutaneously implanted into homozygous B-hPD-1/hPD-L1 mice(C) (female, 7-week-old, n=6). Mice were grouped when tumor volume reached approximately 60-80 mm3, at which time they were treated with pembrolizumab analog and ENT with doses indicated in panel; (B) Survival curve; (C) Body weight changes during treatment. B-hPD-1/hPD-L1 mice(C) provide a powerful preclinical model for in vivo evaluation of anti-human PD-1 antibodies and tumor microenvironment inhibitors. Values are expressed as mean ± SEM.