
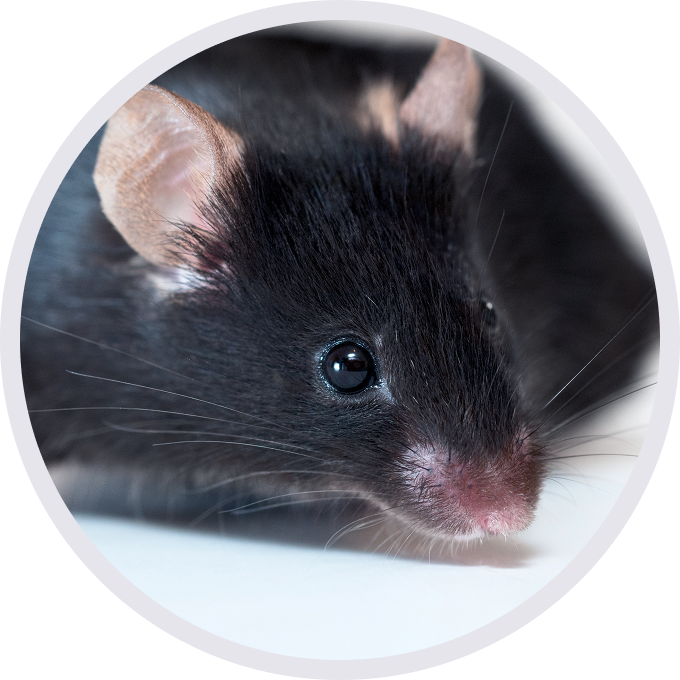
C57BL/6-Pkd1tm1Bcgen Gt(ROSA)26Sortm1(CAG-icre/ERT2)Bcgen/Bcgen • 114411

Introduction:
Gene targeting strategy:
mRNA expression analysis:
Serum biochemistry analysis:
Urine biochemistry analysis:
H&E analysis:
Application:

Gene targeting strategy for B-Pkd1 flox, CAG-iCreERT2 mice.
B-Pkd1 flox, CAG-iCreERT2 mice were obtained by mating B-Pkd1 flox mice (114146) and B-CAG-iCreERT2 mice (110147).
Upon tamoxifen induction, Pkd1 is globally deleted in all tissues.

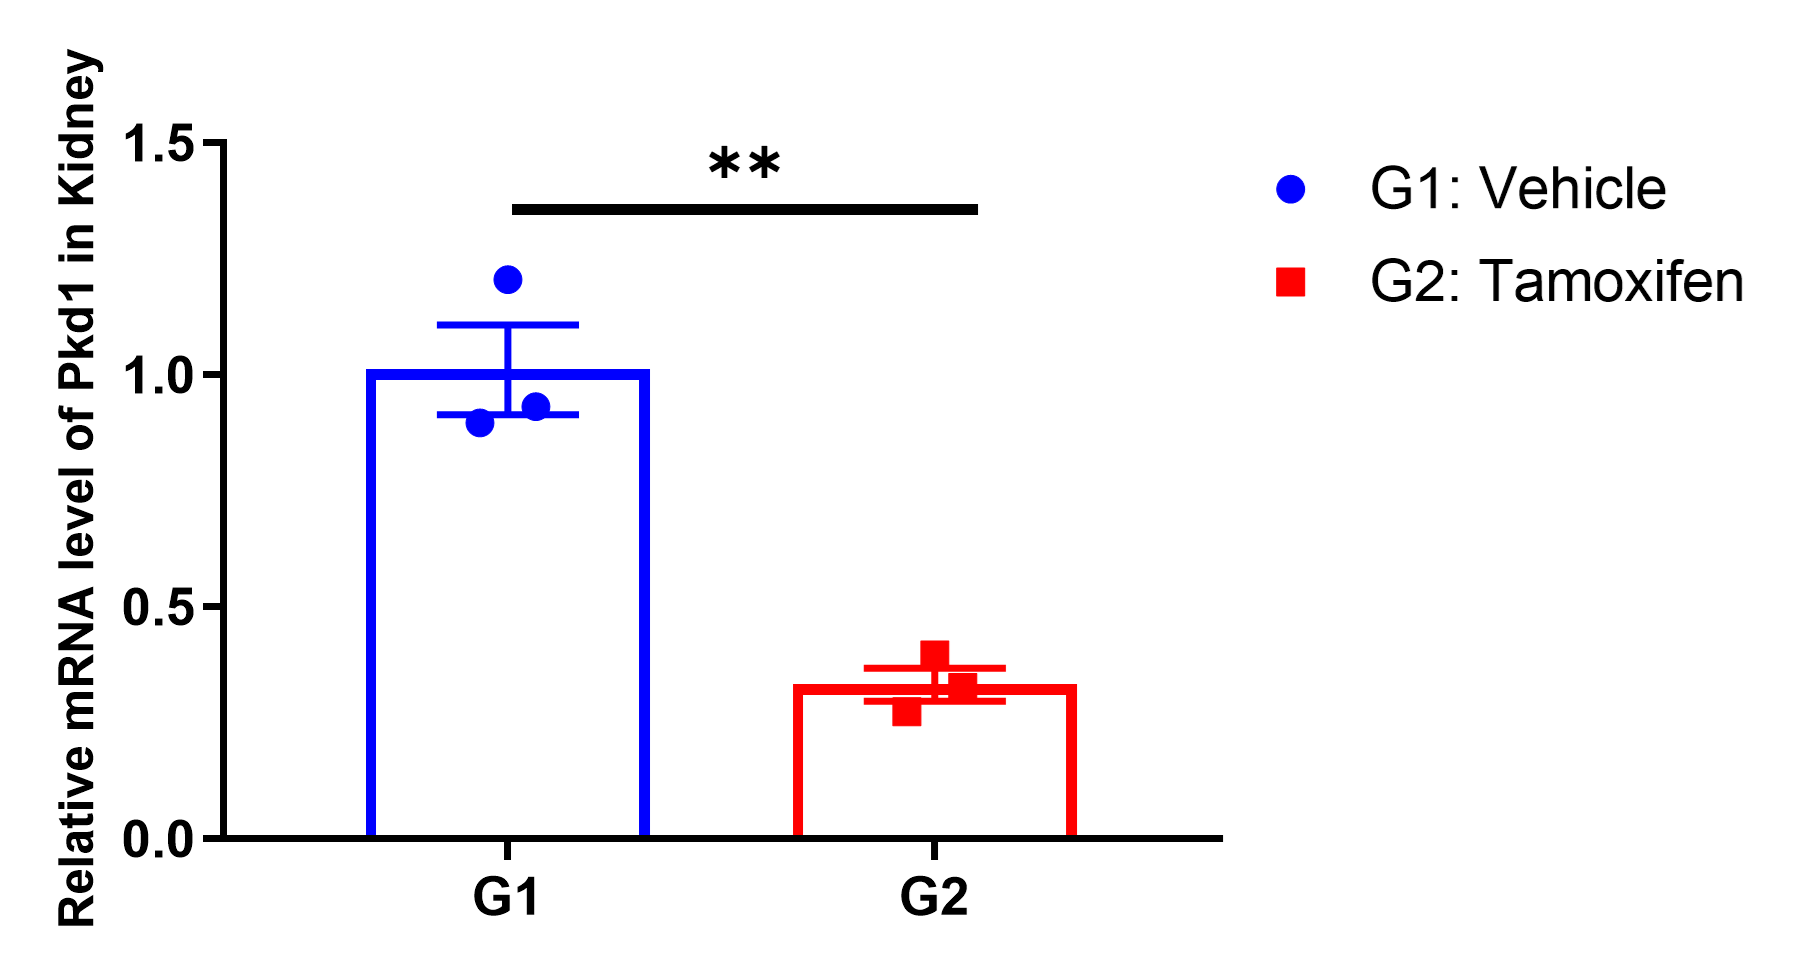
Strain specific analysis of Pkd1 gene expression in B-Pkd1 flox, CAG-iCreERT2 mice by RT-qPCR. Kidney RNA was isolated from homozygous B-Pkd1 flox, CAG-iCreERT2 mice (flox/flox, KI/+) (male, 7w, n=3). At 10 weeks post-tamoxifen administration (100 mpk), the mRNA expression of Pkd1 was significantly reduced. Values are expressed as mean ± SEM. Analyzed by 2 way-ANOVA, *P<0.05, **P<0.01, ***P<0.001.
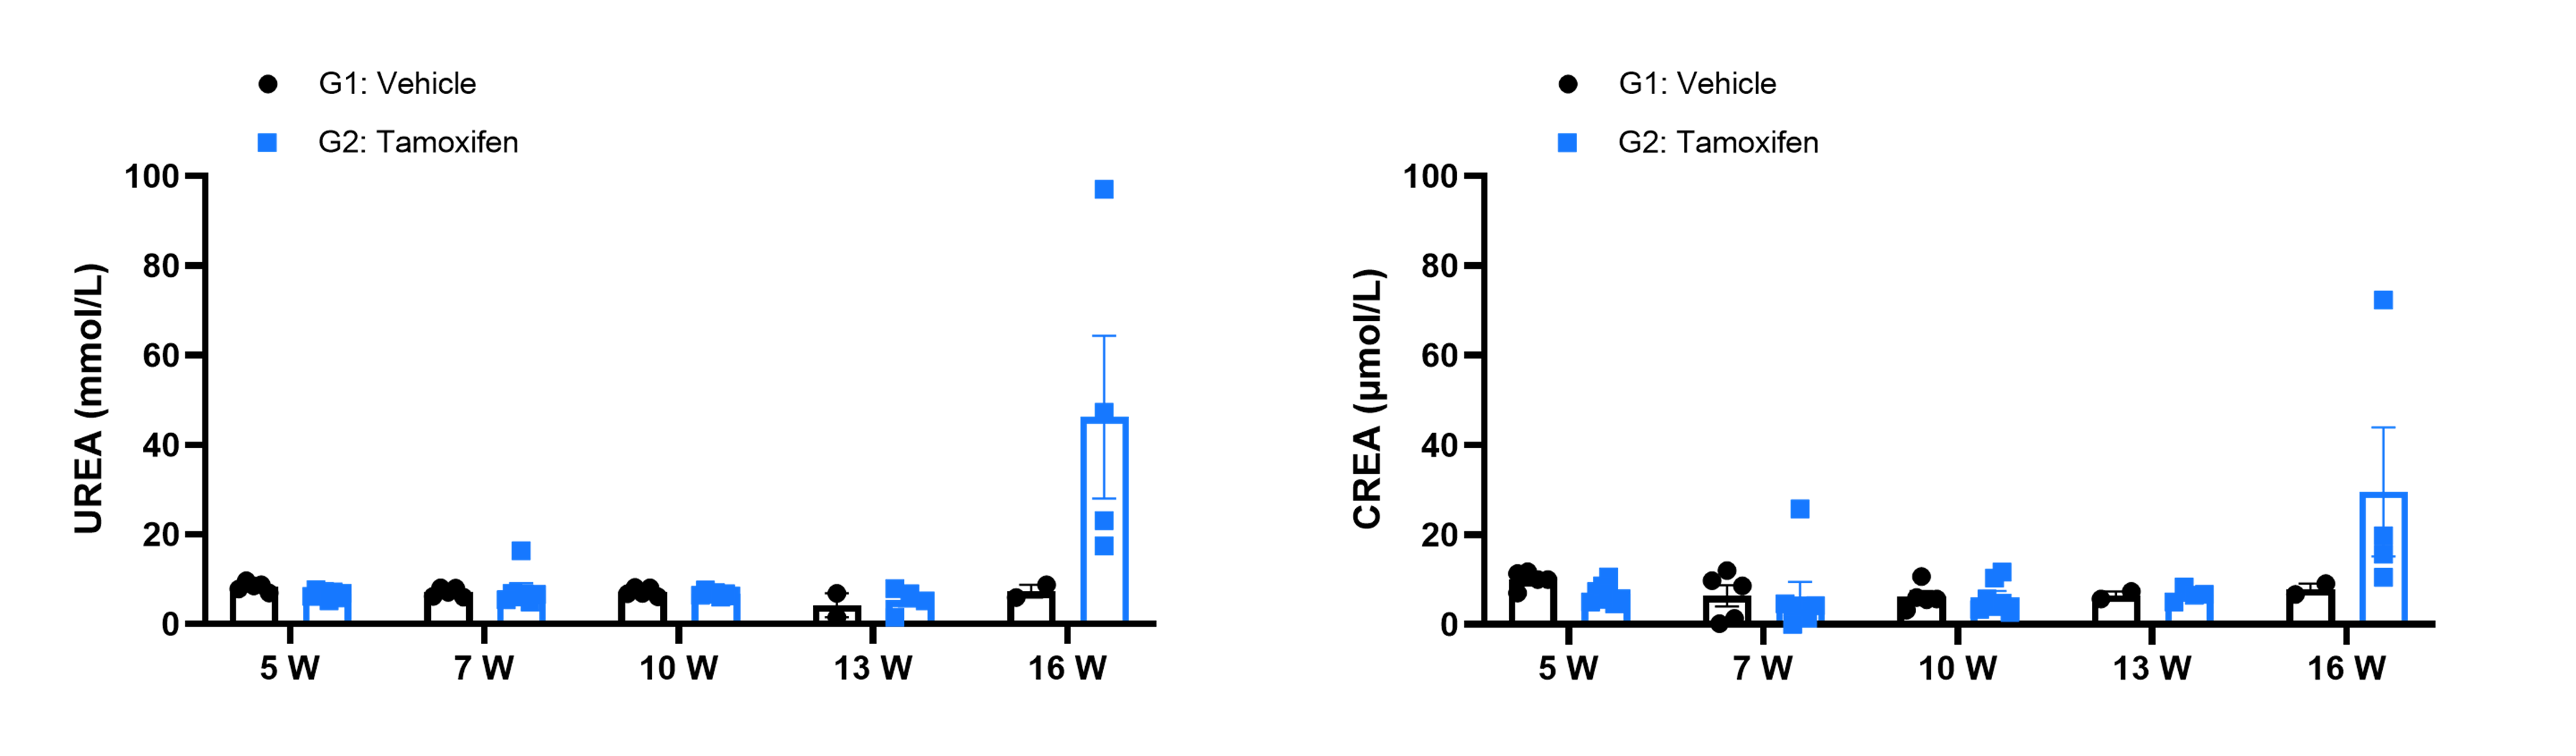
Serum biochemistry analysis of B-Pkd1 flox, CAG-iCreERT2 mice. Serum UREA and creatinine (CREA) levels were longitudinally monitored in B-Pkd1 flox, CAG-iCreERT2 mice (flox/flox, KI/+). G1 served as corn oil‑treated vehicle control and G2 received tamoxifen (TAM, 100 mg/kg). Serum samples were collected at 5, 7, 10, 13 and 16 weeks post-induction. Compared with the control group, tamoxifen‑induced mice exhibited markedly increased serum urea and creatinine levels at 16 weeks post-induction, while no obvious differences were observed at earlier time‑points. Values are expressed as mean ± SEM.
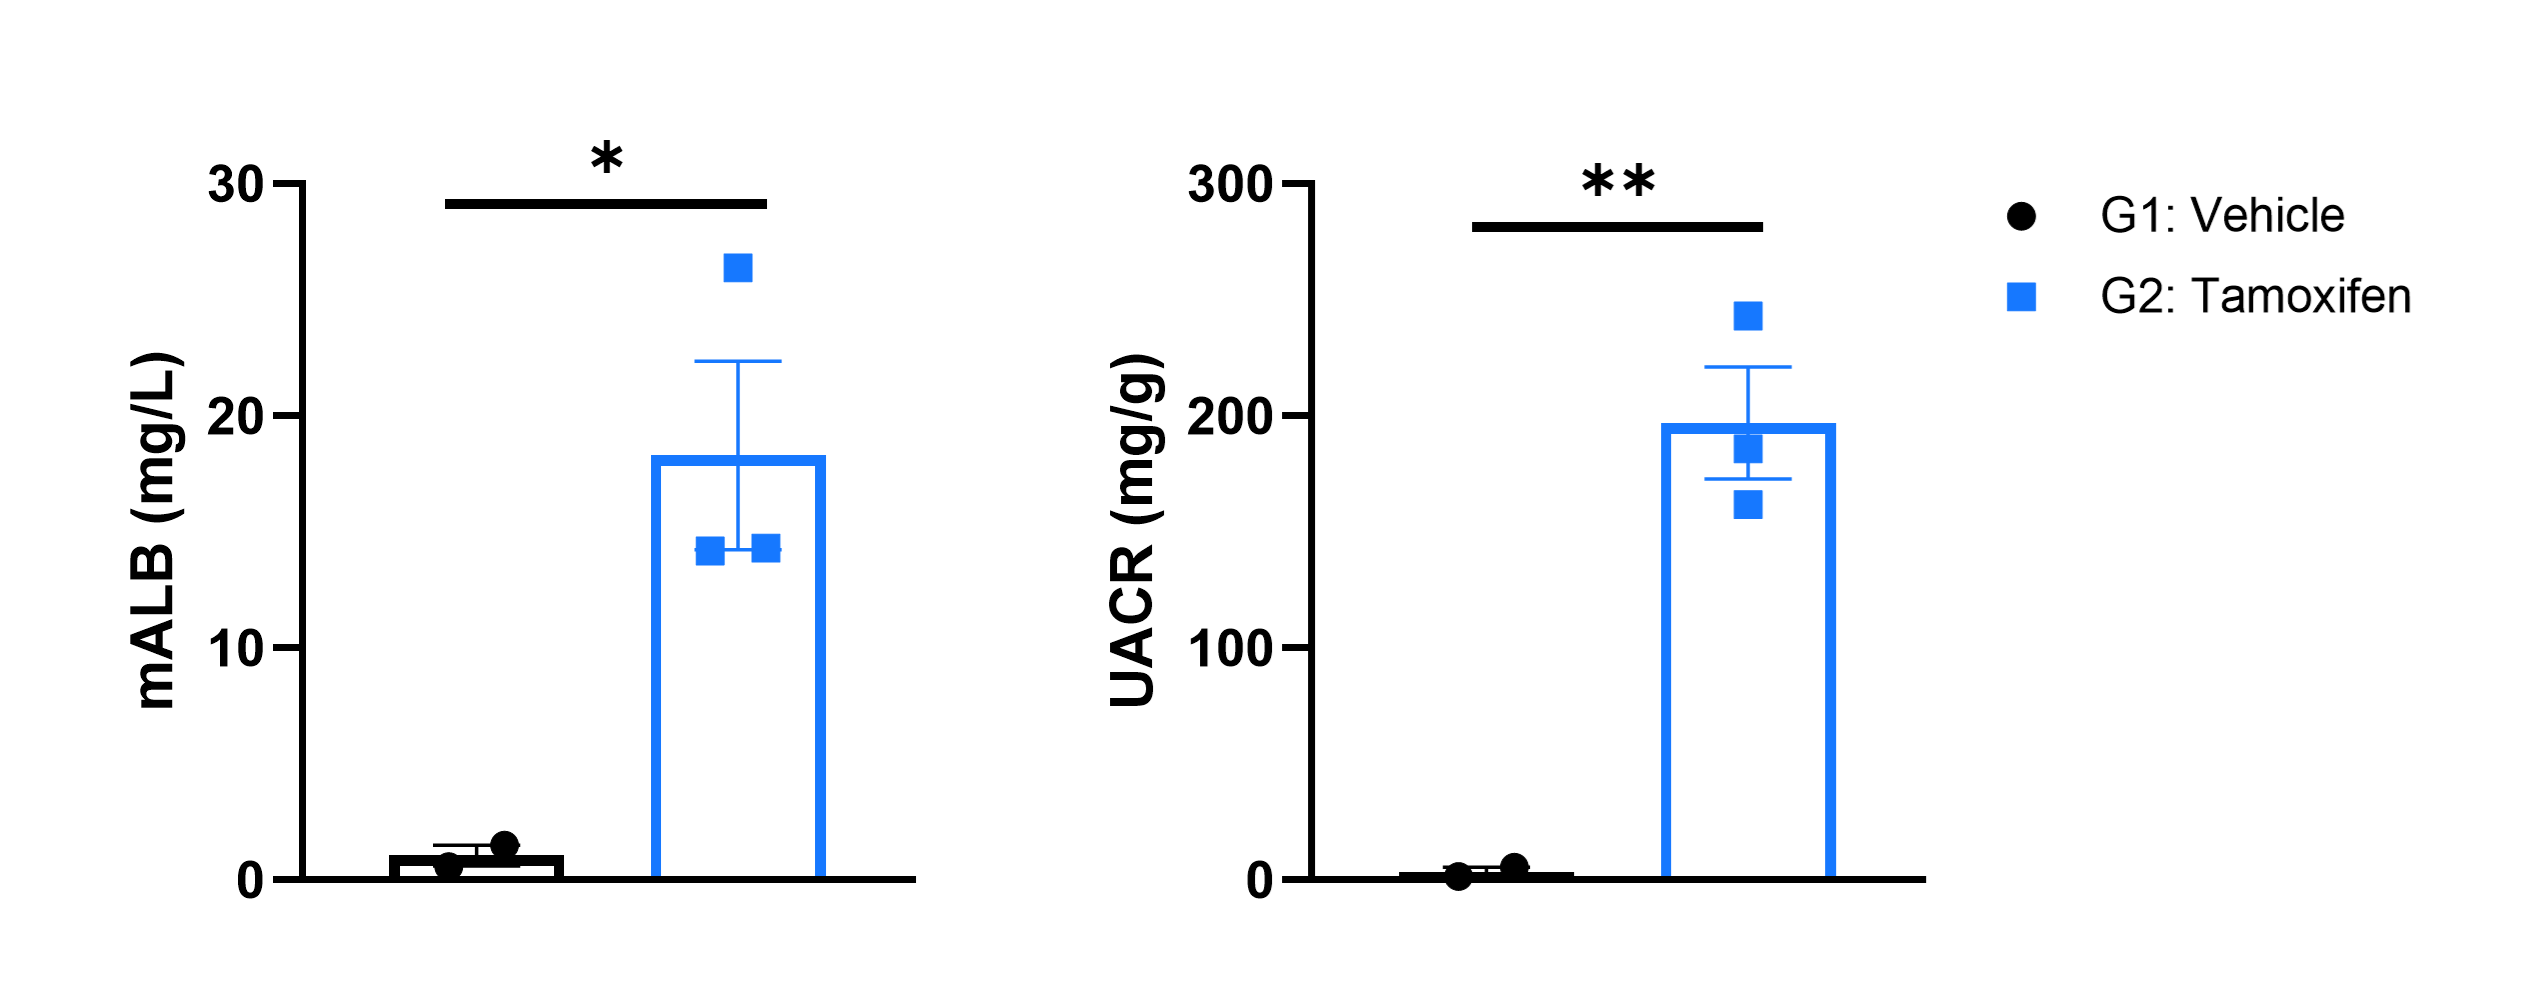
Urine biochemistry analysis of B-Pkd1 flox, CAG-iCreERT2 mice. Urinary mALB and UACR levels were detected in B‑Pkd1 flox, CAG‑iCreERT2 mice (flox/flox, KI/+). G1 served as corn‑oil‑treated vehicle control and G2 received tamoxifen (TAM, 100 mg/kg). Compared with the control group, tamoxifen‑induced mice showed significantly elevated urinary mALB and UACR at 16 weeks post-induction. Values are expressed as mean ± SEM. Analyzed by 2‑way‑ANOVA, *P<0.05, **P<0.01, ***P<0.001.
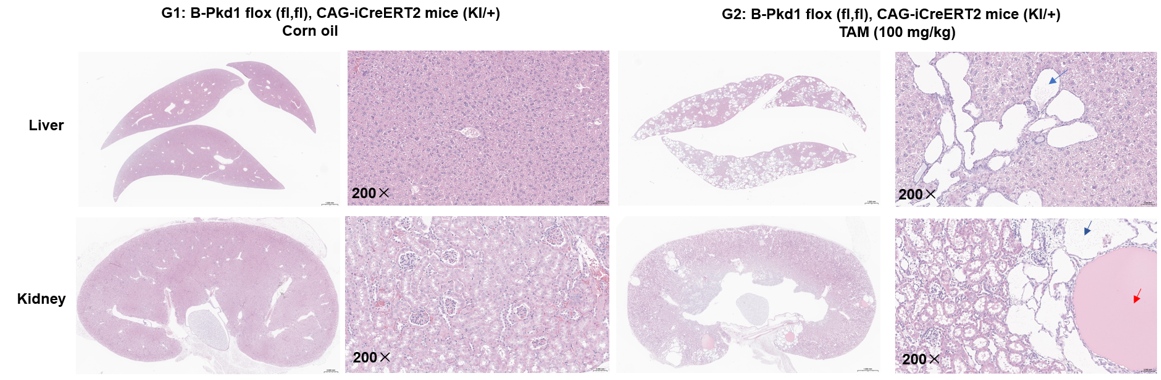
H&E analysis in wild-type C57BL/6JNifdc and B-Pkd1 flox, CAG-iCreERT2 mice. At 10 weeks post-tamoxifen administration, animals were sacrificed, and their livers and kidneys were processed for histopathological analysis. Induced mice developed pronounced pathological lesions in liver and kidney relative to controls: the liver displayed widespread cysts and prominent biliary hyperplasia, whereas the kidney showed focal cyst formation, dilated renal tubules, and intratubular casts. Red arrows: Tubular casts; Blue arrows: Cysts.
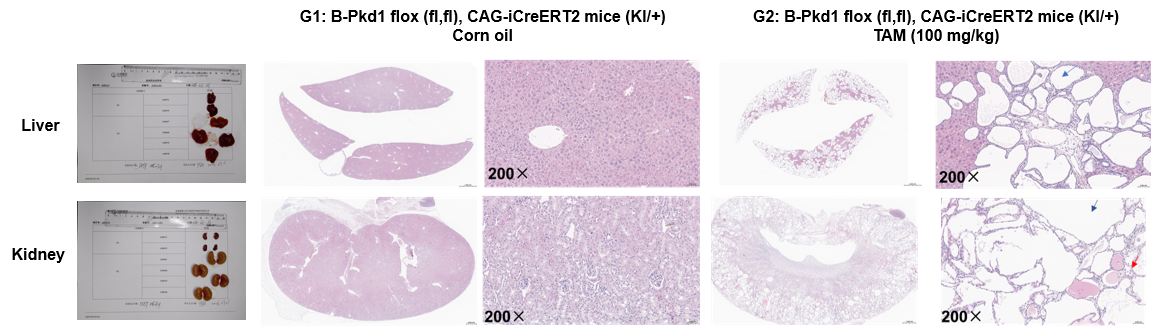
H&E analysis in wild-type C57BL/6JNifdc and B-Pkd1 flox, CAG-iCreERT2 mice. At 16 weeks post tamoxifen administration, animals were sacrificed, and their livers and kidneys were processed for HE histopathological analysis. Compared with corn‑oil‑treated control group (G1), tamoxifen‑induced mice (G2) exhibited more severe pathological lesions in both liver and kidney: the liver showed extensive cystic lesions; the kidney displayed widespread cyst formation, massive renal tubular dilation and intratubular casts. Red arrows: Tubular casts; Blue arrows: Cysts.