

C57BL/6-Egfrtm2(EGFR)Bcgen/Bcgen • 120771
on this page

Key Advantages
Validation
Application

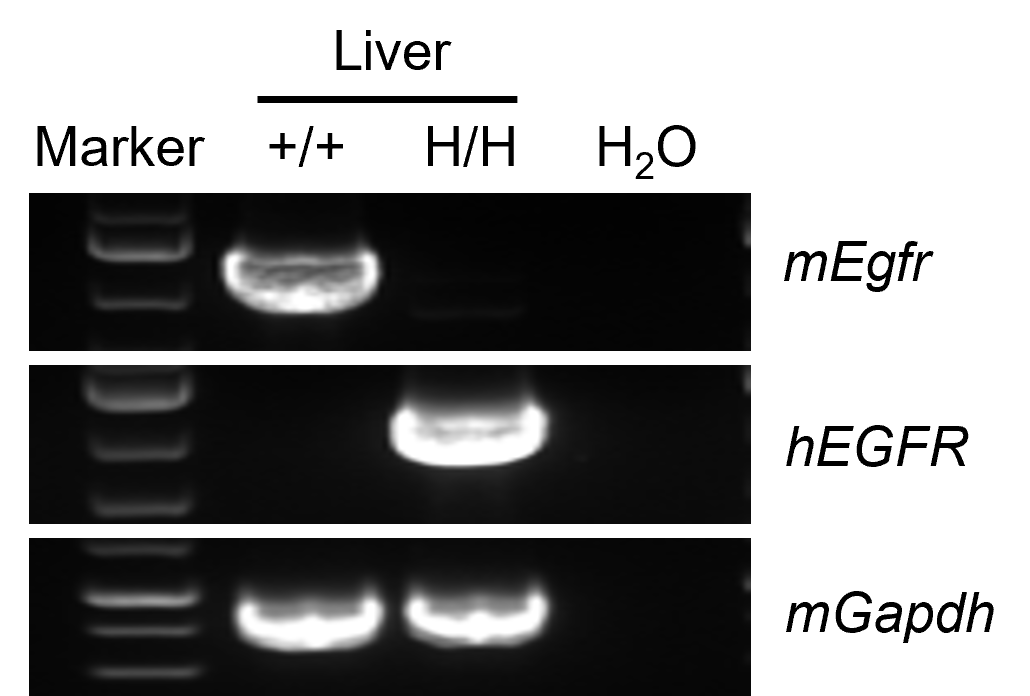
Human EGFR expression in B-hEGFR mice confirmed by RT-PCR and sequencing. Liver RNA from wild-type C57BL/6 (+/+) and homozygous B-hEGFR (H/H) mice was analyzed by RT-PCR. Mouse Egfr was detected in wild-type mice, whereas human EGFR was detected in B-hEGFR mice. Sequencing confirmed the expected human EGFR sequence.
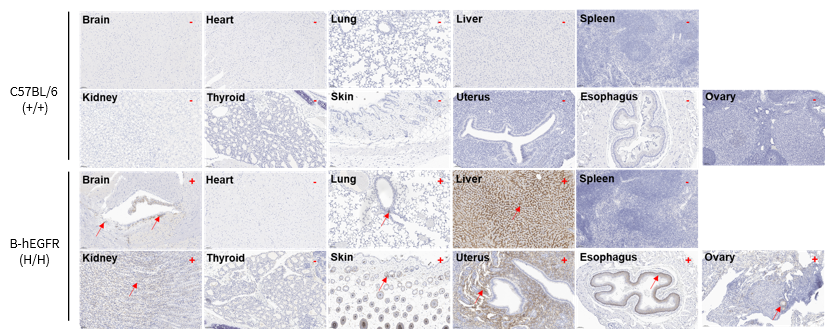
Immunohistochemical analysis of human EGFR expression in EGFR humanized mice. Major organs from wild-type C57BL/6 and homozygous B-hEGFR mice were stained with anti-EGFR antibody. EGFR staining was observed in the brain, lung, liver, kidney, skin, uterus, esophagus, and ovary, but not in the heart, spleen, or thyroid. Arrows indicate positive staining (brown).“+” and “-” indicate positive and negative tissues, respectively.
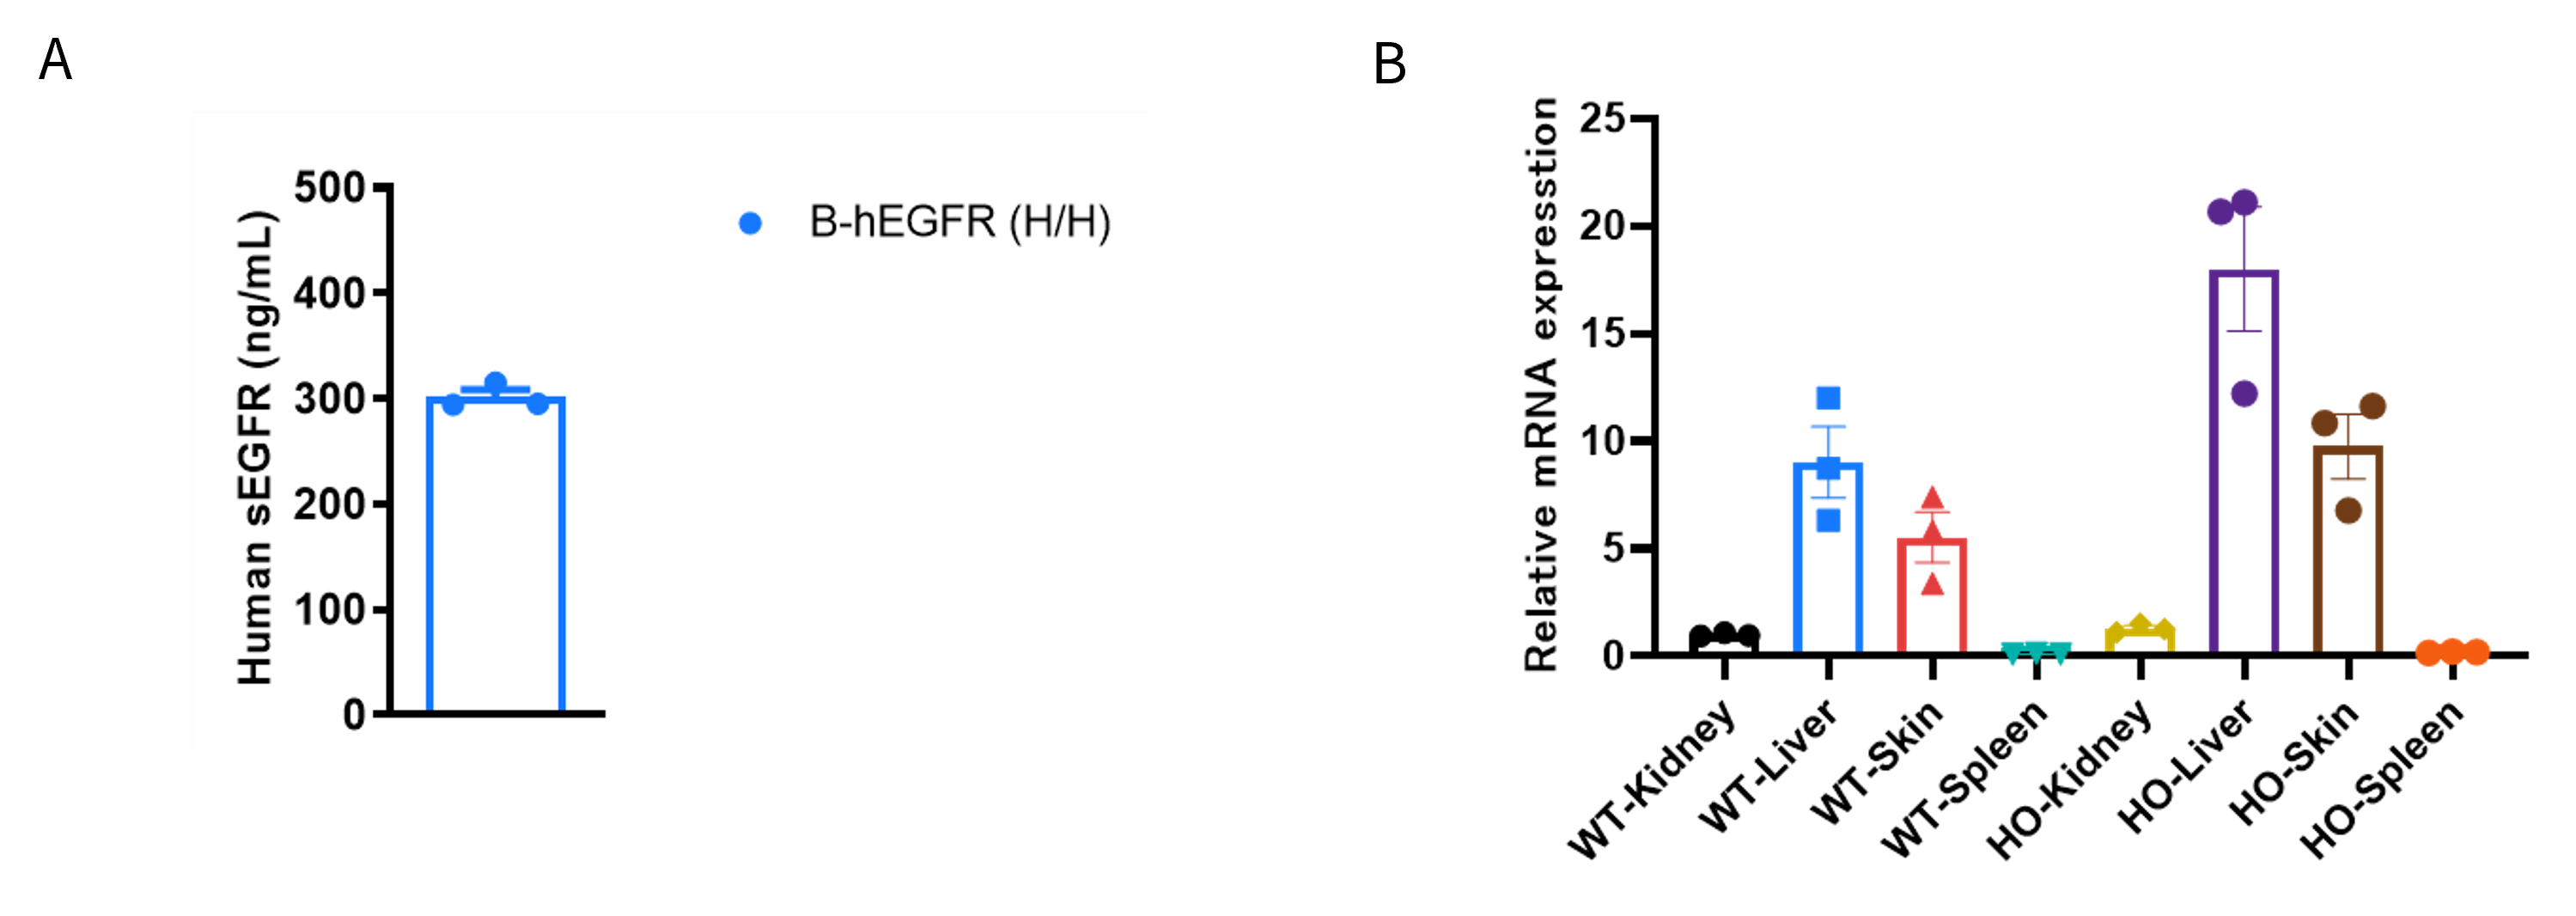
Human EGFR protein and EGFR mRNA expression in EGFR humanized mice. (A) Plasma human sEGFR levels in homozygous B-hEGFR mice were measured by ELISA. (B) Egfr mRNA expression in kidney, liver, skin, and spleen from wild-type and homozygous B-hEGFR mice was analyzed by qPCR, with higher expression observed in the liver and skin of B-hEGFR mice.
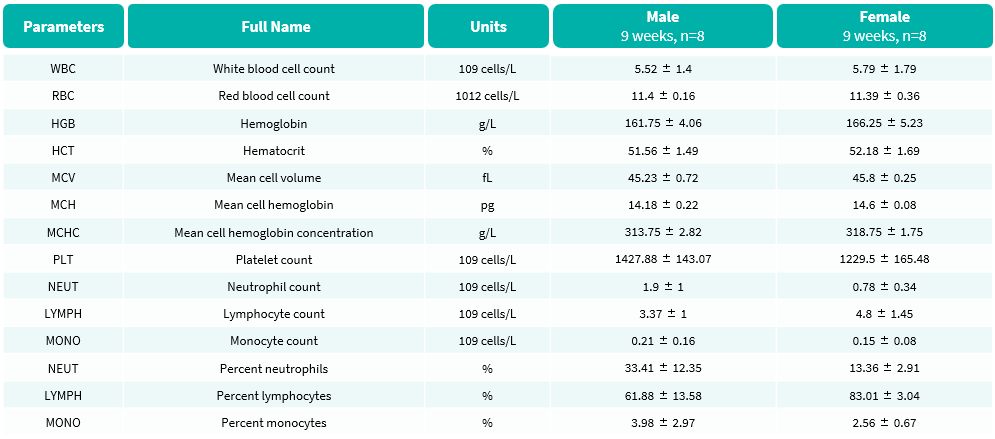
Complete blood count (CBC) of B-hEGFR Mice. Values are expressed as mean ± SD.
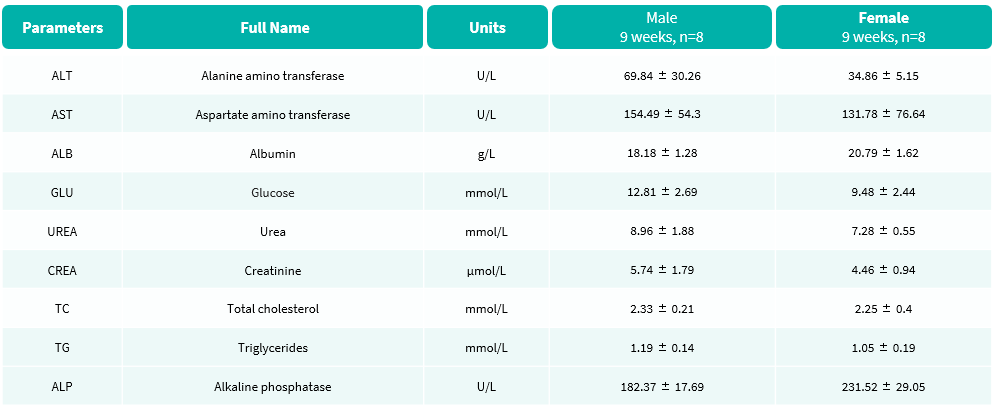
Blood biochemical parameters of B-hEGFR Mice are shown. Values are expressed as mean ± SD.

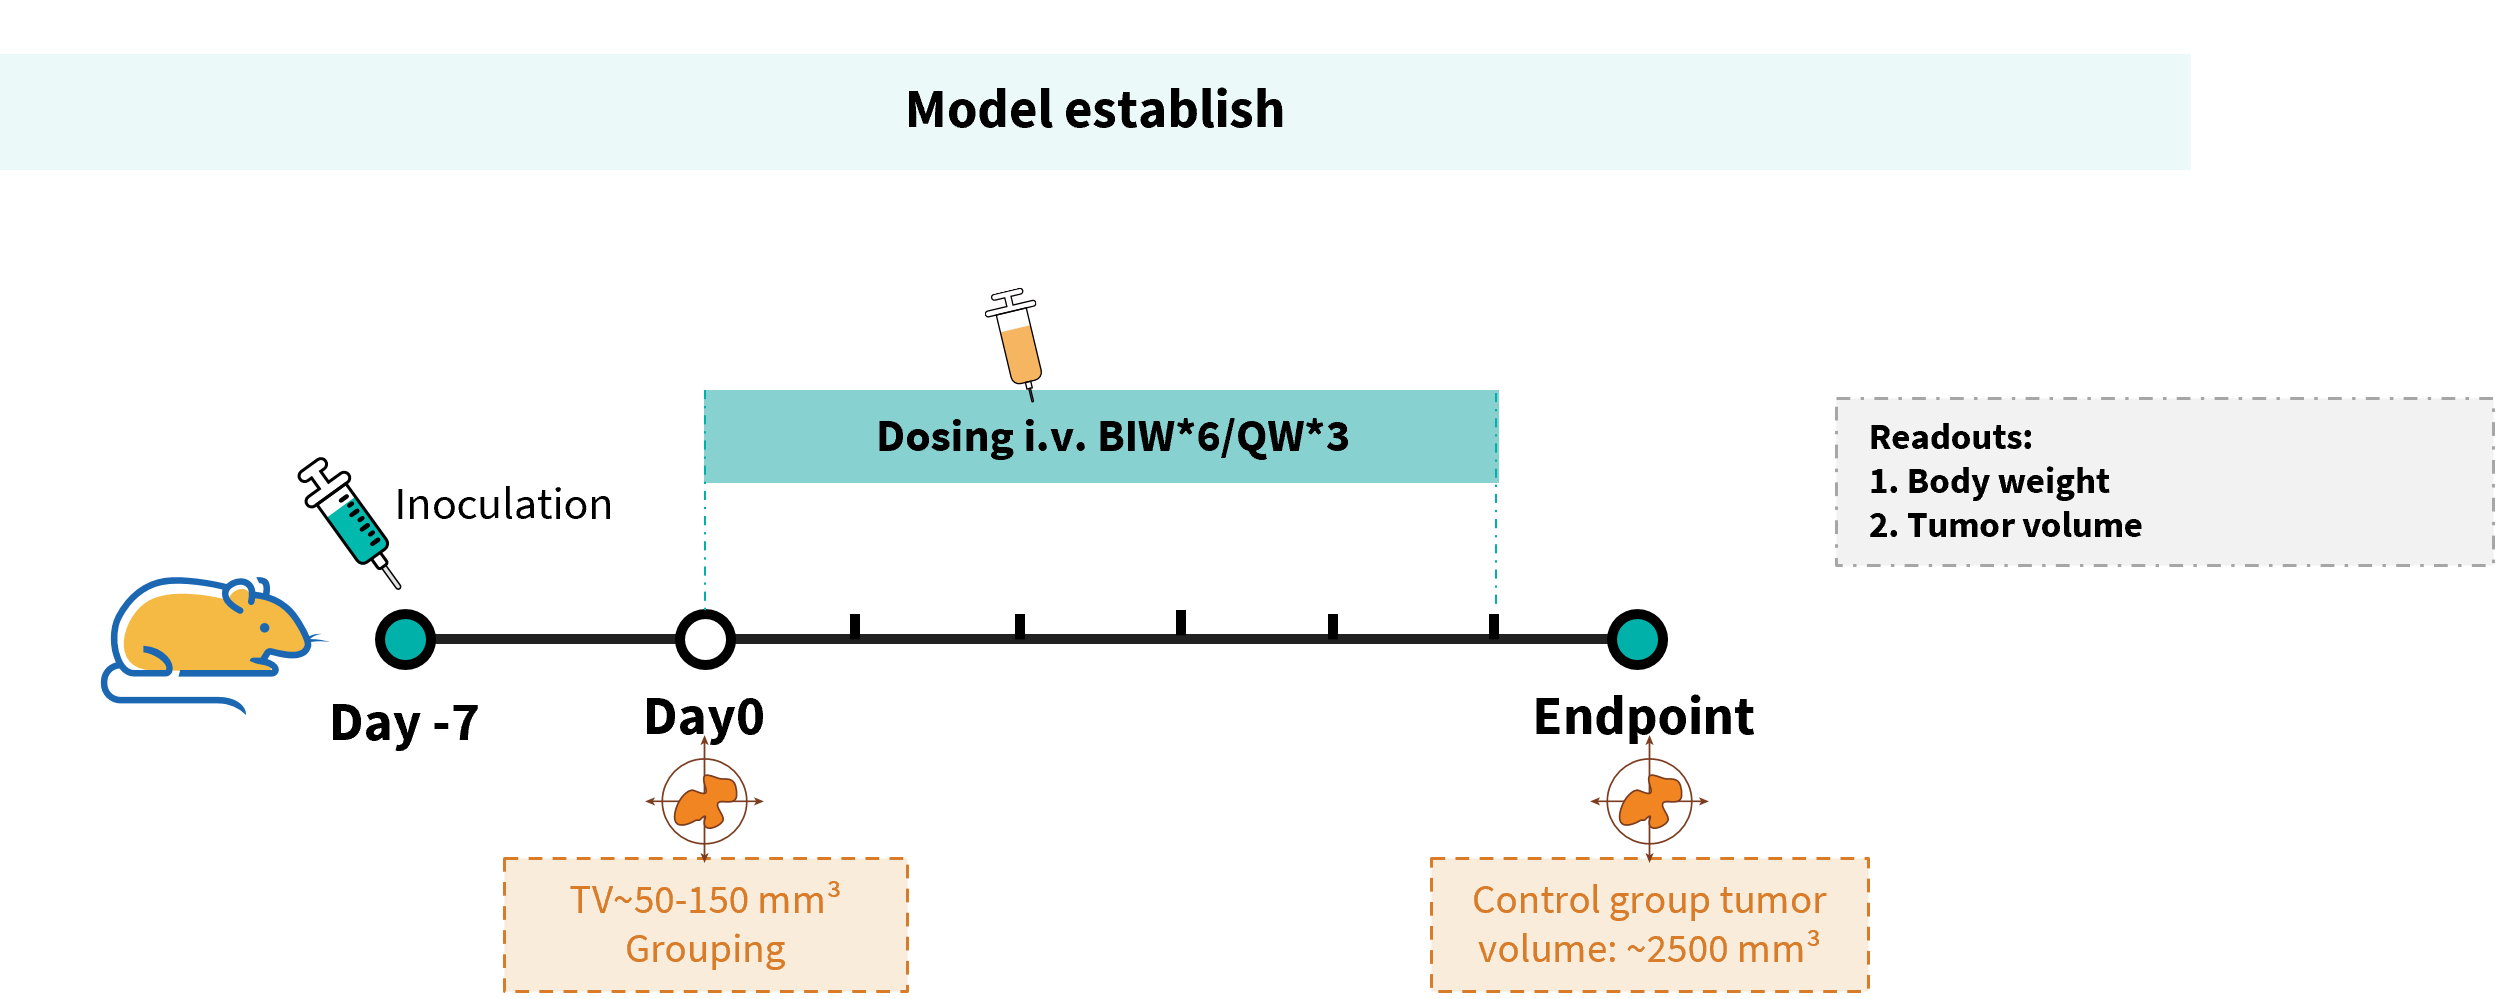
Study design for the B-Tg(hEGFR) MC38 tumor model in B-hEGFR mice. B-Tg(hEGFR) MC38 cells were implanted subcutaneously into homozygous B-hEGFR mice. When tumors reached approximately 50–150 mm³, mice were randomized and treated intravenously with Cetuximab analog–MMAE.

Cetuximab analog–MMAE inhibits B-Tg(hEGFR) MC38 tumor growth in B-hEGFR mice. (A) Tumor growth curves. (B) Body weight changes during treatment.

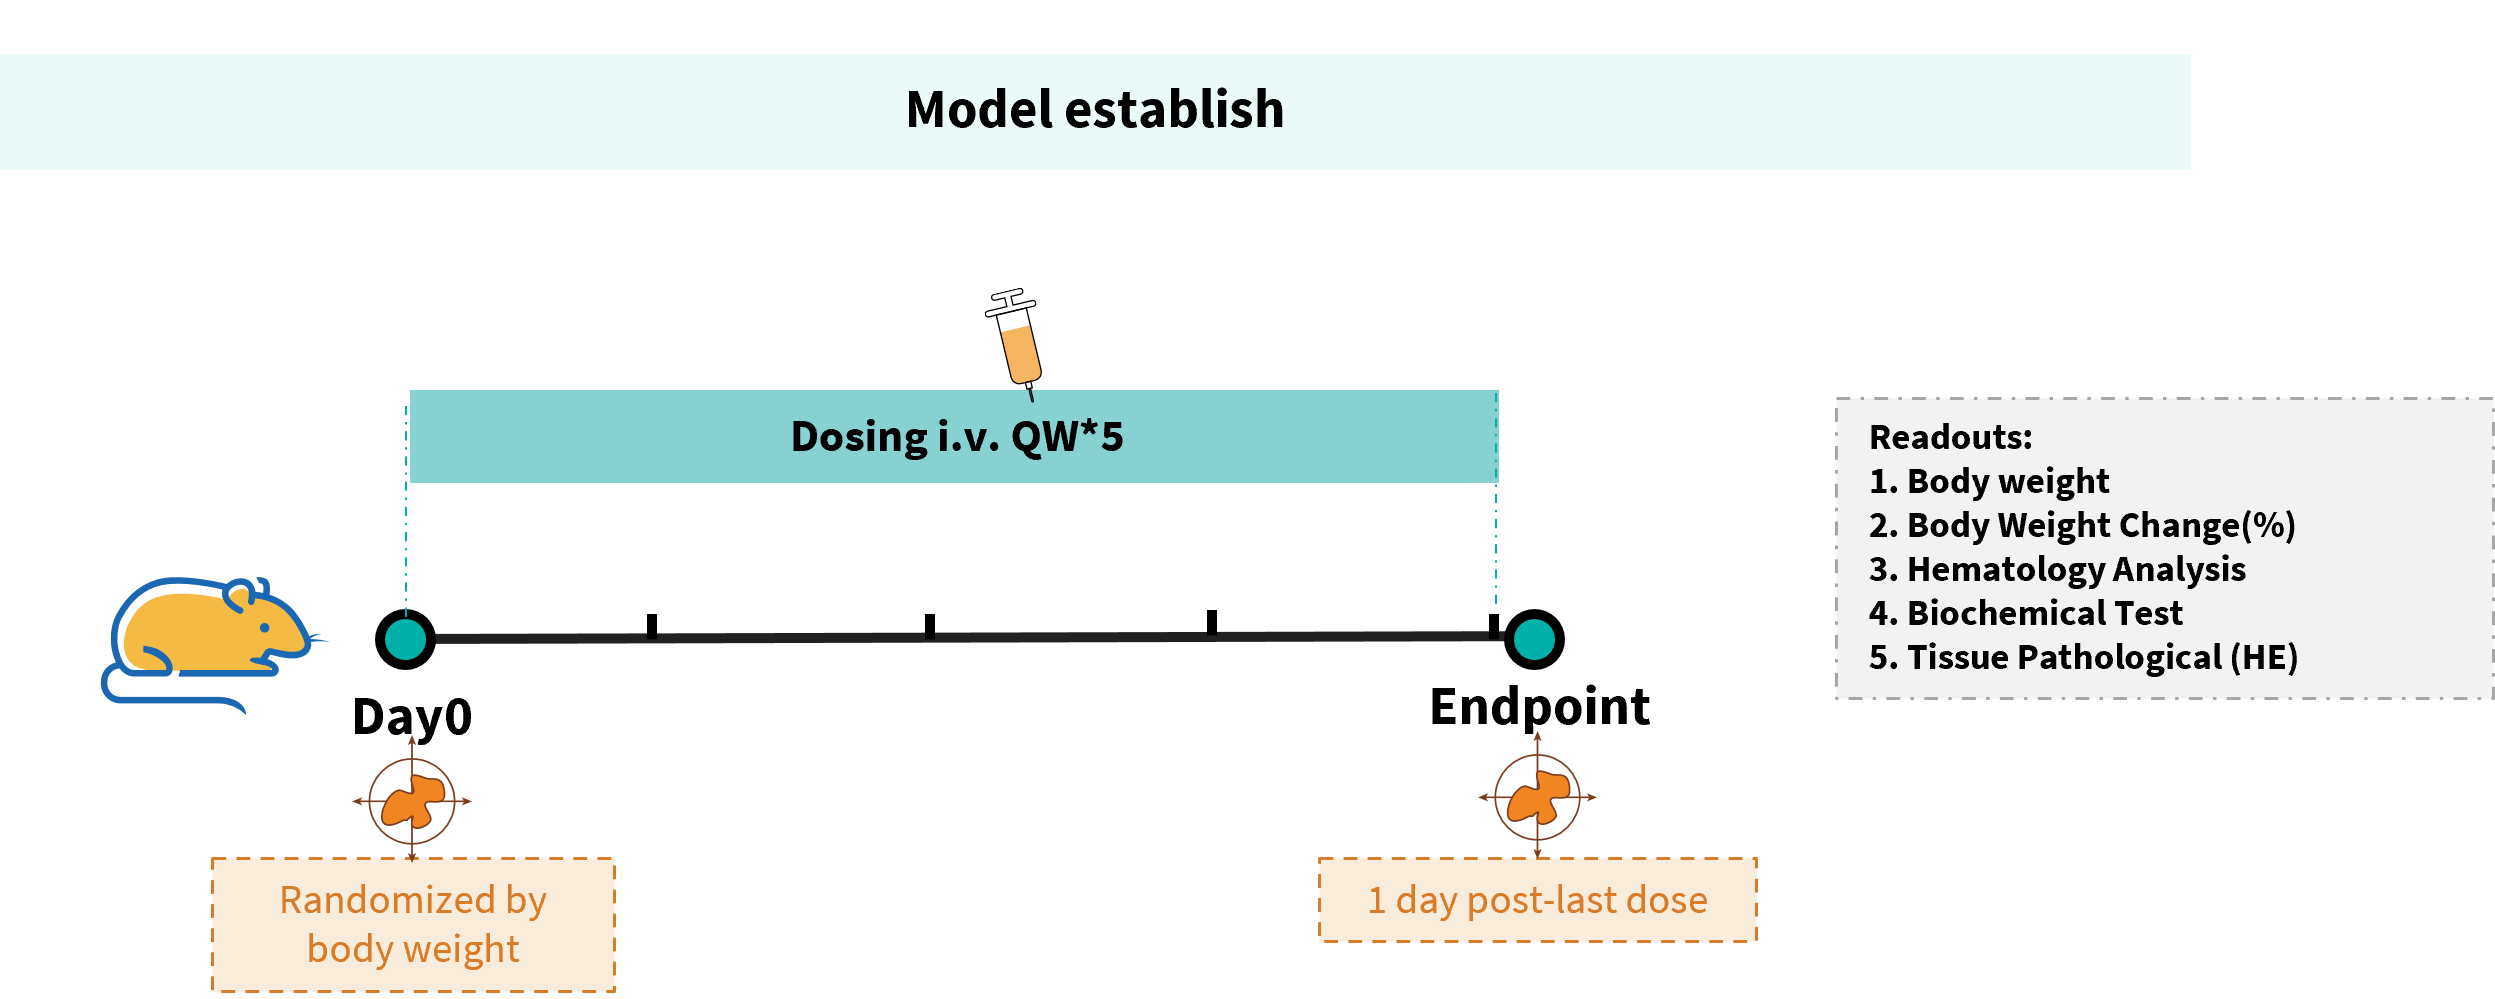
Study design for toxicity evaluation of EGFR-targeting antibodies in EGFR humanized mice. B-hEGFR mice received intravenous cetuximab biosimilar or panitumumab QW×5. Body weight, hematology, serum biochemistry, and histopathology were evaluated. Note: This experiment is a collaboration with the client.

Body weight changes following anti-human EGFR antibody treatment in EGFR humanized mice. (A) Body weight and (B) body weight change during treatment with cetuximab biosimilar or panitumumab. Note: This experiment is a collaboration with the client.
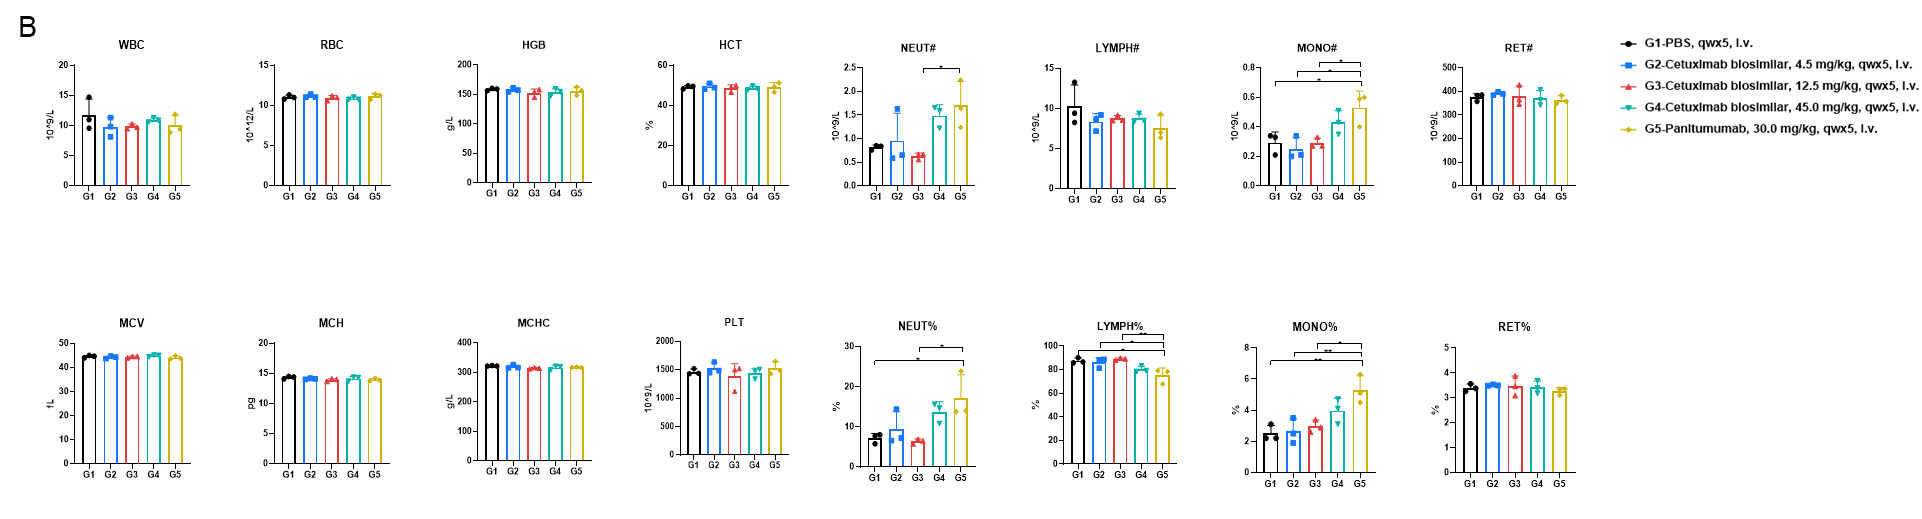
Toxicity evaluation of EGFR-targeted antibody drugs in B-hEGFR mice. (B) Complete blood cell count detection at the endpoint of the experiment. 45.0 mg/kg cetuximab biosimilar and 30.0 mg/kg panitumumab resulted in an increase in the number of neutrophils and monocytes, while there were no significant changes in blood parameters in the other treatment groups.
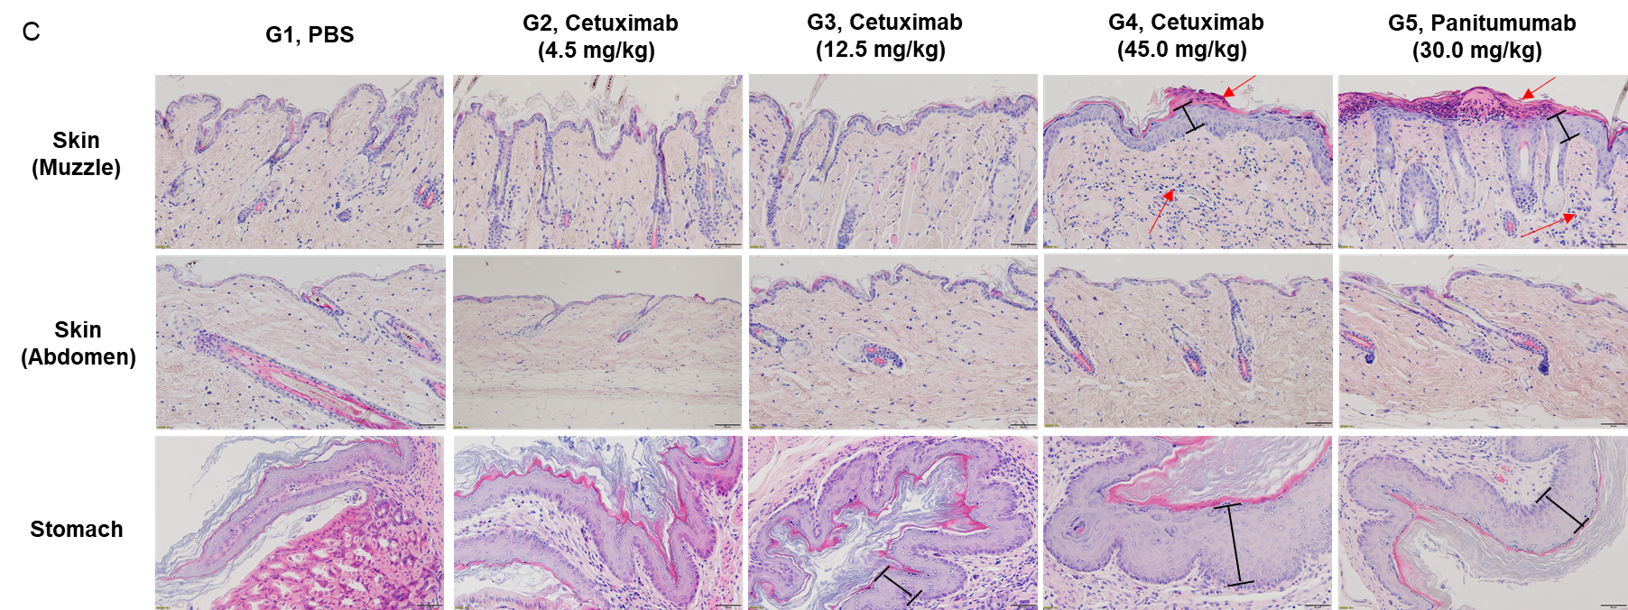
Toxicity evaluation of EGFR-targeted antibody drugs in B-hEGFR mice. (C) Pathological diagrams of various tissues. The histopathological examination in muzzle skin revealed article-related alteration in cetuximab biosimilar 45 mg/kg dose group (1/6, minimal), which showed squamous epithelial cells proliferation and subcutaneous infiltration of inflammatory cells. The similar article-related changes were also found in panitumumab group (5/6, minimal). Squamous epithelial cells proliferation in stomach limiting ridge were observed in mice administrated cetuximab biosimilar at the dose of 12.5 mg/kg (4/6, minimal) and 45 mg/kg groups (2/6, minimal; 4/6, slight), which were considered test-article and dose related. The similar article-related changes were also found in panitumumab group (3/6, minimal; 3/6, slight). Neither cetuximab biosimilar nor panitumumab showed any toxicity in the abdominal skin, duodenum, jejunum, ileum, cecum, colon, and rectum of mice (The data is not shown). Note: This experiment is a collaboration with the client.

Toxicokinetic analysis of anti-human EGFR antibody in EGFR humanized mice. Anti-human EGFR antibody cetuximab biosimilar (Bio X Cell, 907623J2) or panitumumab (Takeda, 549661) were intravenously injected into B-hEGFR mice (male, 14-15 weeks-old, n=2). Blood samples were collected at 1h, 8h, 24h, 48h, 96h, and 168h after the first and fourth doses, and then the drug concentrations in the blood were measured.
Note: This experiment is a collaboration with the client.
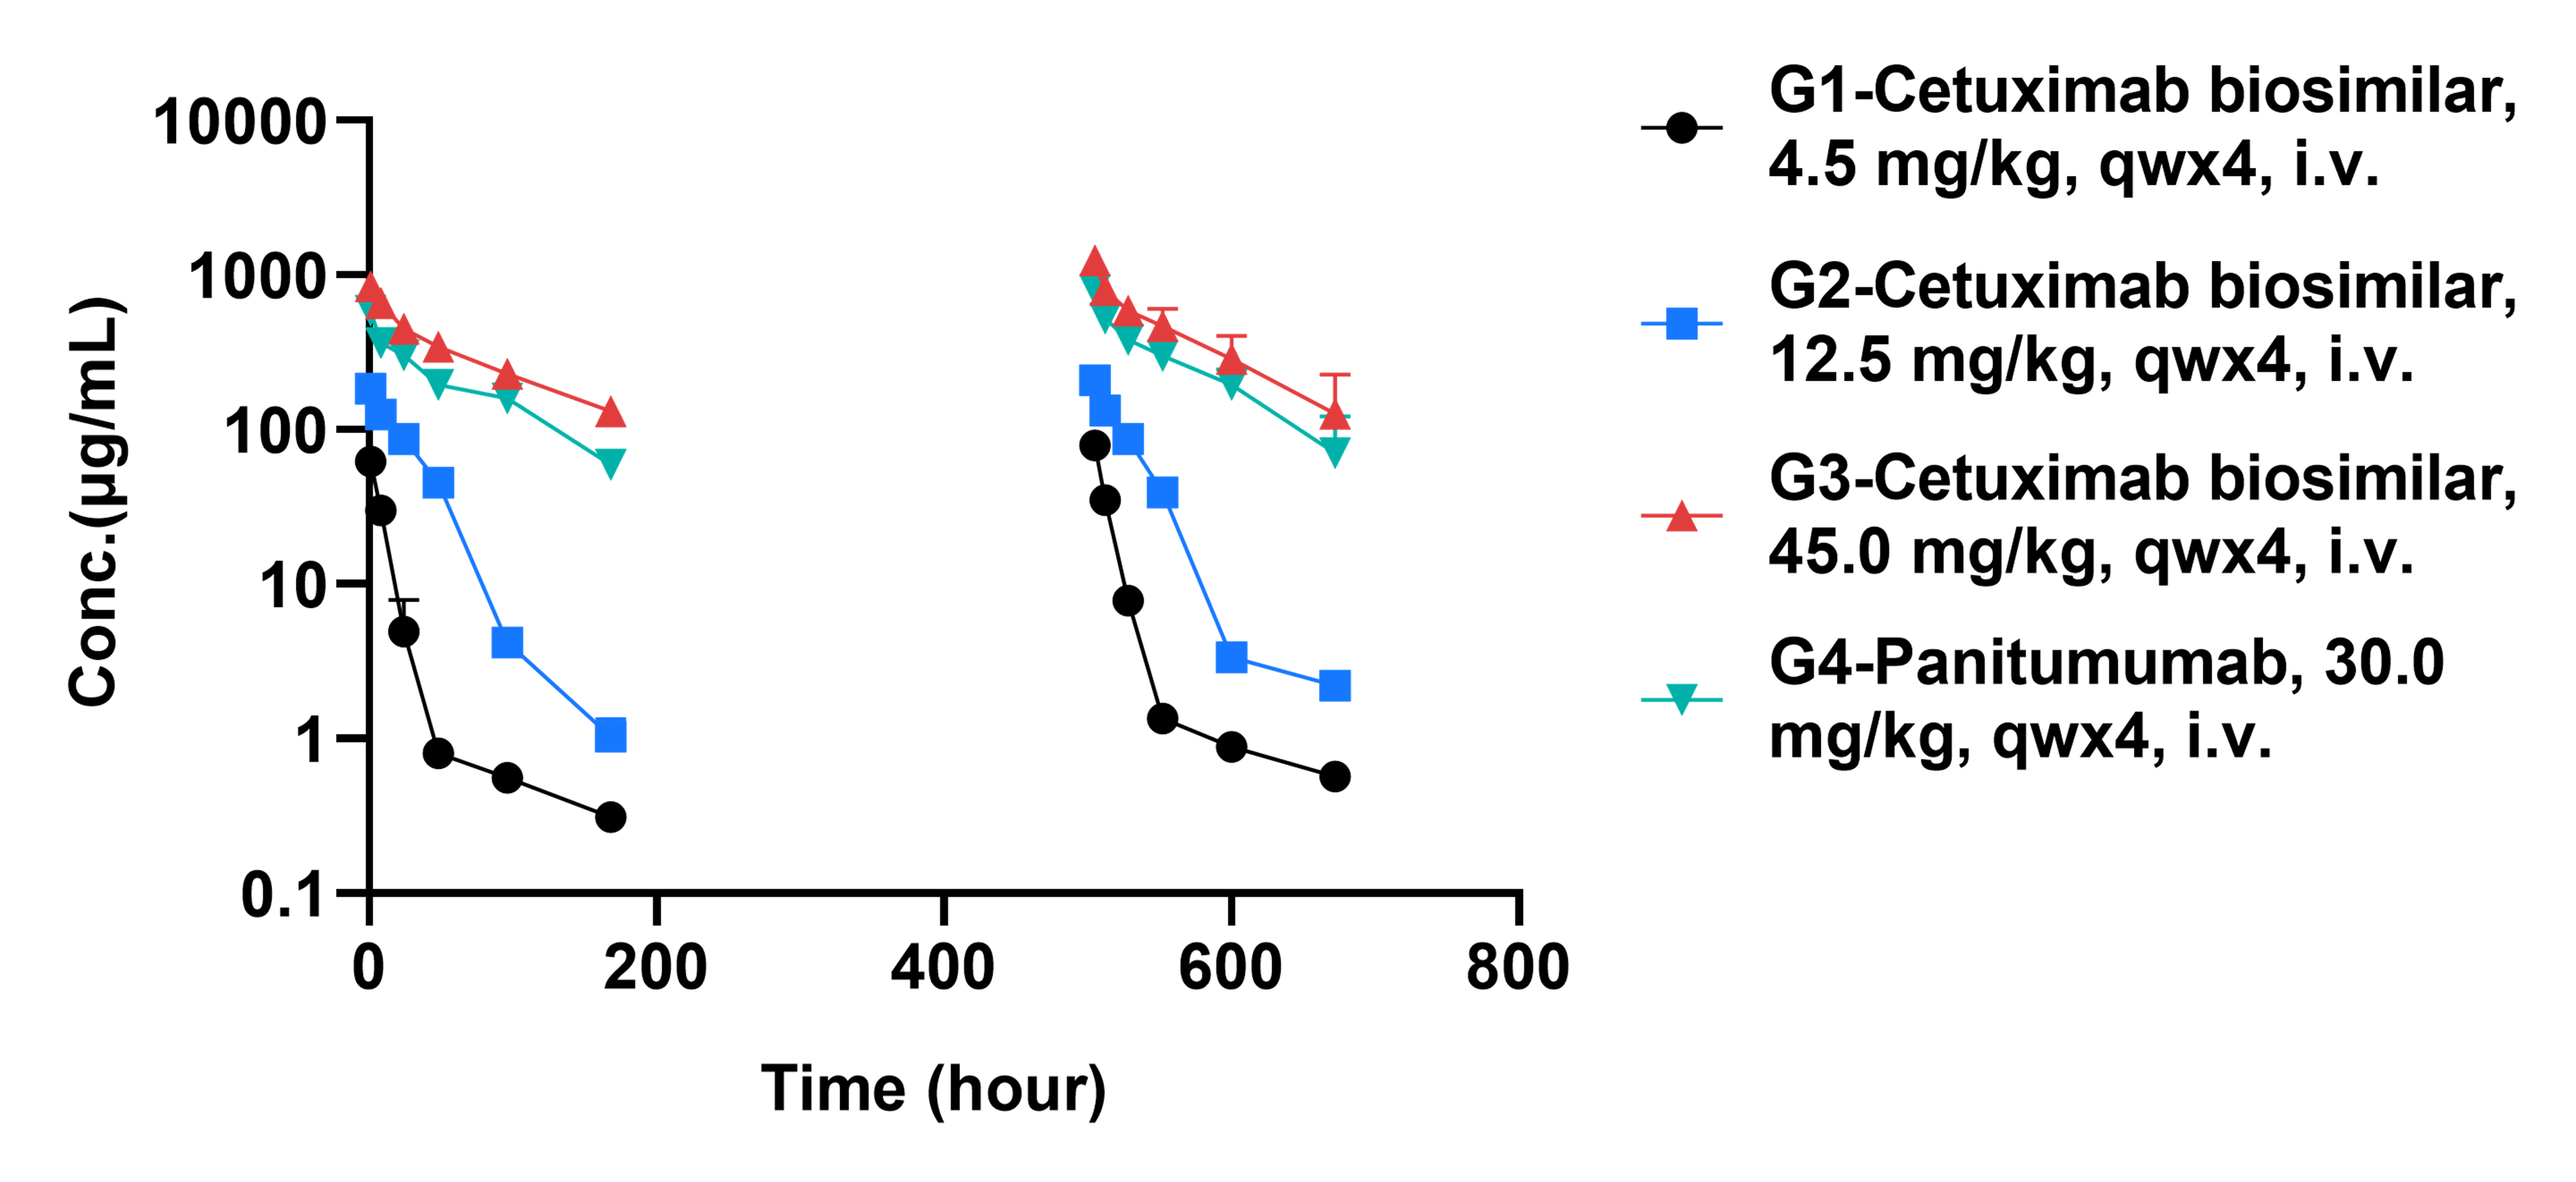
Toxicokinetic analysis showed a dose-associated increase in blood concentration of cetuximab biosimilar. The results indicate that the relationship between cetuximab biosimilar blood concentration and dose is linear within the experimental dosage range, which may reflect absence of saturation during absorption, distribution, metabolism, and excretion in mice. Note: This experiment is a collaboration with the client.
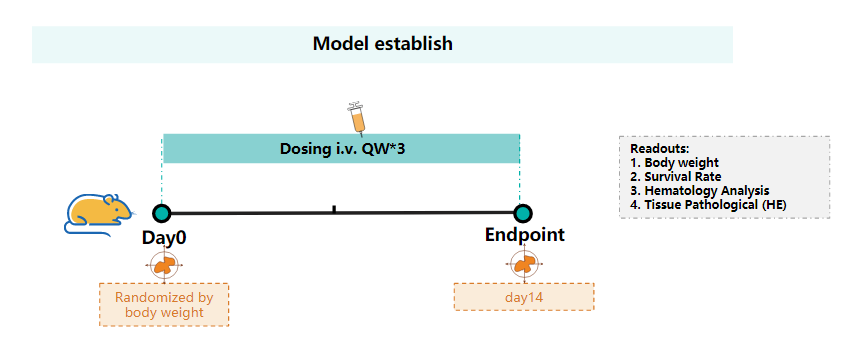
Establishment of a toxicity evaluation model for the EGFR-targeting ADC Cetuximab-MMAE in B-hEGFR mice. The Cetuximab-MMAE (in house) was intravenously injected into B-hEGFR mice (female, 5-7 weeks-old, n=12). Mice were weighed twice a week, and their condition was observed daily. At the end of the experiment, blood samples were collected for complete blood count test. Additionally, tissue samples were collected from skin, eyes, liver, ovary, uterus, heart, lungs, kidneys, thyroid gland, esophagus, and stomach, and then subjected to pathological analysis.
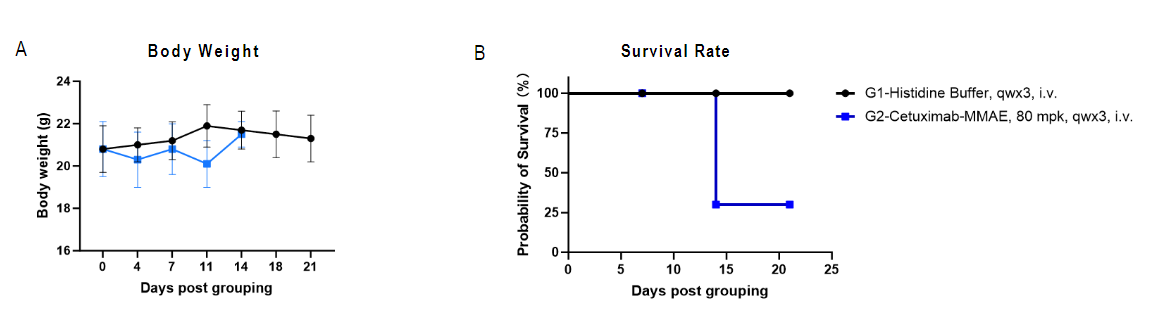
In vivo toxicity evaluation of Cetuximab-MMAE in B-hEGFR mice. (A) Body weight and (B) Survival rate (%) during treatment. Abnormal death were observed following three doses in the absence of preceding body weight changes, suggesting potential accumulated acute toxicity.
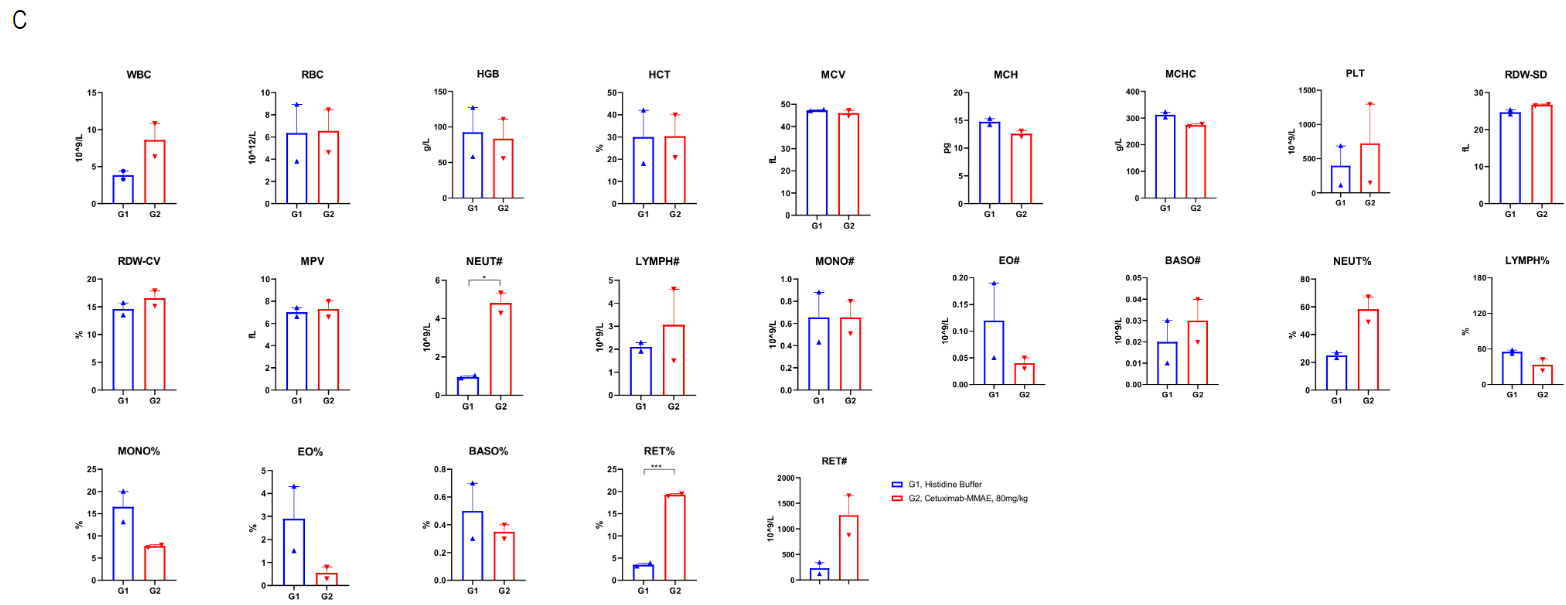
In vivo toxicity evaluation of Cetuximab-MMAE in B-hEGFR mice. (C) Complete blood count after the second cetuximab-MMAE treatment (80 mg/kg). Treatment with 80 mg/kg cetuximab-MMAE resulted in increased neutrophils (NEUT) and decreased eosinophils (EO), indicative of systemic inflammation. An elevated reticulocyte percentage (RET%) suggested compensatory hematopoiesis, while MMAE potentially contributed to bone marrow dysfunction.
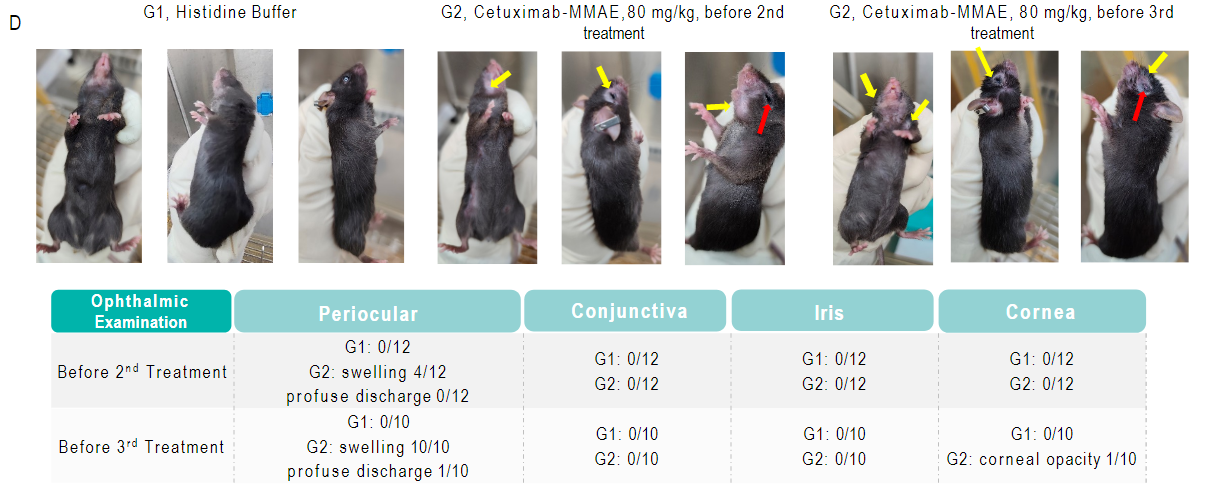
In vivo toxicity evaluation of Cetuximab-MMAE in B-hEGFR mice. (D) Representative images of skin and ocular toxicities following repeated cetuximab-MMAE treatment. Before the second dose, progressive hair loss was noted around the muzzle, eyes, and on parts of the abdomen and ears; severity further increased prior to the third dose. Periocular swelling, profuse ocular discharge, and corneal opacity were additionally observed. Yellow arrows indicate regions of skin toxicity characterized by hair loss, whereas red arrows indicate ophthalmic abnormalities. Ophthalmic findings prior to the second and third cetuximab-MMAE doses—periocular swelling, ocular discharge, and corneal opacity—are summarized in the table.
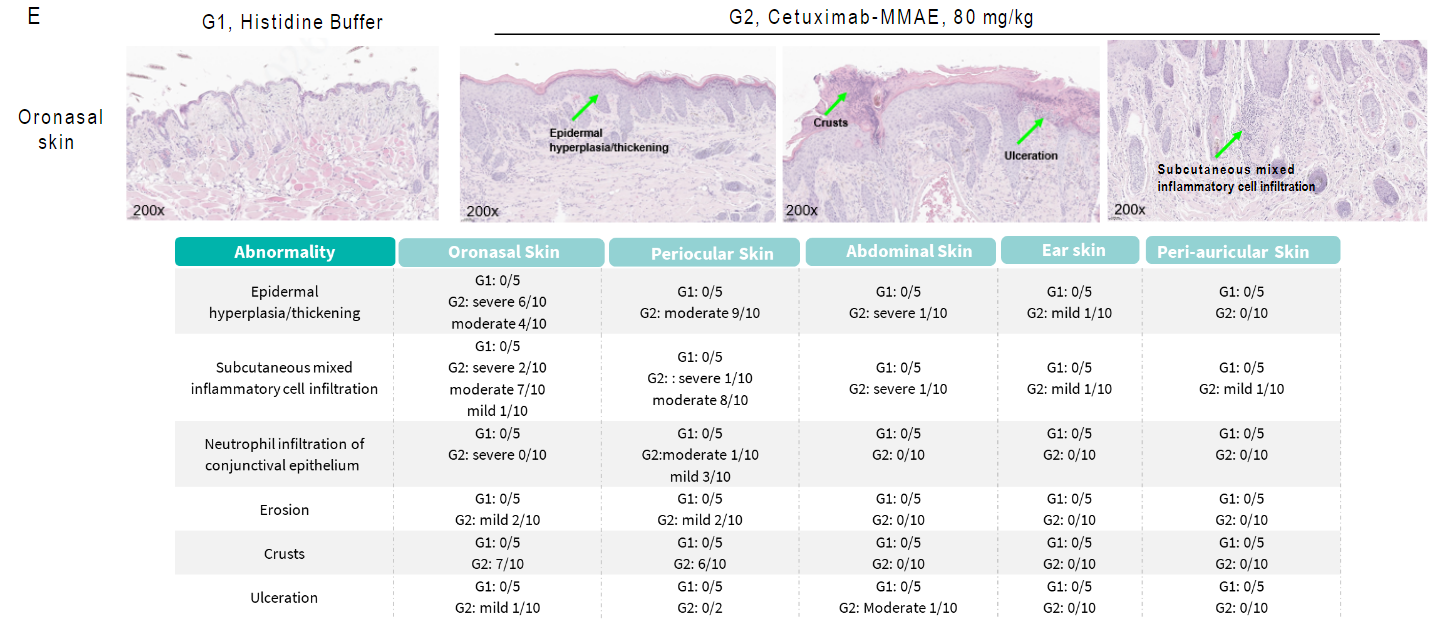
In vivo toxicity evaluation of Cetuximab-MMAE in B-hEGFR mice. (E) Pathological changes in oronasal skin. Compared to the vehicle control (G1), B-hEGFR mice treated with Cetuximab-MMAE at 80 mg/kg (G2) exhibited significant skin toxicity. Key histopathological findings included squamous epithelial proliferation (hyperplasia) and inflammatory cell infiltration in the subcutis. Additional observations such as ulceration and crust formation are detailed in the accompanying incidence table.
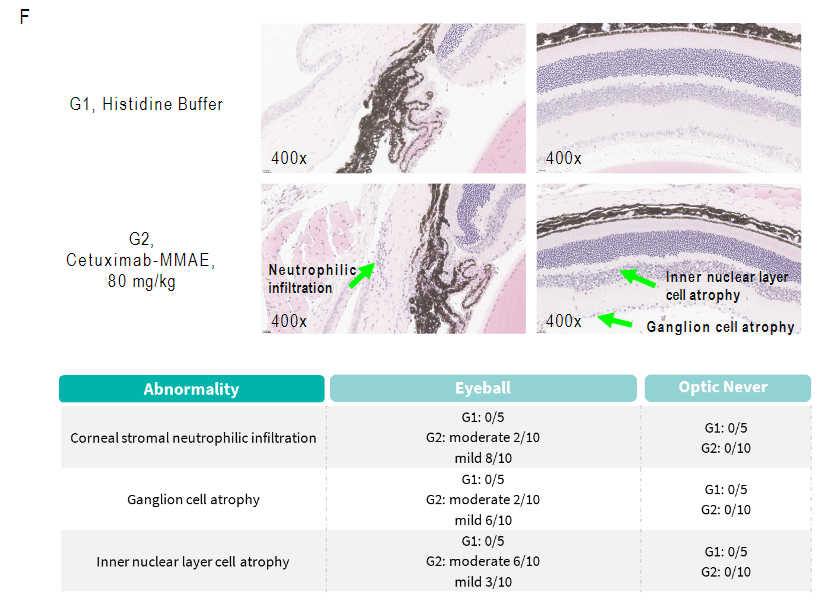
In vivo toxicity evaluation of Cetuximab-MMAE in B-hEGFR mice. (F) Pathological changes in the eye. Compared to the vehicle control (G1), mice treated with Cetuximab-MMAE at 80 mg/kg (G2) exhibited significant ocular toxicity. Histopathological examination revealed corneal stromal neutrophilic infiltration and retinal atrophy involving the ganglion and inner nuclear layers. Detailed incidence data for these abnormalities are provided in the accompanying table.
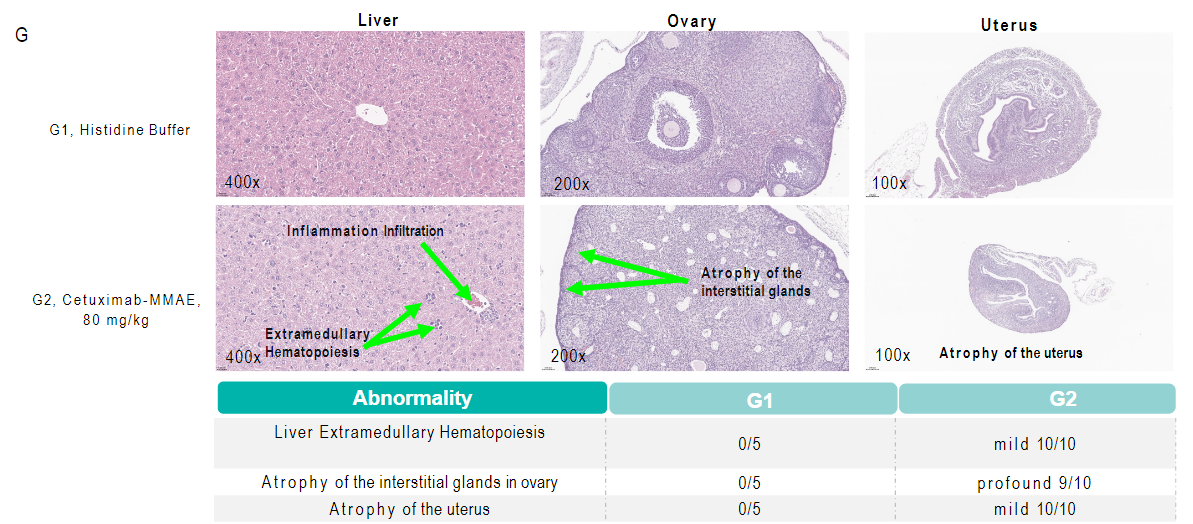
In vivo toxicity evaluation of Cetuximab-MMAE in B-hEGFR mice. (G) Pathological changes in reproductive organs and liver. Compared to the vehicle control (G1), mice treated with Cetuximab-MMAE at 80 mg/kg (G2) exhibited significant tissue alterations. Key findings included liver extramedullary hematopoiesis, profound atrophy of ovarian interstitial glands, and mild uterine atrophy. Statistical analysis of these pathological abnormalities is presented in the accompanying table.
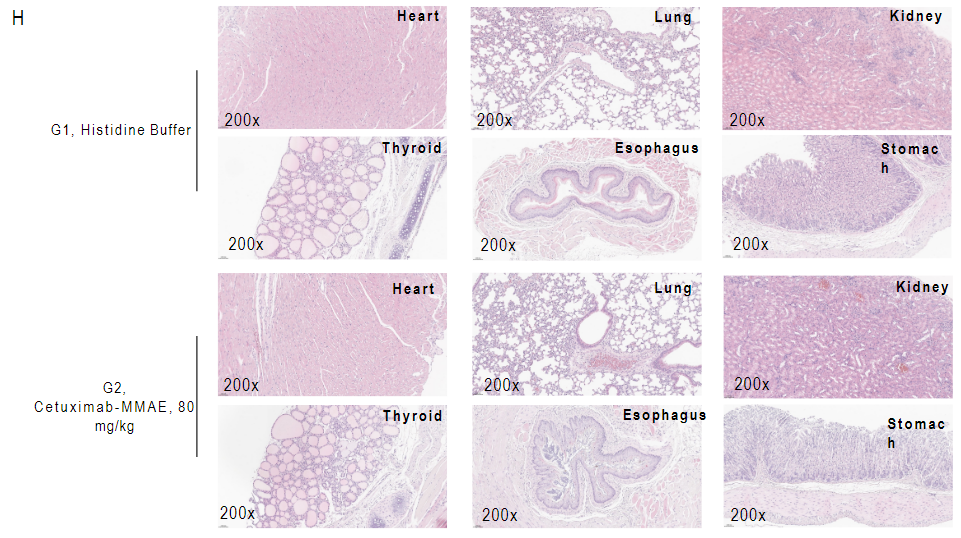
In vivo toxicity evaluation of Cetuximab-MMAE in B-hEGFR mice. (H) Representative H&E staining images of other organs and tissues, indicating no obvious damage and abnormalities.

Q1: What are B-hEGFR mice?
B-hEGFR mice are human EGFR gene-humanized mice on a C57BL/6 background, developed for EGFR-targeted oncology efficacy, toxicity, and toxicokinetic studies.
Q2: Why is EGFR important?
EGFR is a receptor tyrosine kinase in the ErbB family that regulates epithelial cell growth, survival, differentiation, and tissue repair, and is frequently dysregulated in cancer.
Q3: How was human EGFR expression validated in B-hEGFR mice?
Human EGFR mRNA was validated by RT-PCR and sequencing, EGFR protein distribution was analyzed by IHC, and human soluble EGFR was measured in plasma by ELISA.
Q4: Can B-hEGFR mice be used for EGFR-targeted ADC efficacy studies?
Yes. Cetuximab analog-MMAE inhibited B-Tg(hEGFR) MC38 tumor growth in homozygous B-hEGFR mice, supporting EGFR-targeting ADC evaluation.
Q5: What are the main applications of B-hEGFR mice?
Applications include EGFR-targeted antibody and ADC efficacy studies, syngeneic tumor models, EGFR antibody toxicity evaluation, toxicokinetic analysis, and oncology drug development.