on this page
Metabolic dysfunction–associated steatohepatitis (MASH), formerly known as nonalcoholic steatohepatitis (NASH), is a progressive metabolic liver disease within the nonalcoholic fatty liver disease (NAFLD) spectrum. It is characterized by hepatic steatosis, inflammation, hepatocyte injury, and fibrosis, which can progress to cirrhosis or hepatocellular carcinoma. The co-existence of obesity, insulin resistance, and type II diabetes significantly increases the risk of disease onset and progression.
Clinically, MASH involves steatohepatitis, hepatocyte ballooning, liver fibrosis, and metabolic dysfunction. To better understand disease mechanisms and evaluate new treatments, MASH/NASH mouse models are widely used in preclinical liver disease research. These include genetically modified, diet-induced, or a combination of the two.
Biocytogen has established several validated models representing different stages of MASH pathogenesis, including:
These MASH/NASH models provide reliable in vivo platforms for mechanistic studies, drug efficacy testing, and preclinical research, advancing the discovery of anti-steatotic, anti-inflammatory, and anti-fibrotic therapies.
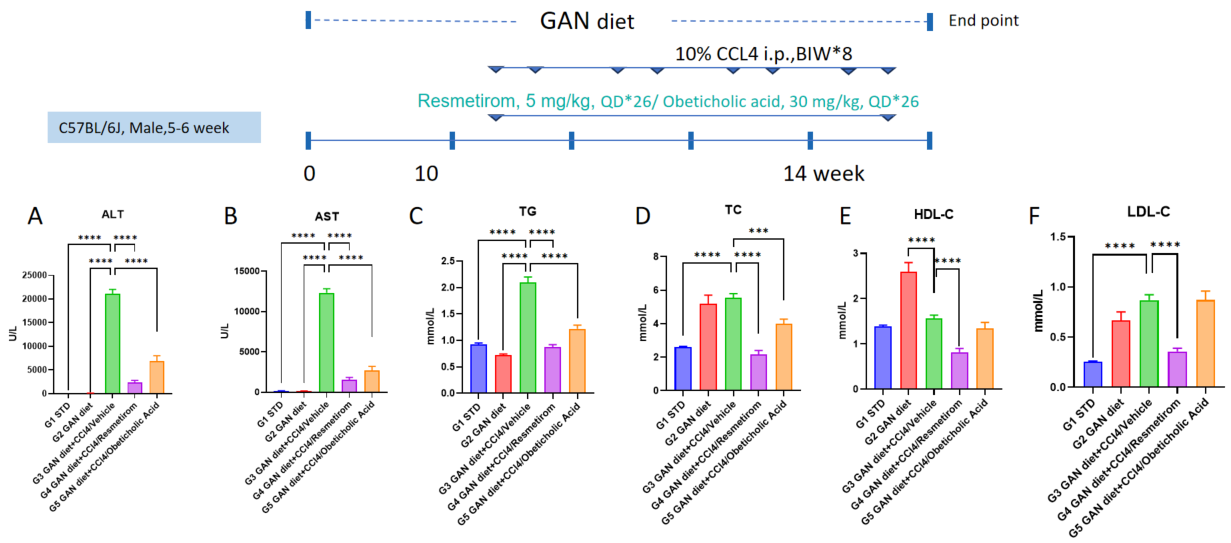
MGL3196 and OCA alleviated NASH symptom in GAN diet+CCL4 induced NASH mouse model. A-B, ALT and AST levels of modeling and treatment group. C-F, TG, TC, HDL-C, LDL-C levels of modeling and treatment group. Data are expressed as mean ± SEM. N = 9 mice per group. *p<0.05, **p<0.01,***p<0.001.
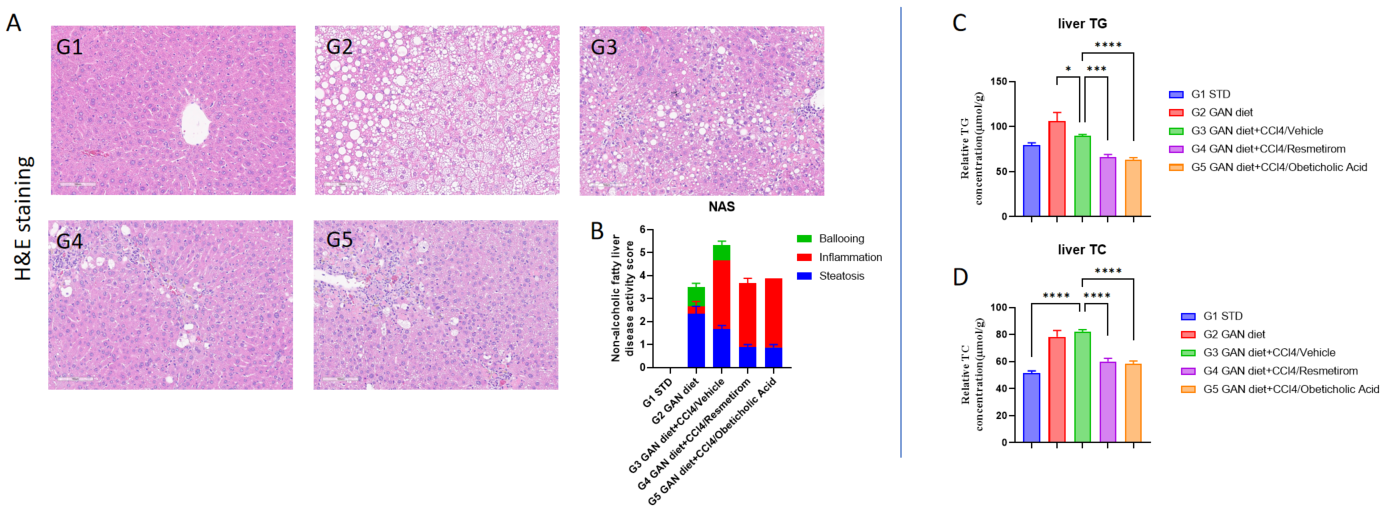
Resmetirom and OCA decreased NAS scores. A, Representative pictures of H&E staining showing degree of NASH. B, NAFLD activity score (NAS) assessed by an external expert pathologist. C-D, TG and TC content in liver after treatment. Data are expressed as mean ± SEM. N = 9-10 mice per group. *p<0.05, **p<0.01, ***p<0.001.
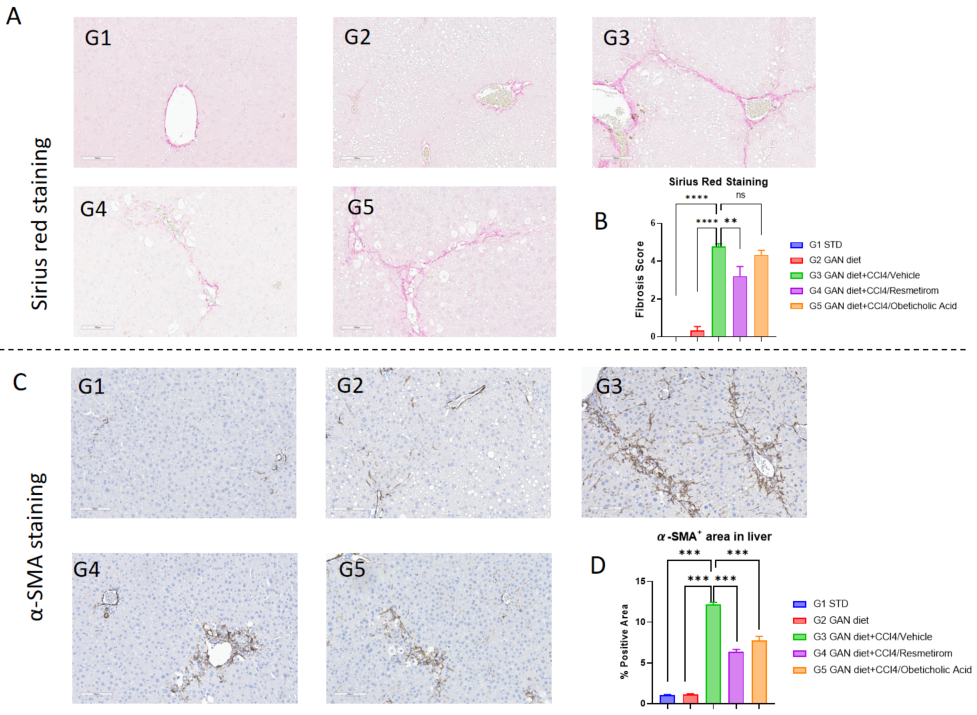
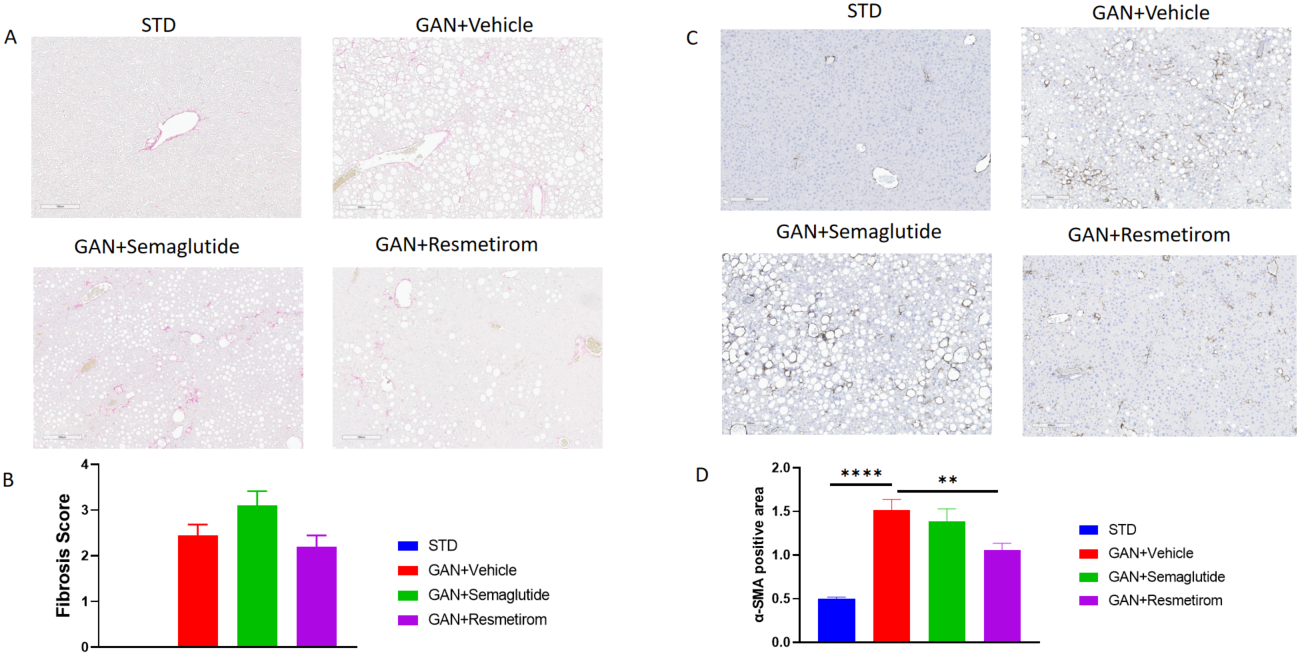
Resmetirom and OCA treatment alleviates liver fibrosis. A, Representative pictures of Sirius Red staining showing degree of liver fibrosis (scare bar: 200μm). B, Liver fibrosis score was assessed according to Sirius Red staining. C, Representative pictures of IHC staining showing α-SMA expression (scare bar: 200μm).D, Quantitively data of α-SMA expression. Data are expressed as mean ± SEM. N = 9 mice per group. *p<0.05, **p<0.01,***p<0.001,****p<0.0001.
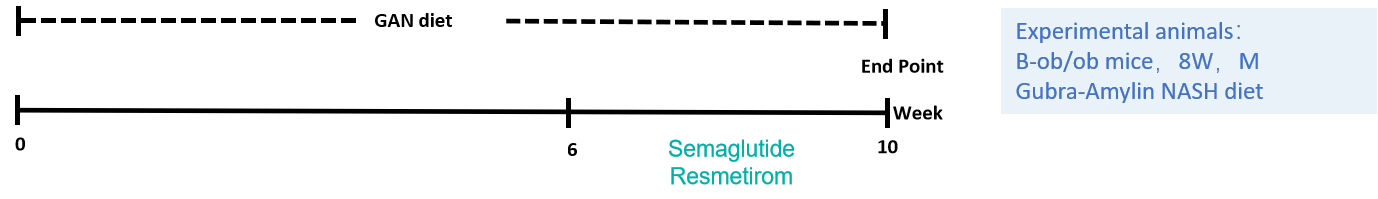
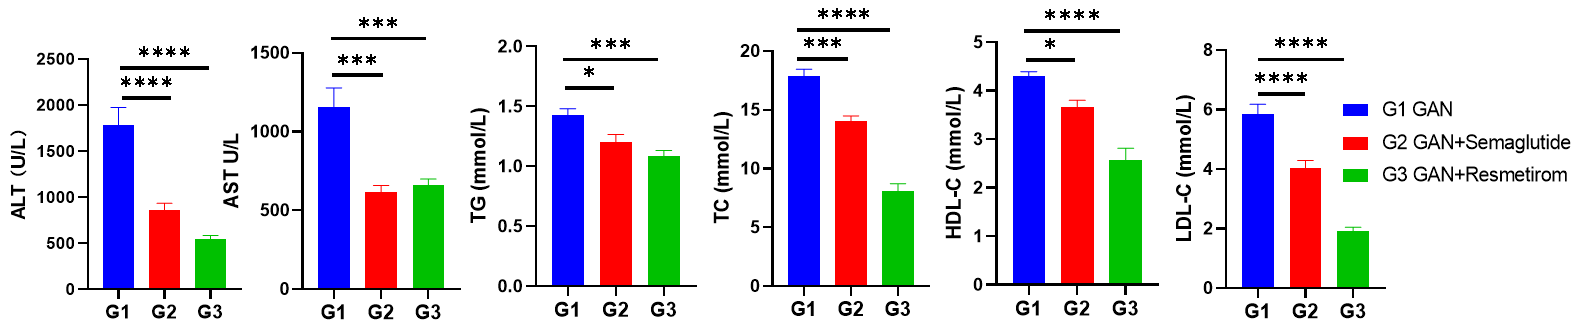
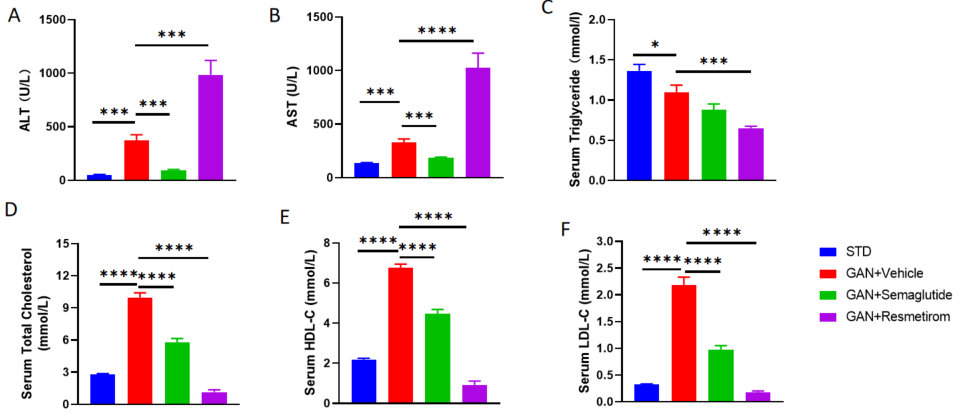
MGL3196 and semaglutide alleviated NASH symptom in Gubra-Amylin diet-induced NASH model in B-ob/ob mice. A-B, ALT and AST levels of modeling and treatment group. C-F, TG, TC, HDL-C, LDL-C levels of modeling and treatment group. Data are expressed as mean ± SEM. N = 9 mice per group. *p<0.05, **p<0.01,***p<0.001.
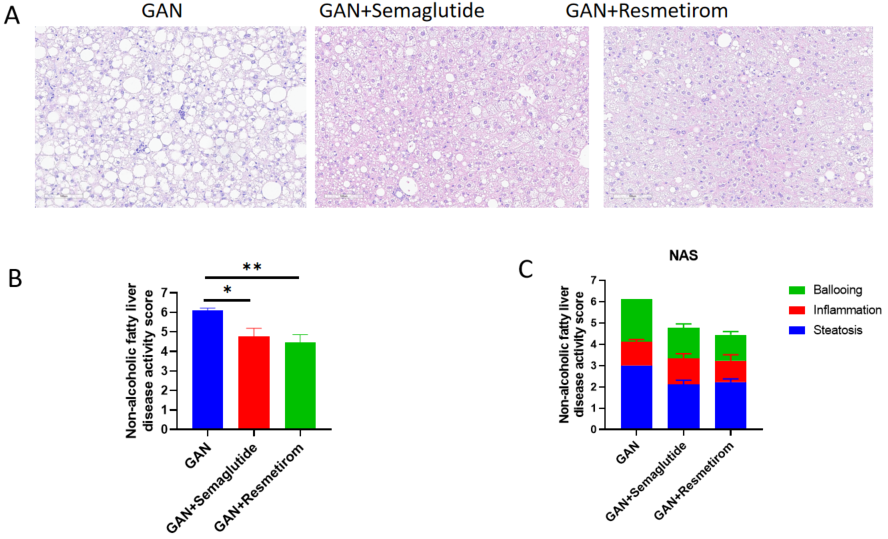
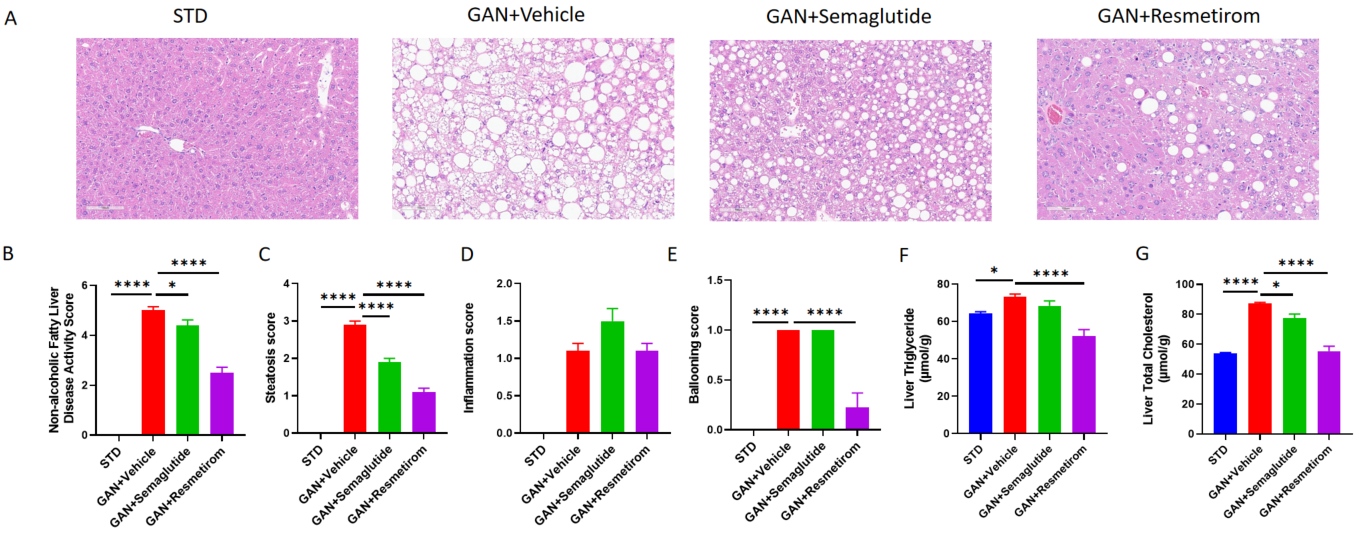
Semaglutide and Resmetirom decreased NAS scores in GAN diet induced B-ob/ob mice. A, Representative pictures of H&E staining showing degree of NASH. B-C, NAFLD activity score (NAS) assessed by an external expert pathologist. Data are expressed as mean ± SEM. N = 9 mice per group. *p<0.05, **p<0.01.
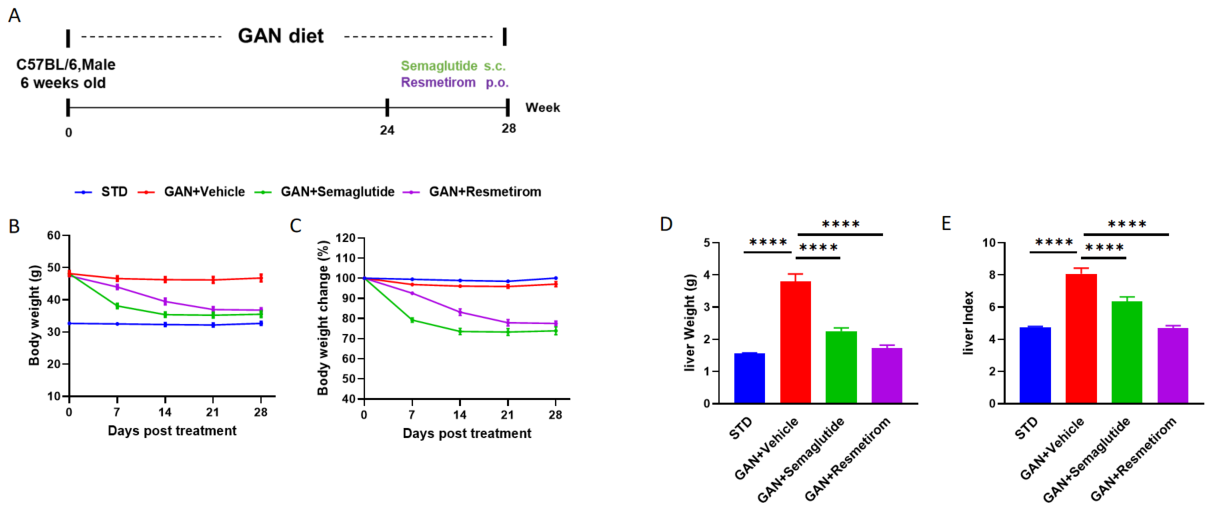
GAN diet-induced NASH model in C57BL/6 mice. A, Experimental design showing modeling and treatment of GAN DIO-NASH mice. B-C, Body weight and percent body weight change of different groups after treatment. D-E, Liver weight and liver Index from different groups were measured at study termination. N = 9-10 mice per group. *p<0.05, **p<0.01,***p<0.001,****p<0. 0001.
GAN diet-induced NASH model in C57BL/6 mice. A-B, ALT and AST level of different groups were analyzed at study termination. C-F, Serum TG, TC, HDL-C, LDL-C levels of different groups were measured at study termination. Data are expressed as mean ± SEM. N = 9-10 mice per group. *p<0.05, **p<0.01,***p<0.001,****p<0.0001.
Effect of Semaglutide and Resmetirom on Liver histomorphology in GAN DIO-NASH model. A, Representative pictures of H&E staining showing degree of NASH. B-E, Histological assessment of the NAFLD activity score (NAS) ,steatosis score, ballooning score and inflammation score. F-G, TG and TC content at study termination. Data are expressed as mean ± SEM. N = 9-10 mice per group. *p<0.05, **p<0.01, ***p<0.001.
A, Representative pictures of Sirius Red staining showing degree of liver fibrosis (scare bar: 200μm). B, Liver fibrosis score was assessed according to Sirius Red staining. C, Representative pictures of IHC staining showing α-SMA expression (scare bar: 200μm). D, Quantitively data of α-SMA expression. Data are expressed as mean ± SEM. N = 9-10 mice per group. *p<0.05, **p<0.01,***p<0.001,****p<0.0001.
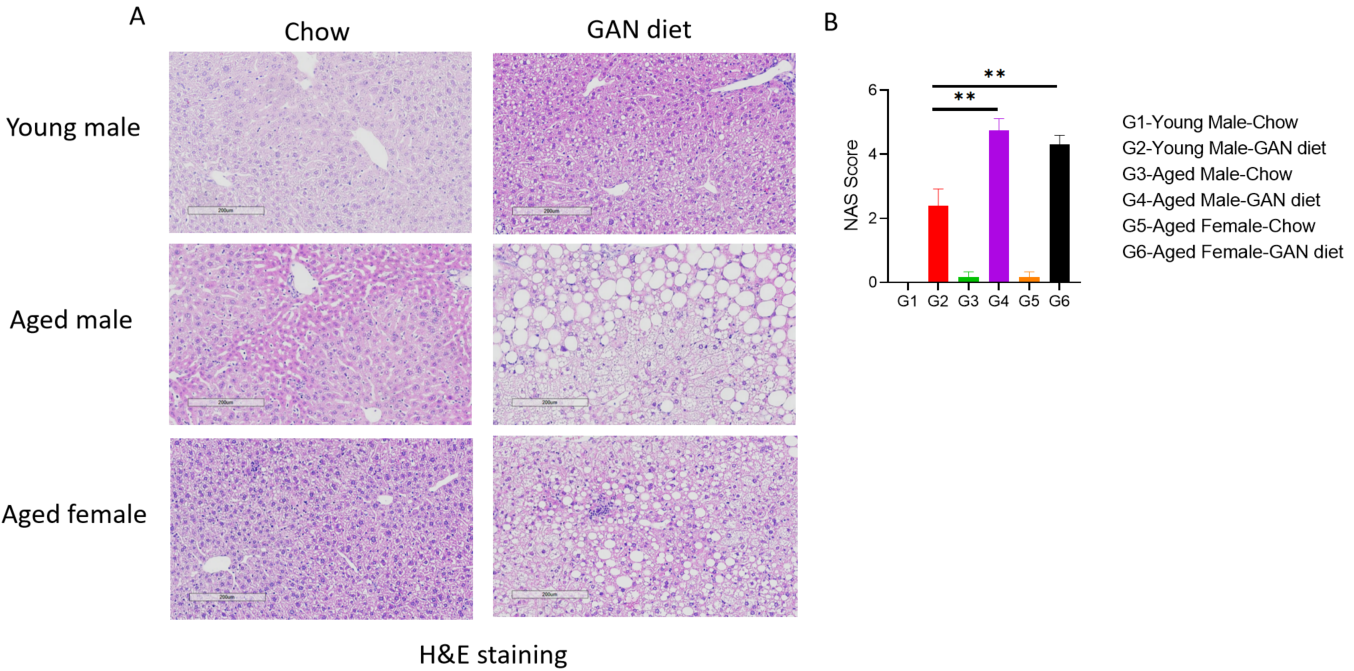
Gubra-Amylin diet-induced Nonalcoholic Steatohepatitis in aged mice. A, Representative pictures of H&E staining after 12 weeks of induction. B, NAFLD activity score (NAS) assessed by an external expert pathologist. N = 6-10 mice per group. Data are expressed as mean ± SEM. **: p<0.01.
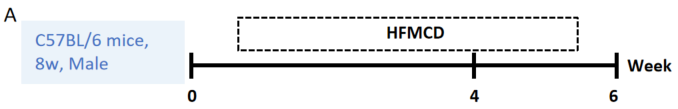
C57BL/6 male mice of 8 weeks were either fed a standard diet (STD) or a High-Fat Methionine-Choline-Deficient for 4 or 6 weeks.
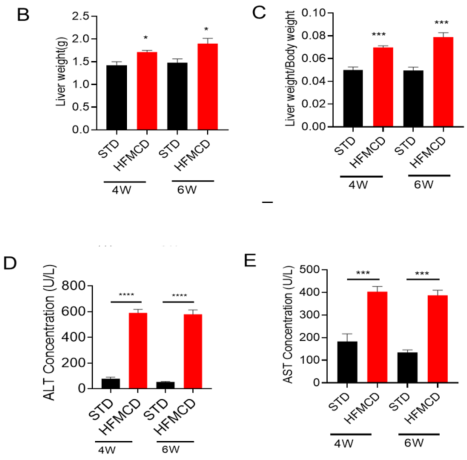
Phenotypic analysis of HFMCD induced NASH model. A, Modeling diagram. B-C, liver weight and ratio of liver weight and body weight after 4 weeks and 6 weeks induction; n = 5 mice/group. D-E, ALT and AST levels after HFMCD induction. Values are expressed as mean ± SEM. *p<0.05, ***p<0.001, ****p<0.0001.
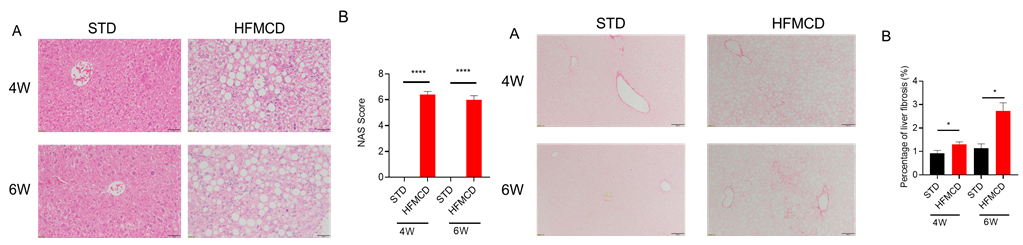
Analysis of H&E and Sirius red staining in the HFMCD-induced NASH mouse model. A, Representative pictures of H&E staining showing increased hepatic steatosis and inflammation of HFMCD group . B, The NAFLD activity score (NAS) was assessed by an external expert pathologist, revealing significantly increased NAS after HFMCD induction. Scale bar: 50 um. Values are expressed as mean ± SEM. N = 6 mice per group. *p<0.05, ****p<0.0001.
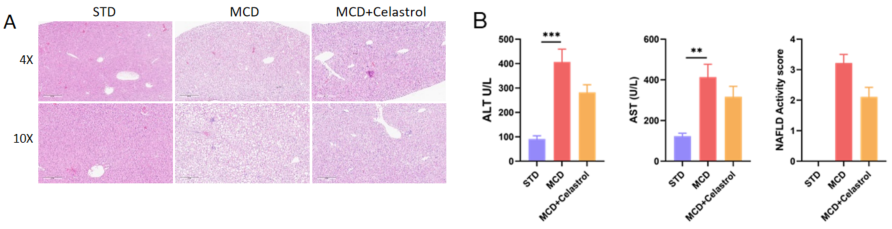
Analysis of H&E staining, index of liver function and NAFLD activity score the HFMCD-induced NASH mouse model. A, Representative pictures of H&E staining showing reduced hepatic steatosis and inflammation after celastrol treatment. B, ALT/AST change after MCD induction. Statistic data of NAFLD activity score (NAS). Values are expressed as mean ± SEM.N = 6 mice per group. **p<0.01, ***p<0.001.
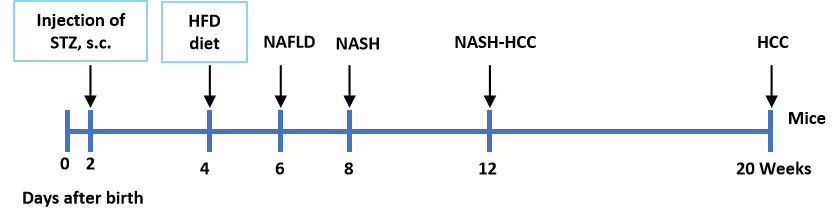
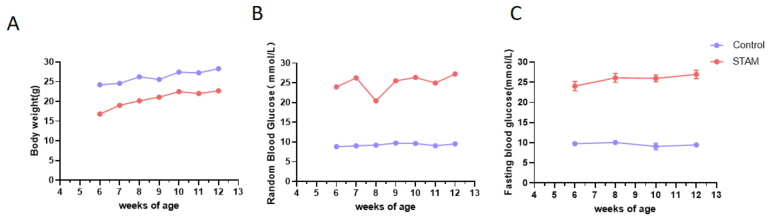
Analysis of characteristics in STAM model of NASH. Neonatal male mice were injected with STZ on day 2 and fed a HFD diet from 4 weeks old. A-C, Body weight and blood glucose change after induction. N = 8 mice per group.
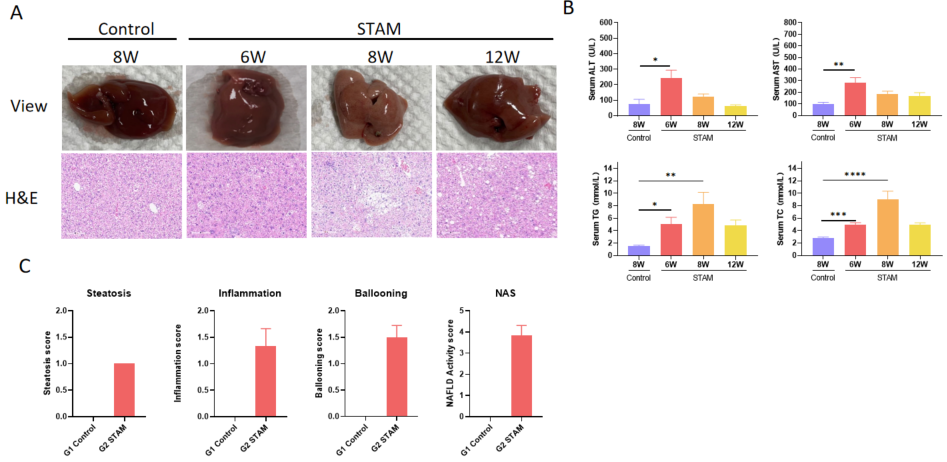
Analysis of characteristics in STAM model of NASH. A, Representative pictures of H&E staining after 6, 8 and 12 weeks induction. B, Blood biochemistry results showing the characteristics of STAM model. C, NAFLD activity score. Values are expressed as mean ± SEM. N = 8 mice per group. *p<0.05, **p<0.01, ***p<0.001, ****p<0.0001.
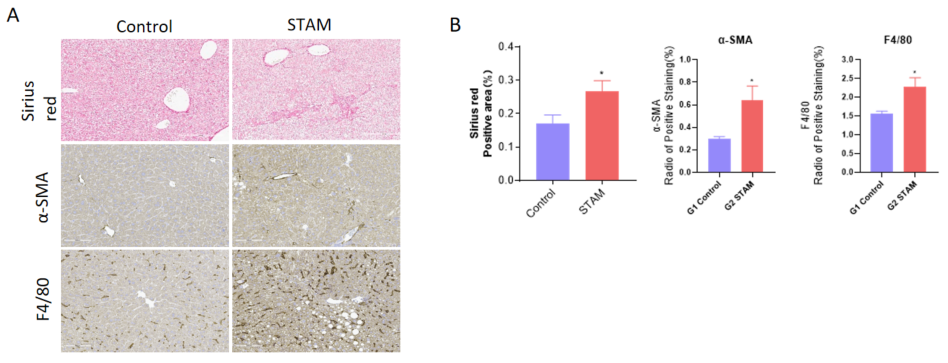
Analysis of fibrosis and inflammation in STAM model of NASH. A, Representative pictures of Sirius red and IHC staining after 9 weeks induction. B, Quantitative data of Sirius red and IHC staining. Values are expressed as mean ± SEM. N = 8 mice per group. *p<0.05.
| GAN diet+CCL4 | GAN diet | HFMCD | STAM | |||
| Animal | C57BL/6 | C57BL/6 | C57BL/6 (Aged) | B-ob/ob | C57BL/6 | C57BL/6 (Neonatal) |
| Obesity | + | + | + | + | - | - |
| Dyslipidemia | + | + | + | + | Decreased TG and TC | + |
| Hepatomegaly | + | + | + | + | + | + |
| Liver enzymes | + | + | + | + | + | + |
| Steatosis | + | + | + | + | + | + |
| Inflammation | + | Mild | + | + | + | + |
| Fibrosis | + | Mild | Mild | Mild | + | + |
| Induction period (weeks) | 14 | 20-35 | 12-20 | 12-16 | 4-8 | 6-9 |
References