Results
Orthotopic Liver Cancer Model: B-luc Hep 3B in B-NDG Mice
Establishment of orthotopic liver cancer model
| Study ID: |
Groups |
Animal strain |
Sex |
Cell line |
The amount of
cells Inoculated |
The Volume
of cells |
Animal number |
Remarks |
| TT02110 |
- |
B-NDG mice |
F |
B-luc Hep 3B #1-A06 |
5×10⁵ |
0.02ml/mice |
10 |
- |
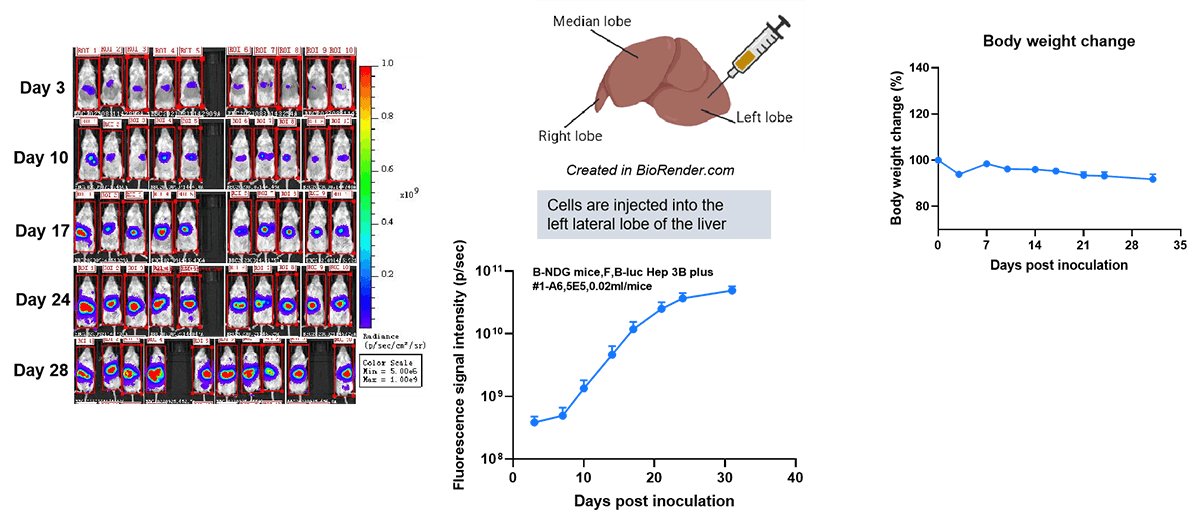
Establishment of orthotopic liver cancer model.
To establish the liver cancer model, 20μL B-luc Hep 3B plus cell suspension (5×10⁵) was injected into the left lateral lobe of the liver of B-NDG mice (F, n=10), and the body weight and tumor fluorescence signal of the mice were recorded weekly. The results showed that the fluorescence signal gradually increased and the body weight decreased slight over time. This indicated that the cell line was successfully constructed as an orthotopic tumor model.
Orthotopic liver cancer models imaging by Micro-CT
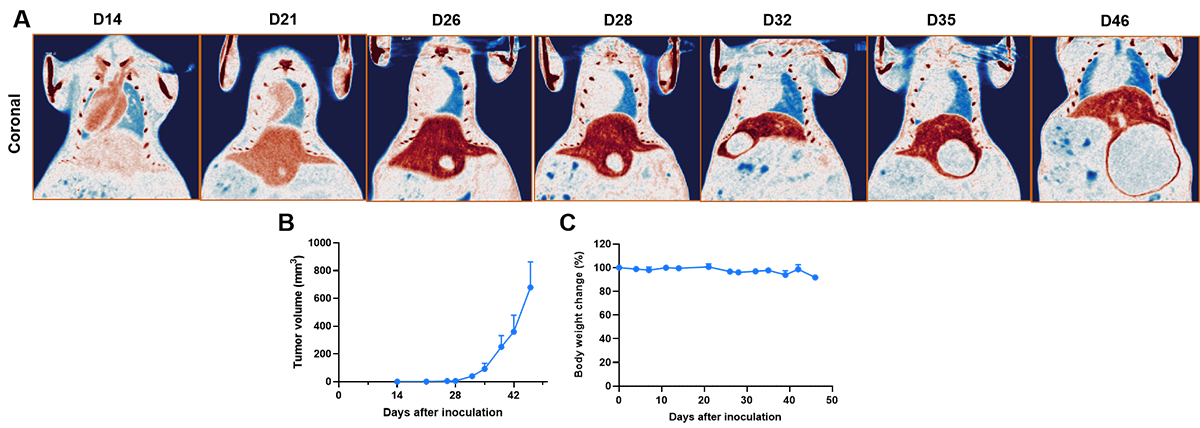
Orthotopic liver cancer models imaging by Micro-CT.
The image illustrates that, following the administration of contrast agent, the liver exhibits an increase in density shadow, appearing as deep (brown) color. The contrast agent hardly be absorbed by the tumor, appears as a low-density shadow. A: Micro-CT images of B-Luc-Hep 3B plus orthotopic model in B-NDG mice were scanned from day 14 after inoculation. The image shows the coronal plane of the mouse abdomen and the volume of the low-density shadow (tumor) of the liver was increased over time. B: Tumor growth curves were recorded by contrast-enhanced CT. C: Body weight change of B-Luc-Hep 3B plus orthotopic model in B-NDG mice.
Evaluation of the efficacy of orthotopic liver cancer model
| Study ID: |
Groups |
Animal number |
Treatment |
Dosage(mg/kg) |
Lot No. |
Dosing Volume |
Dosing Route |
Treatment Schedule |
Treatment Times |
| 21P079544 |
G1 |
6 |
0.9% saline solution |
- |
2106261604 |
10μL/g |
i.p. |
QW |
4 |
| G2 |
6 |
fluorouracil |
60mg/kg |
2110151 |
10μL/g |
i.p. |
QW |
4 |
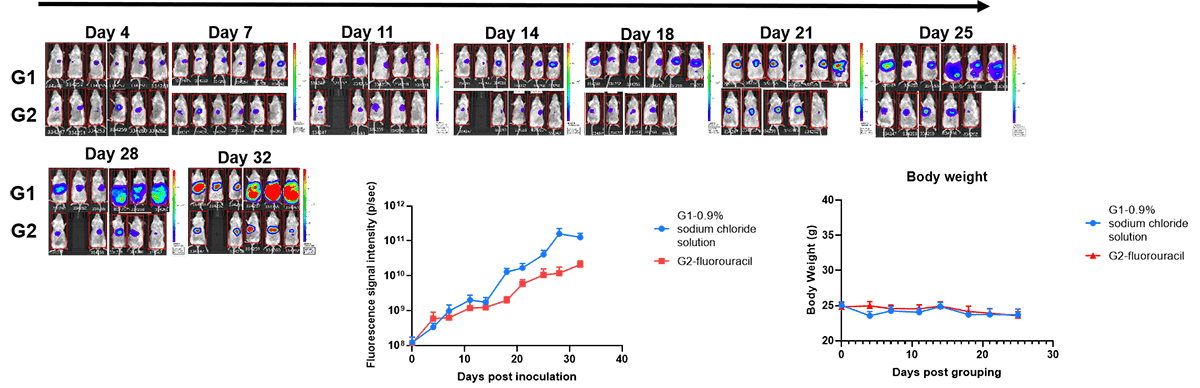
Evaluation of the efficacy of orthotopic liver cancer model. The B-NDG hIL-15 mice (F, n=10) were inoculated with a volume of 20 μL of cell suspension (5×10⁵), mice were randomly divided into 0.9% saline solution and fluorouracil groups on day 5 after tumor inoculation based on imaging values. The body weight and tumor fluorescence signal of the mice were recorded weekly. Fluorouracil (60 mg/kg) significantly inhibited the growth of B-luc Hep 3B plus orthotopic liver cancer, demonstrating that this model can be well used for preclinical evaluation. Mice were dissected at the end of the experiment, and H&E staining showed that tumors metastasized in the pancreas, stomach and spleen.
Evaluation of the efficacy of orthotopic liver immune reconstitution model
| Study ID: |
Groups |
Animal number |
Treatment |
Dosage(mg/kg) |
Lot No. |
Dosing Volume |
Dosing Route |
Treatment Schedule |
Treatment Times |
| 22P122201 |
G1 |
6 |
PBS |
- |
2428708 |
5μL/g |
i.v. |
QW |
4 |
| G2 |
6 |
Positive control |
0.5mg/kg |
2022105025 |
5μL/g |
i.p. |
Q2D |
10 |
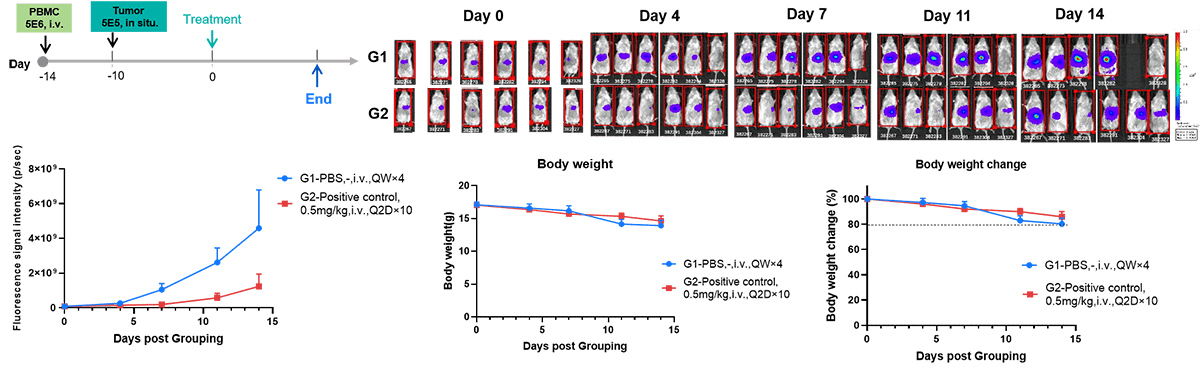
Evaluation of the efficacy of orthotopic liver immune reconstitution model. The liver of B-NDG mice was inoculated with a volume of 20 μL of B-luc Hep 3B plus cell suspension (5×10⁵/0.02mL/mice) at day 4 after PBMC inoculation (5×10⁶/0.2mL/mice, i.v.). The mice were randomly divided into two groups according to average imaging signal and hCD45% on day 0, and the body weight and tumor fluorescence signal of the mice were recorded weekly. The results showed that the positive control drug inhibited the growth of orthotopic liver cancer after immune reconstitution, and the body weight decreased slight over time, demonstrating that this model can be well used for preclinical evaluation.
Orthotopic Liver Cancer Model: B-Tg(Luc-EGFP) Hep G2 in B-NDG Mice
Establishment of orthotopic liver cancer model.
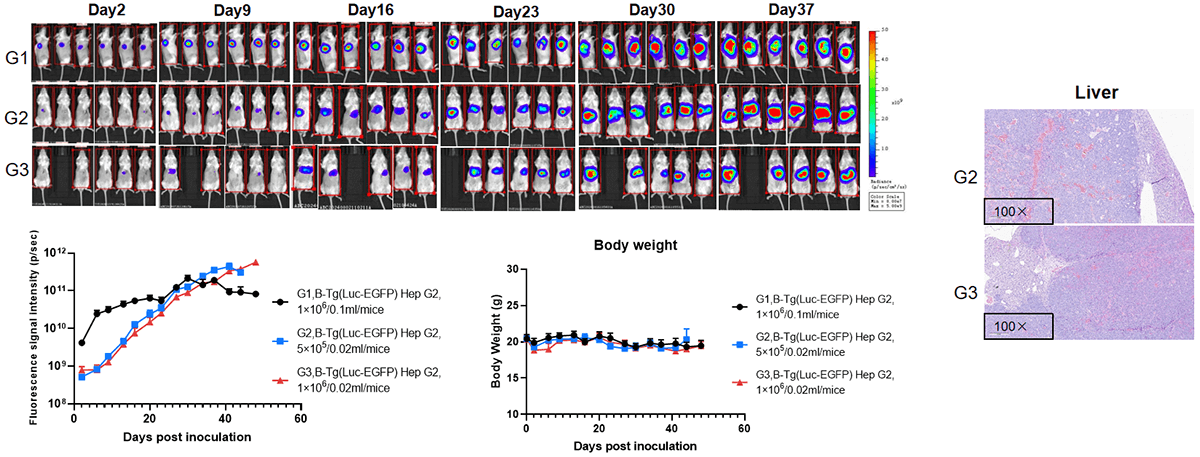
To establish the liver cancer model, B-Tg(Luc-EGFP) Hep G2 cell suspension was injected into the left lateral lobe of the liver of B-NDG mice (F, n=6), and the body weight and tumor fluorescence signal of the mice were recorded weekly. The results showed that the fluorescence signal gradually increased. Right panel showed H&E staining of liver tumors. This indicated that the cell line was successfully constructed as an orthotopic tumor model.
Liver metastasis model- Hemispleen injection
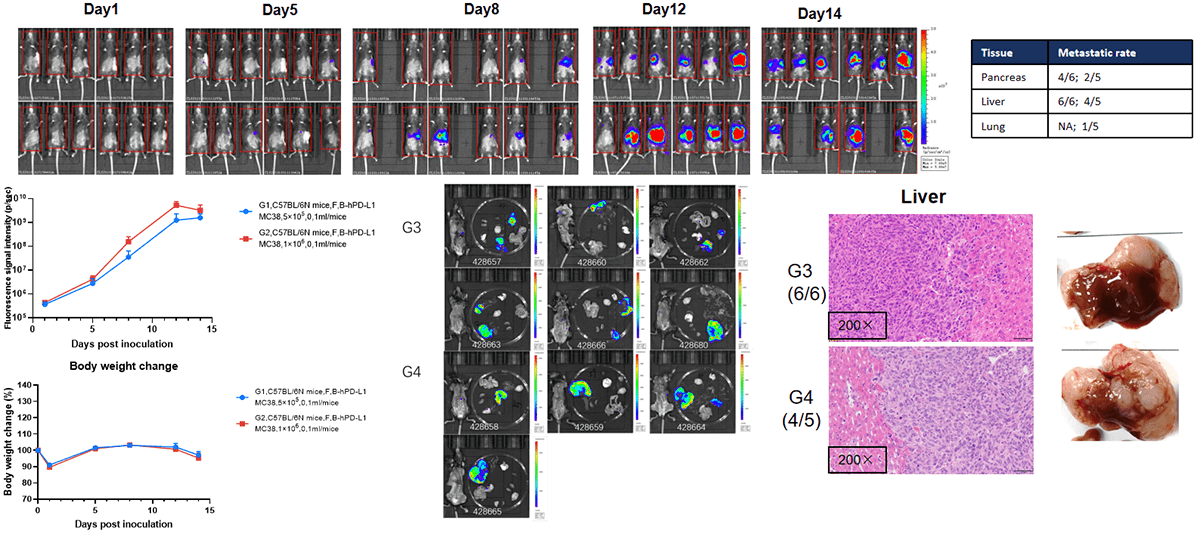
Establishment of liver metastasis model. To establish the liver metastasis model, 100μL B-hPD-L1 MC38 cell suspension (5×10⁵, 1×10⁶) was injected into the spleen of B-NDG mice (F, n=6), the body weight and tumor fluorescence signal of the mice were recorded weekly. The results showed that the fluorescence signal gradually increased. This indicated that the cell line was successfully constructed as a liver metastasis model.
| Study ID: |
Groups |
Animal number |
Treatment |
Dosage (mg/kg) |
Lot No. |
Dosing Volume |
Dosing Route |
Treatment Schedule |
Treatment Times |
| 24P071531 |
G1 |
6 |
PBS |
- |
2933643 |
10μL/g |
i.v. |
QW |
2 |
| G2 |
6 |
DS-8201 |
3mpk |
394042 |
10μL/g |
i.v. |
QW |
2 |
| G3 |
6 |
DS-8201 |
6mpk |
394042 |
10μL/g |
i.v. |
QW |
2 |
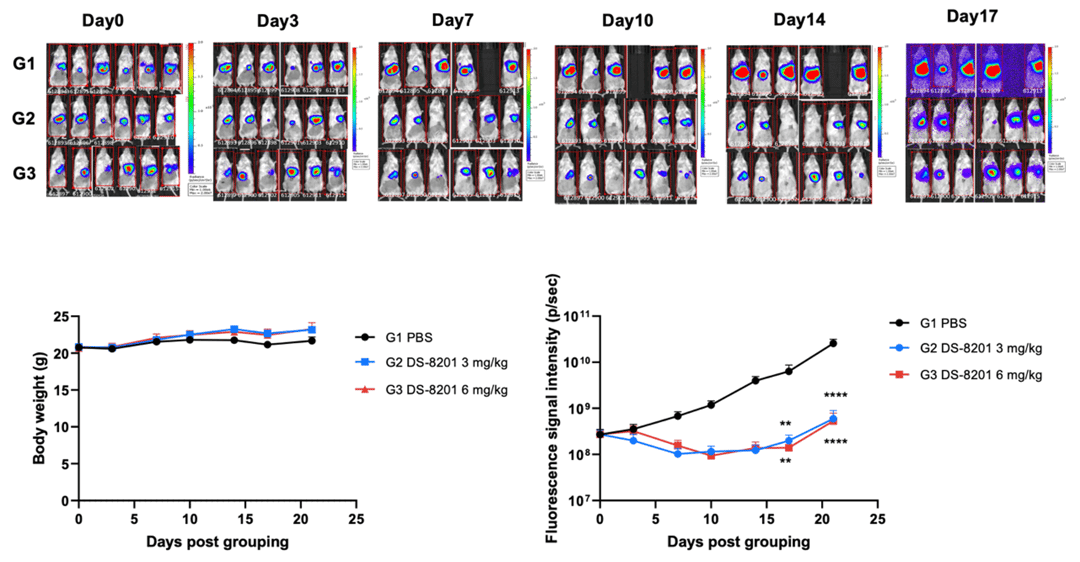
DS-8201 significantly inhibited B-Tg (Luc-EGFP) Hep G2 tumor growth in B-NDG mice. Hep G2 cells (5×10⁵) mixed 1:1 with Matrigel were orthotopically implanted into female B-NDG mice (8-week-old, n=6). Treatment began when imaging signals reached ~2.7×10⁸ p/sec, with dosing shown in the upper panel. Mean ± SEM.