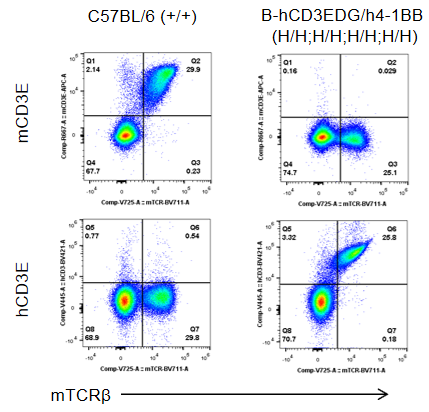
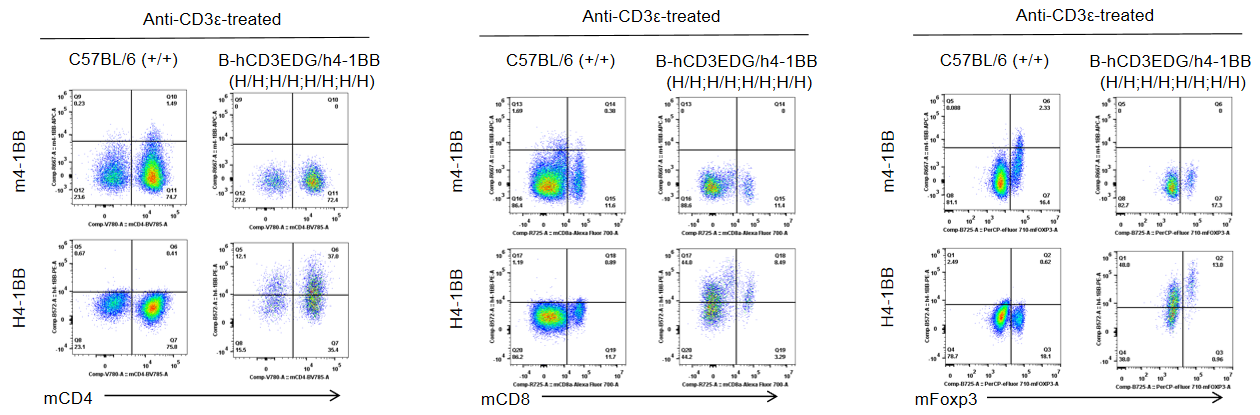
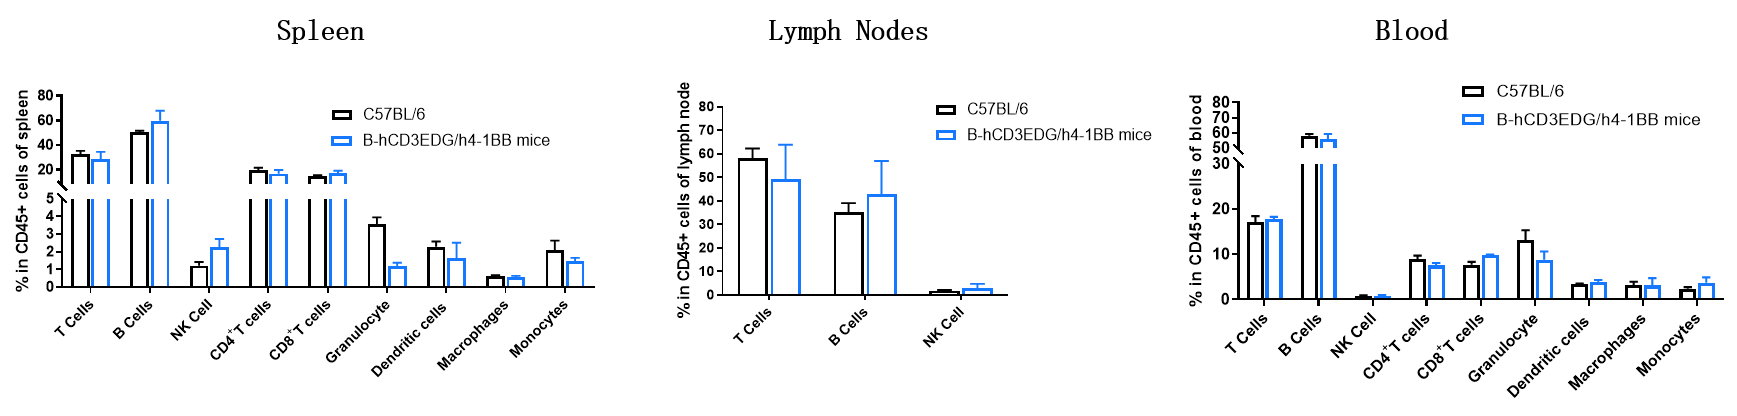
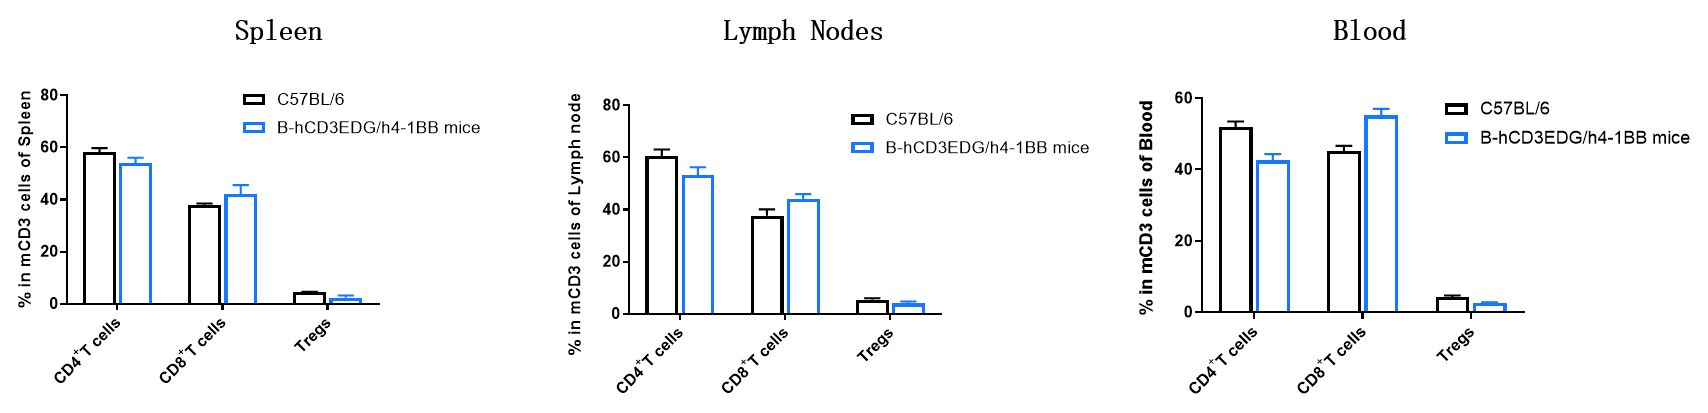
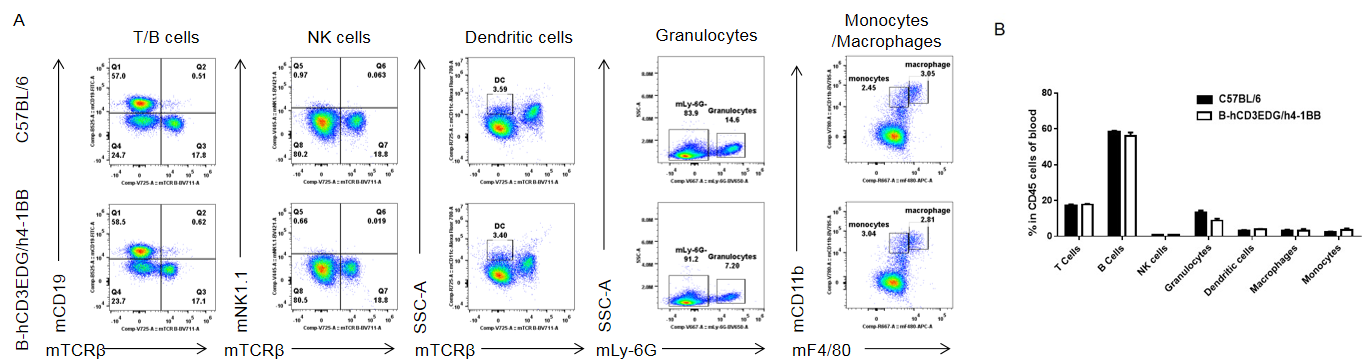
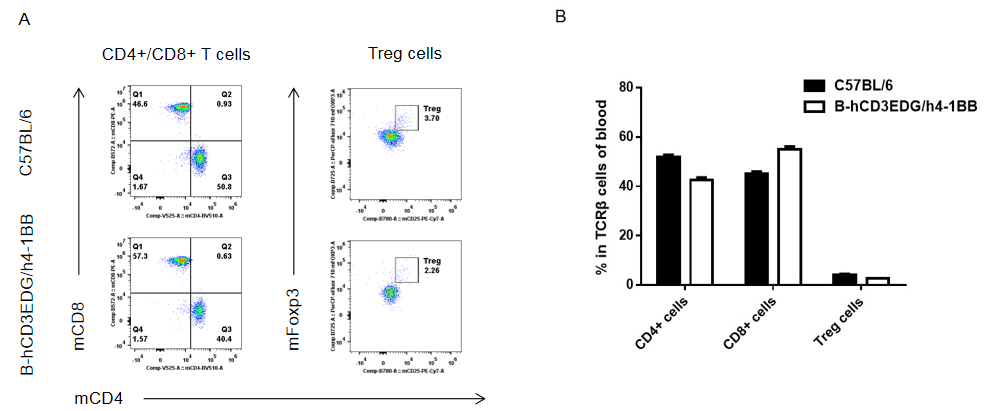
B-hCD3EDG/h4-1BB mice
Catalog Number: 112646
Strain Name: C57BL/6-Cd3etm1(CD3E)Bcgen Cd3dtm1(CD3D)BcgenCd3gtm1(CD3G)Bcgen Tnfrsf9tm1(TNFRSF9)Bcgen/Bcgen
Strain Background: C57BL/6
NCBI gene ID: 916,915,917,3604 (Human)
Aliases: T3E; TCRE; IMD18; CD3epsilon; T3D; IMD19; CD3DELTA; CD3-DELTA; T3G; IMD17; CD3GAMMA; CD3-GAMMA; ILA; 4-1BB; CD137; CDw137; IMD109
---
Licensing option available