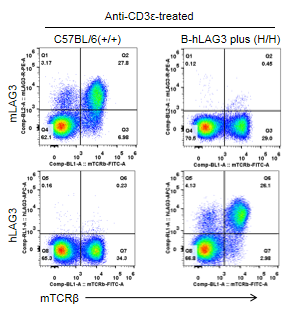
Protein expression analysis
Strain specific LAG3 expression analysis in homozygous B-hLAG3 mice plus by flow cytometry. Splenocytes were collected from WT and homozygous B-hLAG3 mice plus stimulated with anti-CD3ε in vivo, and analyzed by flow cytometry with species-specific anti-LAG3 antibody. Mouse LAG3 was detectable in WT. Human LAG3 was exclusively detectable in homozygous B-hLAG3 mice plus but not WT mice.
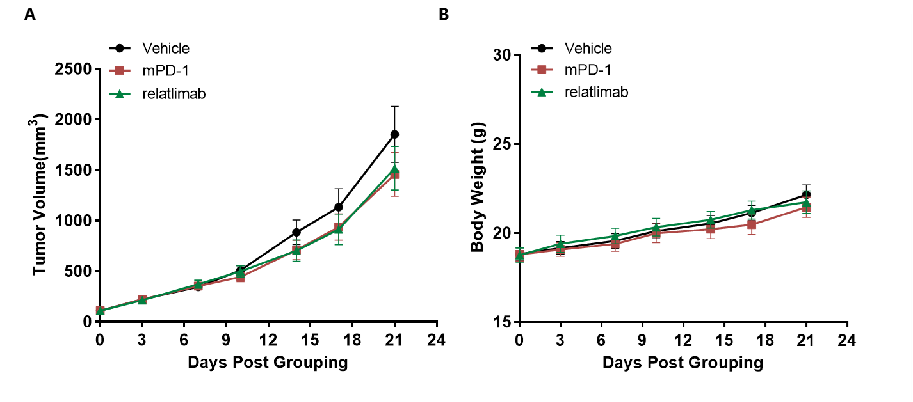
In vivo efficacy of relatlimab (in house)
Antitumor activity of anti-human LAG3 antibody in B-hLAG3 mice plus. (A) Anti-human LAG3 antibodies inhibited MC38 tumor growth in B-hLAG3 mice plus. Murine colon cancer MC38 cells were subcutaneously implanted into homozygous B-hLAG3 mice plus (female, 6-7 week-old, n=8). Mice were grouped when tumor volume reached approximately 100 mm3, at which time they were treated with relatlimab (in house) with doses and schedules indicated in panel (B) Body weight changes during treatment. As shown in panel A, relatlimab (in house) was efficacious in controlling tumor growth in B-hLAG3 mice plus, demonstrating that the B-hLAG3 mice plus provide a powerful preclinical model for in vivo evaluation of anti-human LAG3 antibodies. Values are expressed as mean ± SEM.
* When publishing results obtained using this animal model, please acknowledge the source as follows: The animal model [B-hLAG3 mice plus] (Cat# 110025) was purchased from Biocytogen.