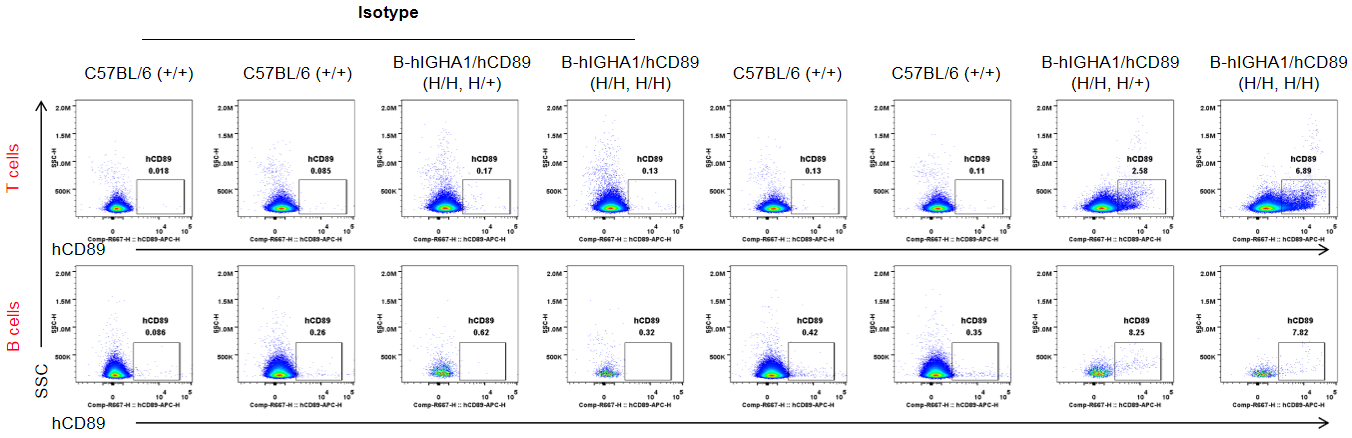
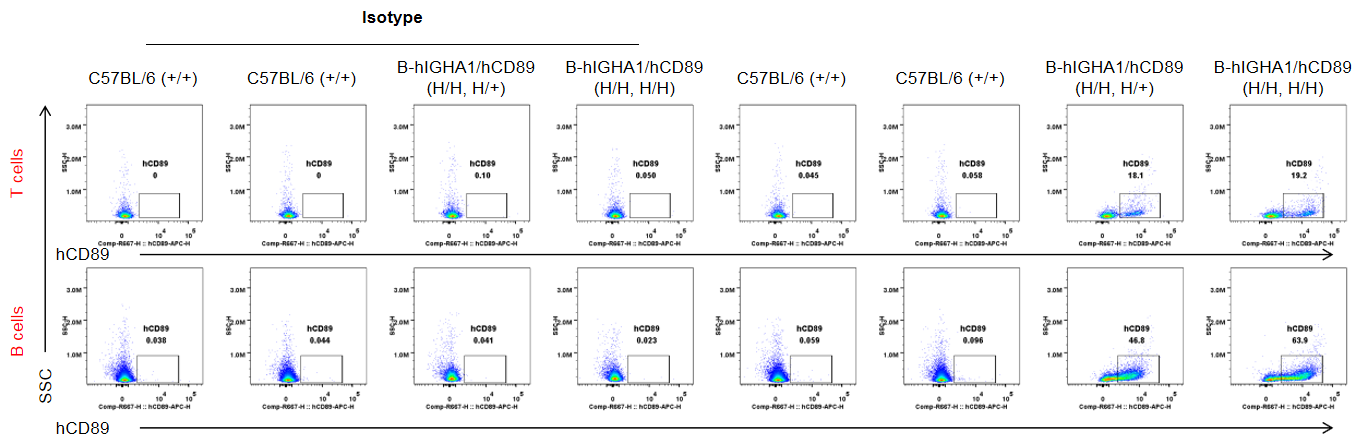
Protein expression analysis in T, B cells
CD89 protein expression analysis in heterozygous and homozygous B-hIGHA1/hCD89 mice by flow cytometry. Splenocytes were collected from wild-type C57BL/6 mice (+/+), heterozygous B-hIGHA1/hCD89 mice (H/H, H/+) and homozygous B-hIGHA1/hCD89 mice (H/H, H/H), and then analyzed by flow cytometry with anti-hCD89 antibody. hCD89 was mildly detectable in T and B cells in B-hIGHA1/hCD89 mice (H/H, H/+) and B-hIGHA1/hCD89 mice (H/H, H/H).
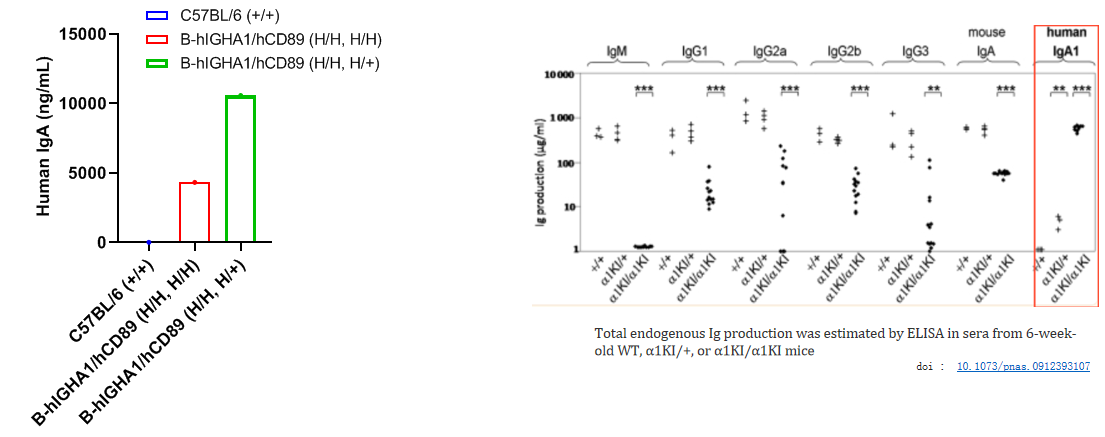
Protein expression analysis in serum
Strain specific IgA expression analysis in homozygous B-hIGHA1/hCD89 mice by ELISA. Serum were collected from 8-weeks wild-type mice C57BL/6 mice (+/+) and 8-weeks homozygous B-hIGHA1/hCD89 mice (H/H, H/+ or H/H, H/H), and analyzed by ELISA with species-specific IgA ELISA kit. hIgA was exclusively detectable in homozygous mice, but soluble IgA levels were higher in B-hIGHA1/hCD89 mice (H/H, H/+) compared to that in B-hIGHA1/hCD89 mice (H/H, H/H).
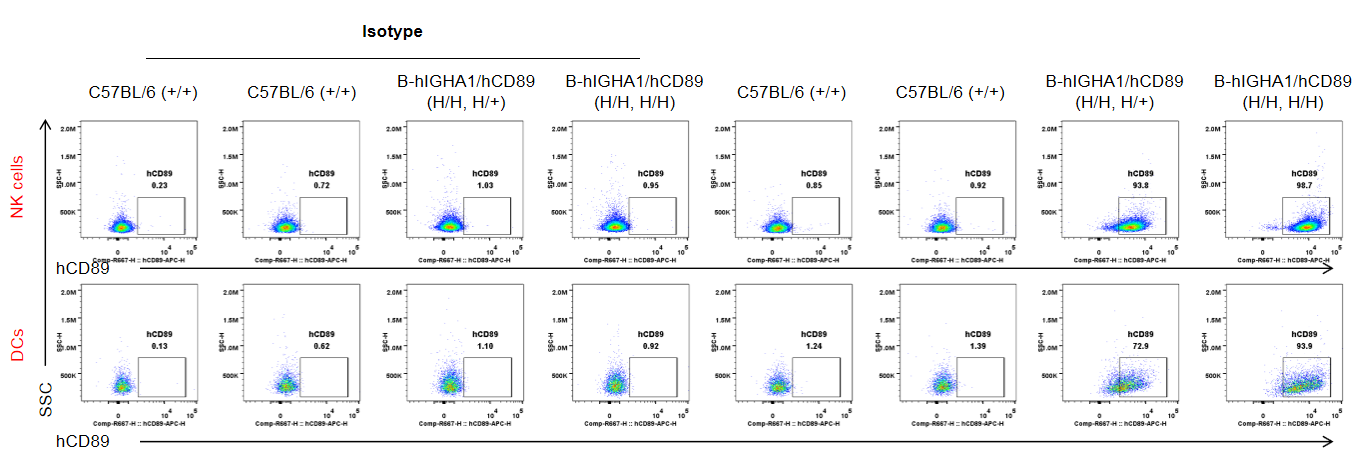
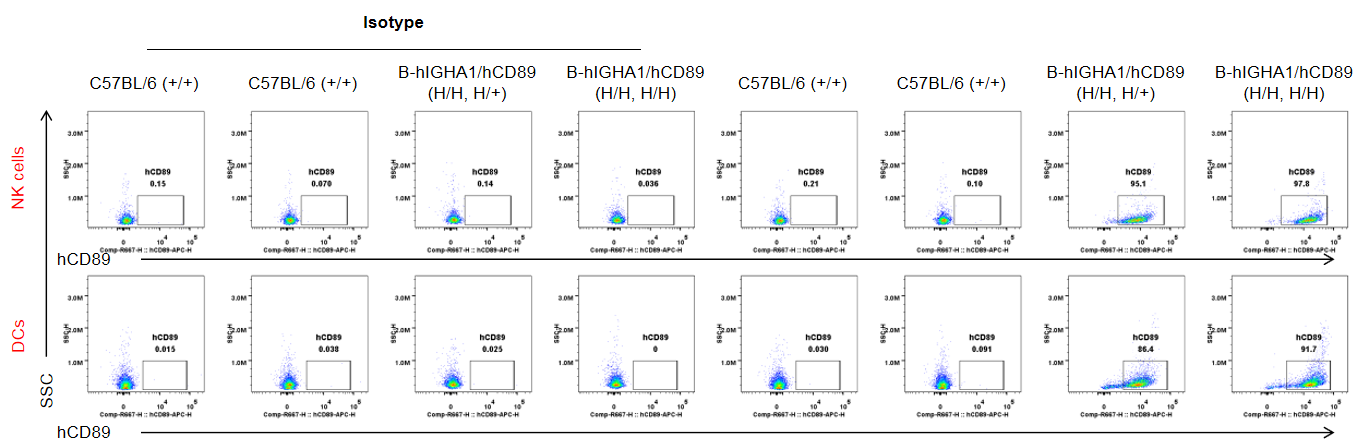
Protein expression analysis in NK cells and DCs
CD89 protein expression analysis in heterozygous and homozygous B-hIGHA1/hCD89 mice by flow cytometry. Splenocytes were collected from wild-type C57BL/6 mice (+/+), heterozygous B-hIGHA1/hCD89 mice (H/H, H/+) and homozygous B-hIGHA1/hCD89 mice (H/H, H/H), and then analyzed by flow cytometry with anti-hCD89 antibody. hCD89 was detectable in NK cells and DCs in B-hIGHA1/hCD89 mice (H/H, H/+) and B-hIGHA1/hCD89 mice (H/H, H/H).
Protein expression analysis in monocytes and macrophages
CD89 protein expression analysis in heterozygous and homozygous B-hIGHA1/hCD89 mice by flow cytometry. Splenocytes were collected from wild-type C57BL/6 mice (+/+), heterozygous B-hIGHA1/hCD89 mice (H/H, H/+) and homozygous B-hIGHA1/hCD89 mice (H/H, H/H), and then analyzed by flow cytometry with anti-hCD89 antibody. hCD89 was detectable in monocytes and macrophages in B-hIGHA1/hCD89 mice (H/H, H/+) and B-hIGHA1/hCD89 mice (H/H, H/H).
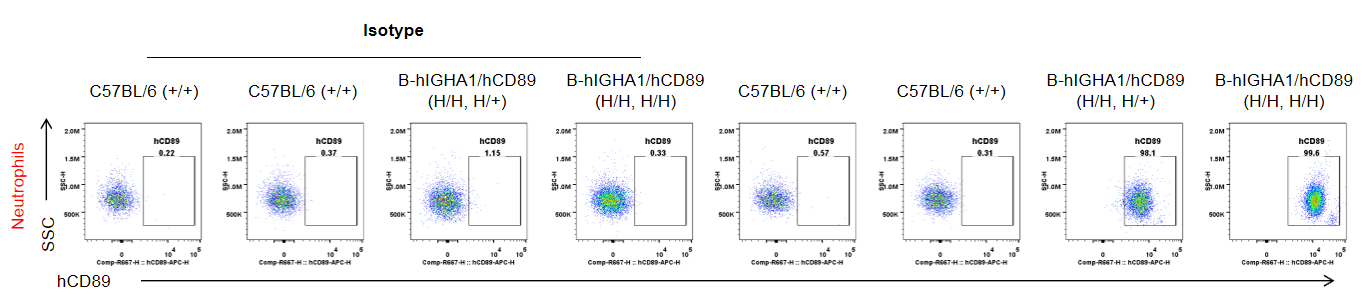
Protein expression analysis in neutrophils
CD89 protein expression analysis in heterozygous and homozygous B-hIGHA1/hCD89 mice by flow cytometry. Splenocytes were collected from wild-type C57BL/6 mice (+/+), heterozygous B-hIGHA1/hCD89 mice (H/H, H/+) and homozygous B-hIGHA1/hCD89 mice (H/H, H/H), and then analyzed by flow cytometry with anti-hCD89 antibody. hCD89 was detectable in neutrophils in B-hIGHA1/hCD89 mice (H/H, H/+) and B-hIGHA1/hCD89 mice (H/H, H/H).
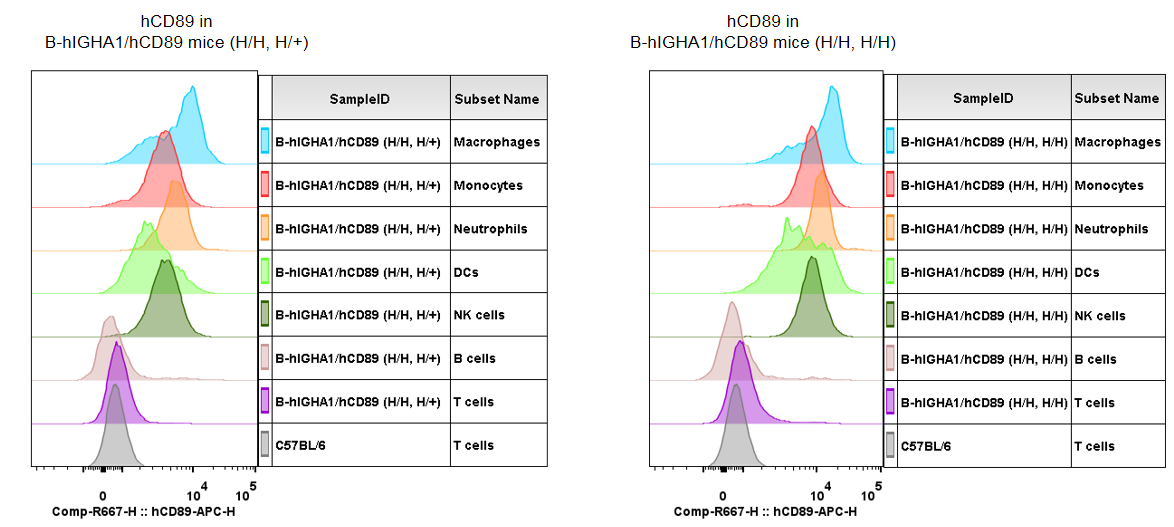
Protein expression analysis in spleen
CD89 protein expression analysis in heterozygous and homozygous B-hIGHA1/hCD89 mice by flow cytometry. Splenocytes were collected from wild-type C57BL/6 mice (+/+), heterozygous B-hIGHA1/hCD89 mice (H/H, H/+) and homozygous B-hIGHA1/hCD89 mice (H/H, H/H), and then analyzed by flow cytometry with anti-hCD89 antibody. hCD89 was mainly detectable in NK cells, DCs, monocytes, macrophages and neutrophils in B-hIGHA1/hCD89 mice (H/H, H/+) and B-hIGHA1/hCD89 mice (H/H, H/H).
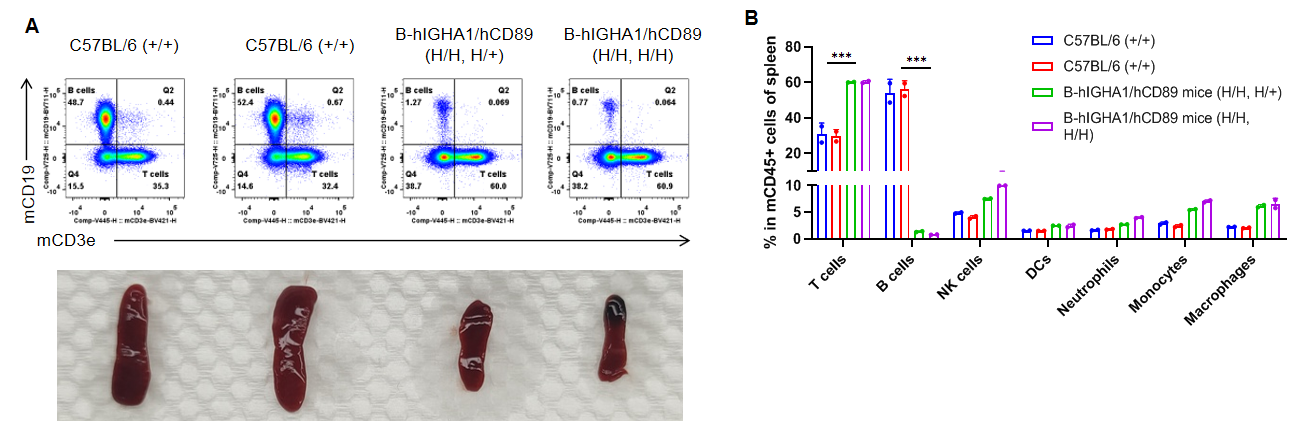
Analysis of leukocytes cell subpopulation in spleen
Analysis of spleen leukocyte subpopulations by flow cytometry. Splenocytes were collected from wild-type C57BL/6 mice (+/+), heterozygous B-hIGHA1/hCD89 mice (H/H, H/+) and homozygous B-hIGHA1/hCD89 mice (H/H, H/H). Flow cytometry analysis of the splenocytes was performed to assess leukocyte subpopulations. A. Representative FACS plots. Single live cells were gated for the CD45+ population and used for further analysis as indicated here. B. Results of FACS analysis. Percent of B cells was decreased and T cells increased in B-hIGHA1/hCD89 mice accompanied with a smaller spleen compared to that in C57BL/6 mice. Values are expressed as mean ± SD.
Protein expression analysis in T, B cells
CD89 protein expression analysis in heterozygous and homozygous B-hIGHA1/hCD89 mice by flow cytometry. Bone marrow cells were collected from wild-type C57BL/6 mice (+/+), heterozygous B-hIGHA1/hCD89 mice (H/H, H/+) and homozygous B-hIGHA1/hCD89 mice (H/H, H/H), and then analyzed by flow cytometry with anti-hCD89 antibody. hCD89 was detectable in T and B cells in B-hIGHA1/hCD89 mice (H/H, H/+) and B-hIGHA1/hCD89 mice (H/H, H/H).
Protein expression analysis in NK cells and DCs
CD89 protein expression analysis in heterozygous and homozygous B-hIGHA1/hCD89 mice by flow cytometry. Bone marrow cells were collected from wild-type C57BL/6 mice (+/+), heterozygous B-hIGHA1/hCD89 mice (H/H, H/+) and homozygous B-hIGHA1/hCD89 mice (H/H, H/H), and then analyzed by flow cytometry with anti-hCD89 antibody. hCD89 was detectable in NK cells and DCs in B-hIGHA1/hCD89 mice (H/H, H/+) and B-hIGHA1/hCD89 mice (H/H, H/H).
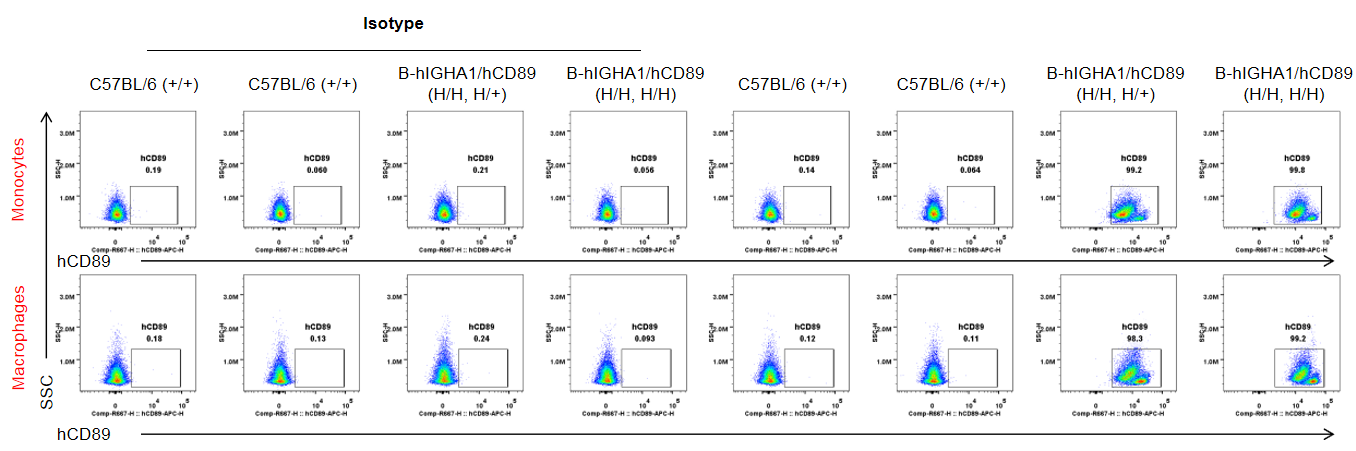
Protein expression analysis in monocytes and macrophages
CD89 protein expression analysis in heterozygous and homozygous B-hIGHA1/hCD89 mice by flow cytometry. Bone marrow cells were collected from wild-type C57BL/6 mice (+/+), heterozygous B-hIGHA1/hCD89 mice (H/H, H/+) and homozygous B-hIGHA1/hCD89 mice (H/H, H/H), and then analyzed by flow cytometry with anti-hCD89 antibody. hCD89 was detectable in monocytes and macrophages in B-hIGHA1/hCD89 mice (H/H, H/+) and B-hIGHA1/hCD89 mice (H/H, H/H).
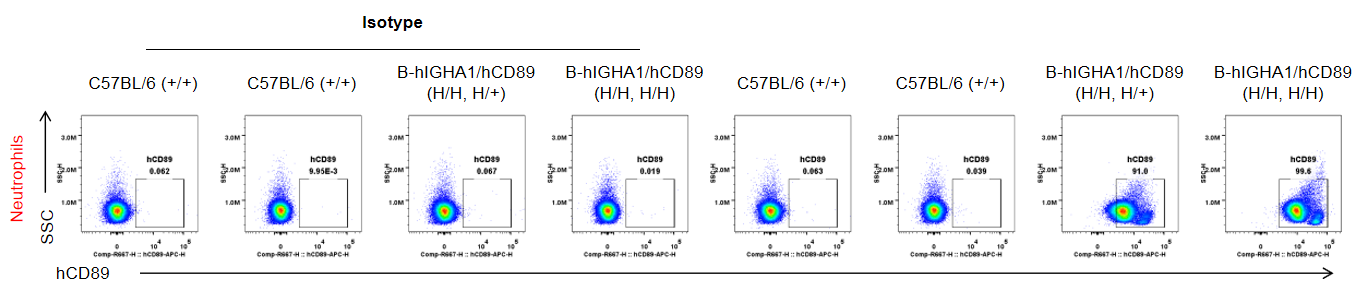
Protein expression analysis in neutrophils
CD89 protein expression analysis in heterozygous and homozygous B-hIGHA1/hCD89 mice by flow cytometry. Bone marrow cells were collected from wild-type C57BL/6 mice (+/+), heterozygous B-hIGHA1/hCD89 mice (H/H, H/+) and homozygous B-hIGHA1/hCD89 mice (H/H, H/H), and then analyzed by flow cytometry with anti-hCD89 antibody. hCD89 was detectable in neutrophils in B-hIGHA1/hCD89 mice (H/H, H/+) and B-hIGHA1/hCD89 mice (H/H, H/H).
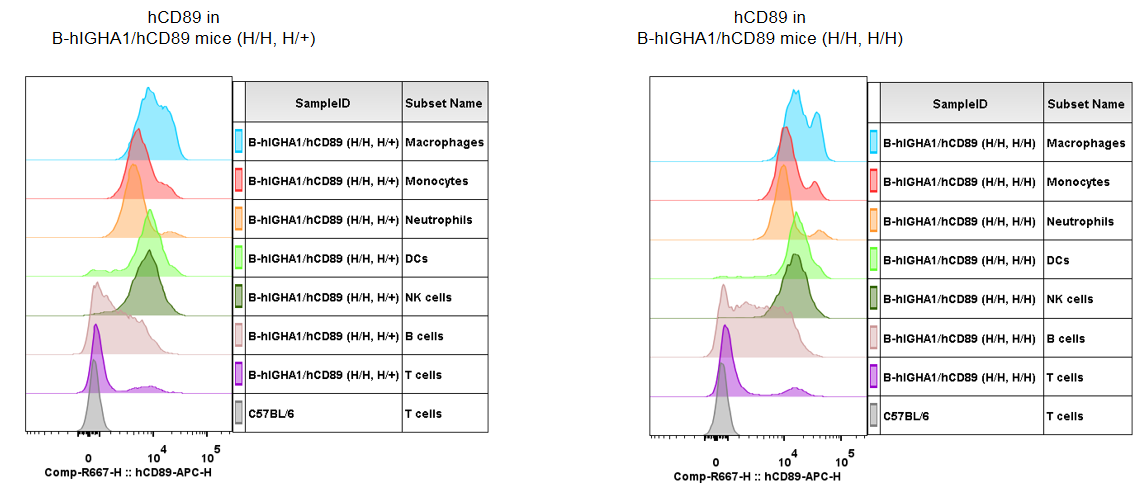
Protein expression analysis in Bone marrow
CD89 protein expression analysis in heterozygous and homozygous B-hIGHA1/hCD89 mice by flow cytometry. Bone marrow cells were collected from wild-type C57BL/6 mice (+/+), heterozygous B-hIGHA1/hCD89 mice (H/H, H/+) and homozygous B-hIGHA1/hCD89 mice (H/H, H/H), and then analyzed by flow cytometry with anti-hCD89 antibody. hCD89 was detectable in T, B, NK cells, DCs, monocytes, macrophages and neutrophils in B-hIGHA1/hCD89 mice (H/H, H/+) and B-hIGHA1/hCD89 mice (H/H, H/H).
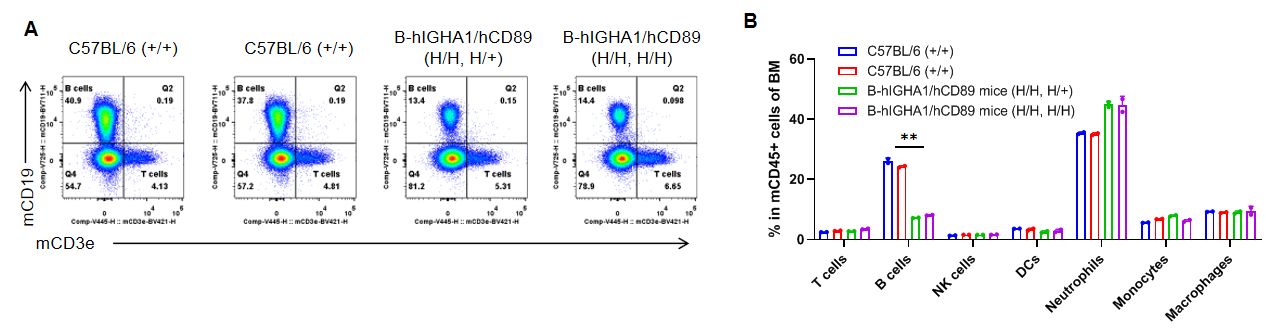
Analysis of leukocytes cell subpopulation in bone marrow
Analysis of bone marrow leukocyte subpopulations by flow cytometry. Bone marrow cells were collected from wild-type C57BL/6 mice (+/+), heterozygous B-hIGHA1/hCD89 mice (H/H, H/+) and homozygous B-hIGHA1/hCD89 mice (H/H, H/H). Flow cytometry analysis of the bone marrow cells was performed to assess leukocyte subpopulations. A. Representative FACS plots. Single live cells were gated for the CD45+ population and used for further analysis as indicated here. B. Results of FACS analysis. Percent of B cells was decreased in B-hIGHA1/hCD89 mice compared to that in C57BL/6 mice. Values are expressed as mean ± SD.
* When publishing results obtained using this animal model, please acknowledge the source as follows: The animal model [B-hIGHA1/hCD89 mice] (Cat# 112799) was purchased from Biocytogen.