
OT-II mice

C57BL/6-Igs2tm1(Trav2)Igs7tm1(Trbv5)/Bcgen • 113876

B-Zmpste24 KO mice

OT-II mice

Catalog Number: 113876
Strain Name: C57BL/6-Igs2tm1(Trav2)Igs7tm1(Trbv5)/Bcgen
Strain Background: C57BL/6
NCBI gene ID: 100042372,100124661 (Mouse)
Aliases: Gm1209; Gm10886; Tcrb-V1
---
Licensing option available
OT-II mice

on this page

  • Description
  • Targeting strategy
  • Phenotypic analysis

Posters

View All

    Publication

      Description

      OT-II mice: Biological Roles and Therapeutic Strategies

      • Gene Information: The OT-II mouse carries co-injected transgenes encoding the mouse TCR α-chain (Vα2) and β-chain (Vβ5) under the control of an endogenous TCR promoter, targeting the locus to enforce expression of a single TCR rearrangement.
      • Protein Expression: The transgenic Vα2/Vβ5 TCR complex pairs exclusively with the CD4 coreceptor, leading to a marked four-fold increase in the peripheral CD4+ to CD8+ T-cell ratio, where virtually all CD4+ T cells express this specific receptor.
      • Signaling Pathway: Upon specific recognition of the chicken ovalbumin residues 323–339 peptide presented by MHC class II (I-Ab) molecules, the transgenic TCR triggers CD3 phosphorylation cascades, driving robust, dose-dependent CD4+ T-cell activation, IL-2 secretion, and proliferation.
      • Therapeutic Inhibition: This model serves as a standardized in vivo and in vitro platform to track antigen-specific CD4+ T-cell responses, investigate CD4-mediated helper T-cell (Th1/Th2/Th17) differentiation, and study immunological tolerance or autoimmune disease mechanisms.
      Targeting Strategy

      OT-II mice

      • The mouse Trav2 that is driven by mouse H2-K promoter was inserted into Hipp11 (H11) locus in OT-II mice. The mouse Trbv5 gene is driven by mouse Trav17 promoter was inserted into TIGRE locus in OT-II mice.
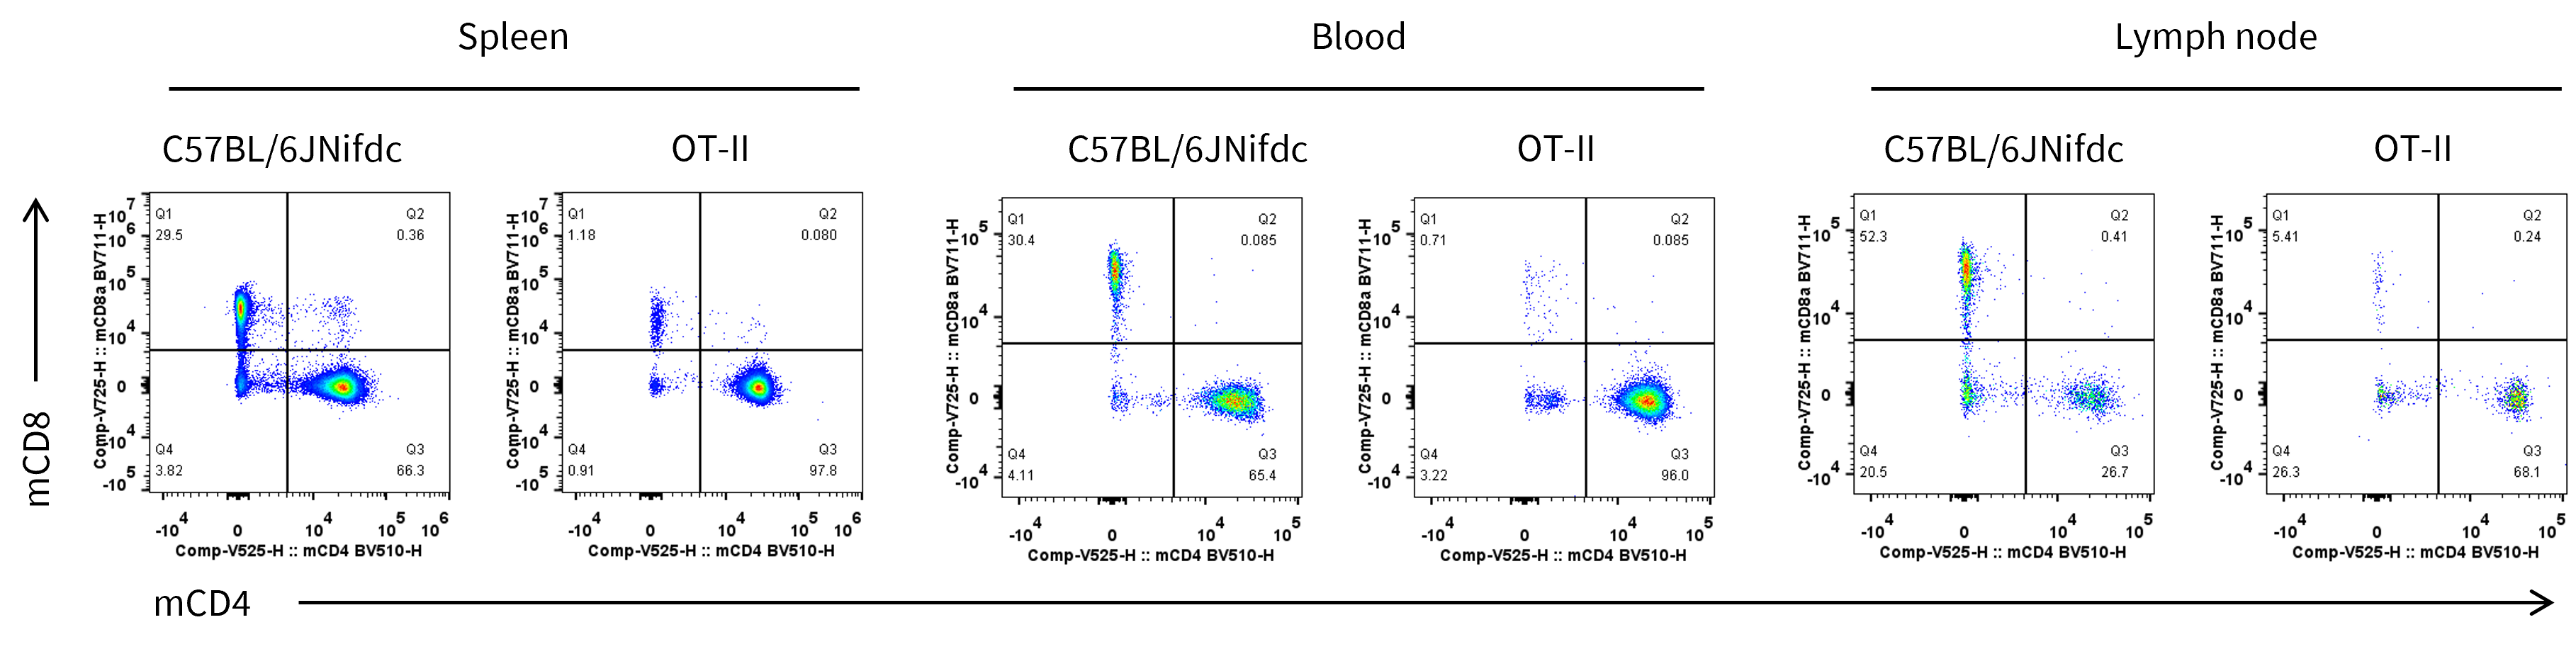
      The Increasing CD4+T/CD8+T Cells Ratio
      • OT-II mice exhibit a significant shift in their T cell population, with increasing in the CD4+/CD8+ T cell ratio compared to wild-type mice.

      The CD4+/CD8 ratio between wild-type C57BL/6JNifdc mice and homozygous OT-II mice. Splenocytes, blood and lymph nodes were collected from wild-type C57BL/6JNifdc mice and homozygous OT-II mice (male, 7-week-old).
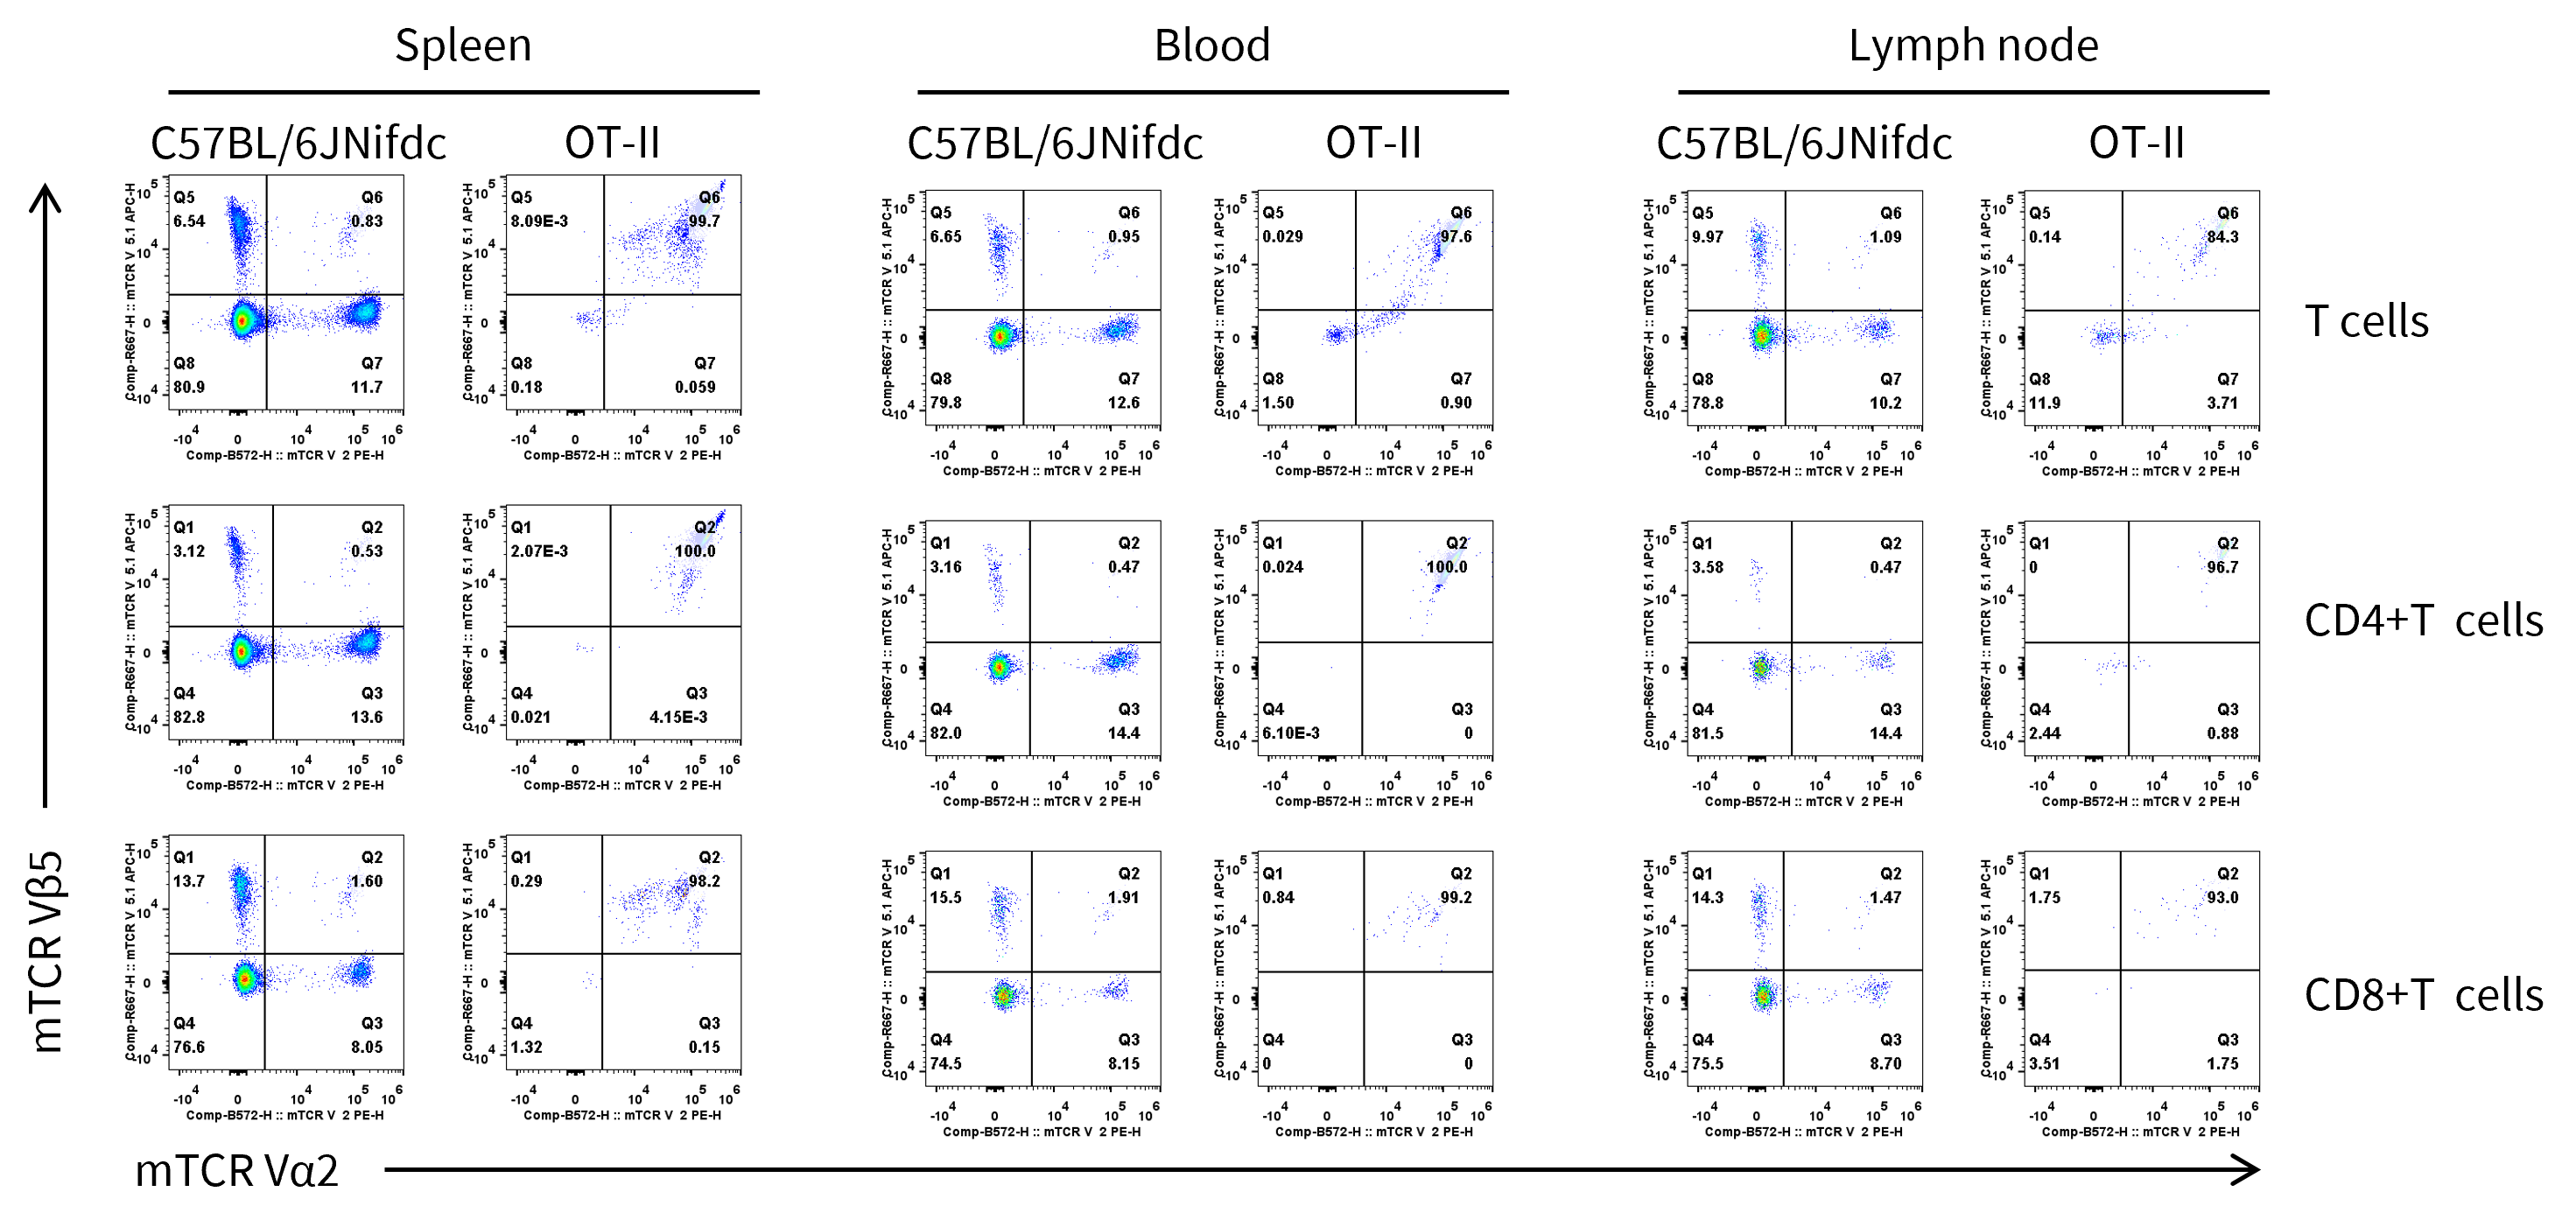
      TCR Vα2 and Vβ5 Protein Expression Analysis
      • The mouse TCR Vα2+TCR Vβ5+ cells were exclusively detectable in homozygous OT-II mice.

      Strain specific mouse TCR Vα2 and TCR Vβ5 expression analysis in wild-type C57BL/6JNifdc mice and homozygous B-OT-II mice by flow cytometry. Splenocytes were collected from wild-type C57BL/6JNifdc mice (+/+) and homozygous OT-II mice (H/H), and analyzed by flow cytometry with species-specific anti-mTCR Vα2 antibody (Biolegend, 127807) and anti-mTCR Vβ5.1, 5.2  antibody (Biolegend, 139505).

      Antigen-specific Activation
      • Flow cytometry analyses of OVA323–339 challenged CD4+ T cells from OT-II mice showed higher surface expression levels of the early T cell activation markers CD69 and CD25.

      Antigen-specific activation increases surface CD25 and CD69 expression of OT-II CD4+ T cells. Splenocytes from wild-type C57BL/6JNifdc mice and homozygous OT-II mice were exposed for 24h to OVA323-339. In parallel, medium and OVA257-264 (10 µg/mL) were included as negative controls. And anti-mCD3e mAb were included positive controls. Percentage of CD25+ (A) and CD69+ (B) gated CD4+ T-cells were assessed by flow cytometry. Data are mean ± SEM values.
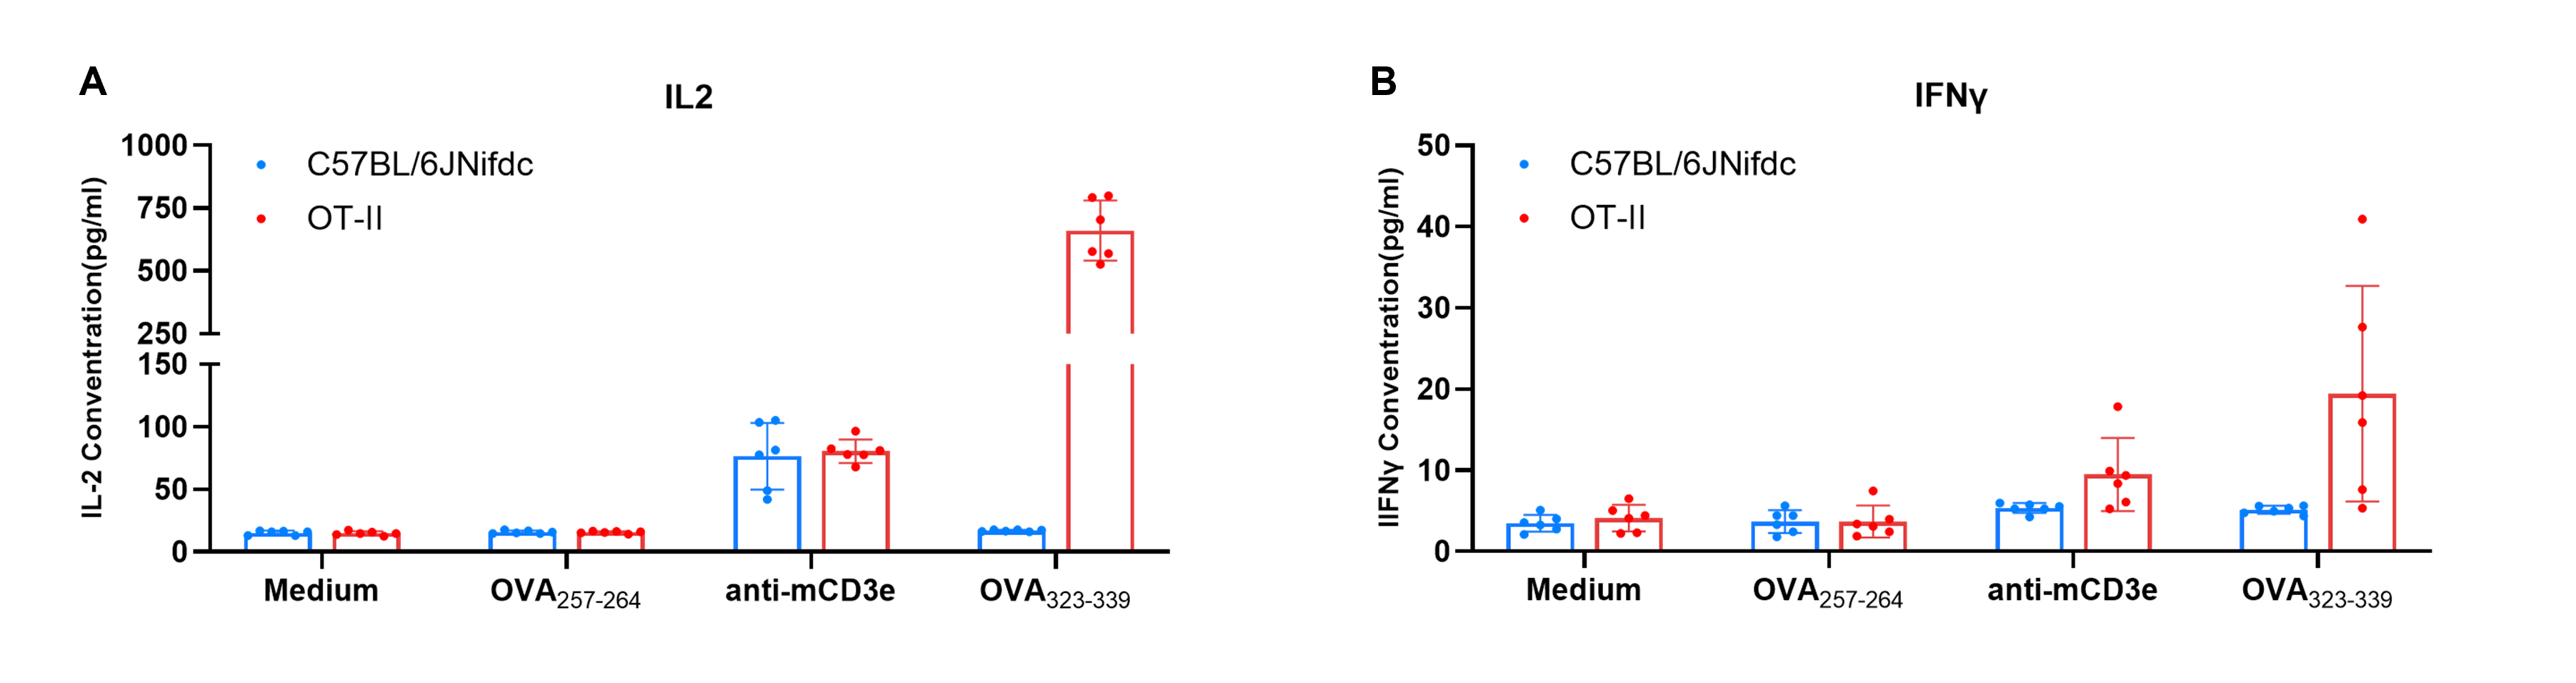
      Antigen-specific Activation Increases IL-2 Expression
      • ELISA analysis of culture supernatants from OVA323-339-challenged (10 µg/mL) OT-II mice splenocytes for 24h revealed increased levels of IL-2.

      Antigen-specific activation increases IL-2 but not IFN-γ expression of OT-II splenocytes. (A) Culture supernatants from wild-type C57BL/6JNifdc mice, homozygous OT-II mice (Biocytogen splenocytes stimulated for 24h with medium, OVA257-264 (10 µg/mL), anti-mCD3e mAb (0.5 mg/mL) or OVA323-339 (10 µg/mL) were assayed for IL-2 and IFN-γ levels by ELISA. Data are mean ± SEM values.
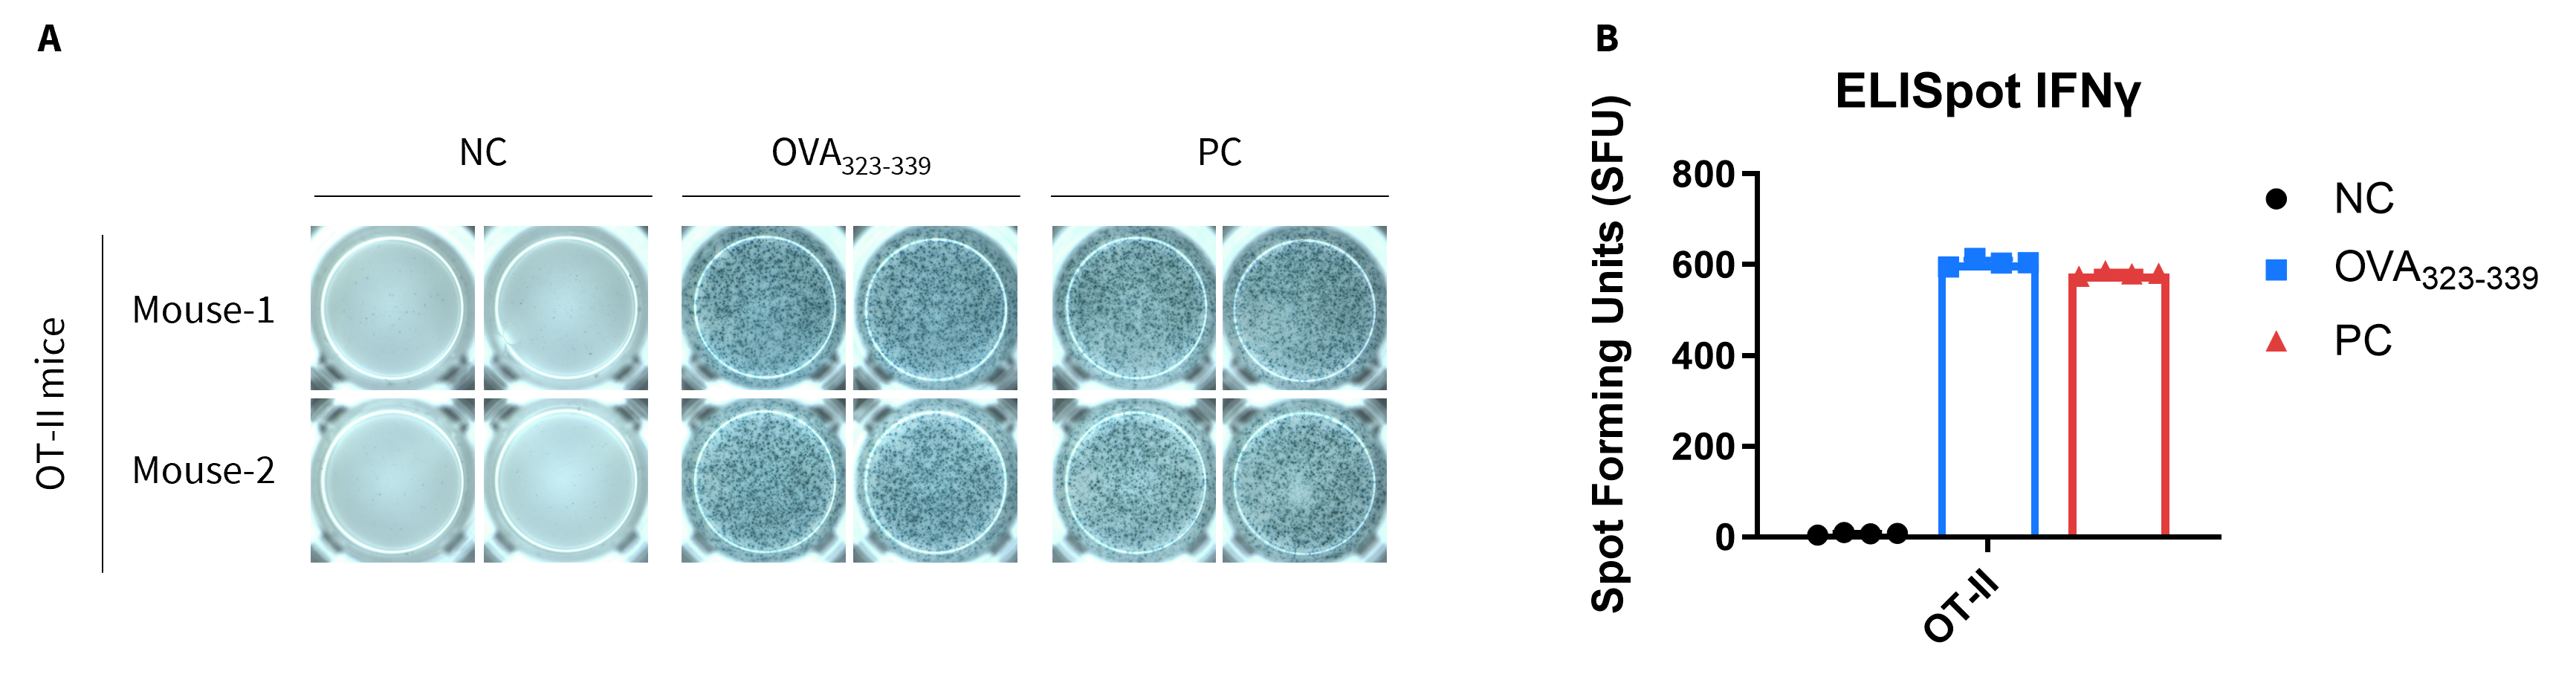
      The Peptide OVA323-339 Induced Immune Responses
      • OT-II mice have specific response to the OVA323-339.

      Detection of OVA-induced immune responses in OT-II mice by IFN-γ ELISpot assay. Female OT-II mice from the Biocytogen were immunized with intraperitoneal injection of 0.5 mg of OVA protein (Simga, A5503-25MG) and 50 μg poly (I:C) (InvivoGen, tlrl-pic). Three weeks after the last immunization, mice were sacrificed. Mice were immunized with OVA two times at 1-week interval. One week after the last immunization, mice were sacrificed. The splenocytes were extracted, stimulated with OVA323-339, or no peptide as negative control (NC), or Cell Activation Cocktail (without Brefeldin A), (Biolegend, 42330) as positive control, and then measured for IFN-γ secretion. No significant difference in body weight among groups (Data was not shown). (A) Representative results showing stimulation of splenocytes harvested from immunized mice with negative control, or OVA323-339, or positive control in duplicates. (B) Summary of results. These data indicate that OT-II mice have specific response to the OVA323-339.

      * When publishing results obtained using this animal model, please acknowledge the source as follows: The animal model [OT-II mice] (Cat# 113876) was purchased from Biocytogen.