TNFA Protein Expression Analysis
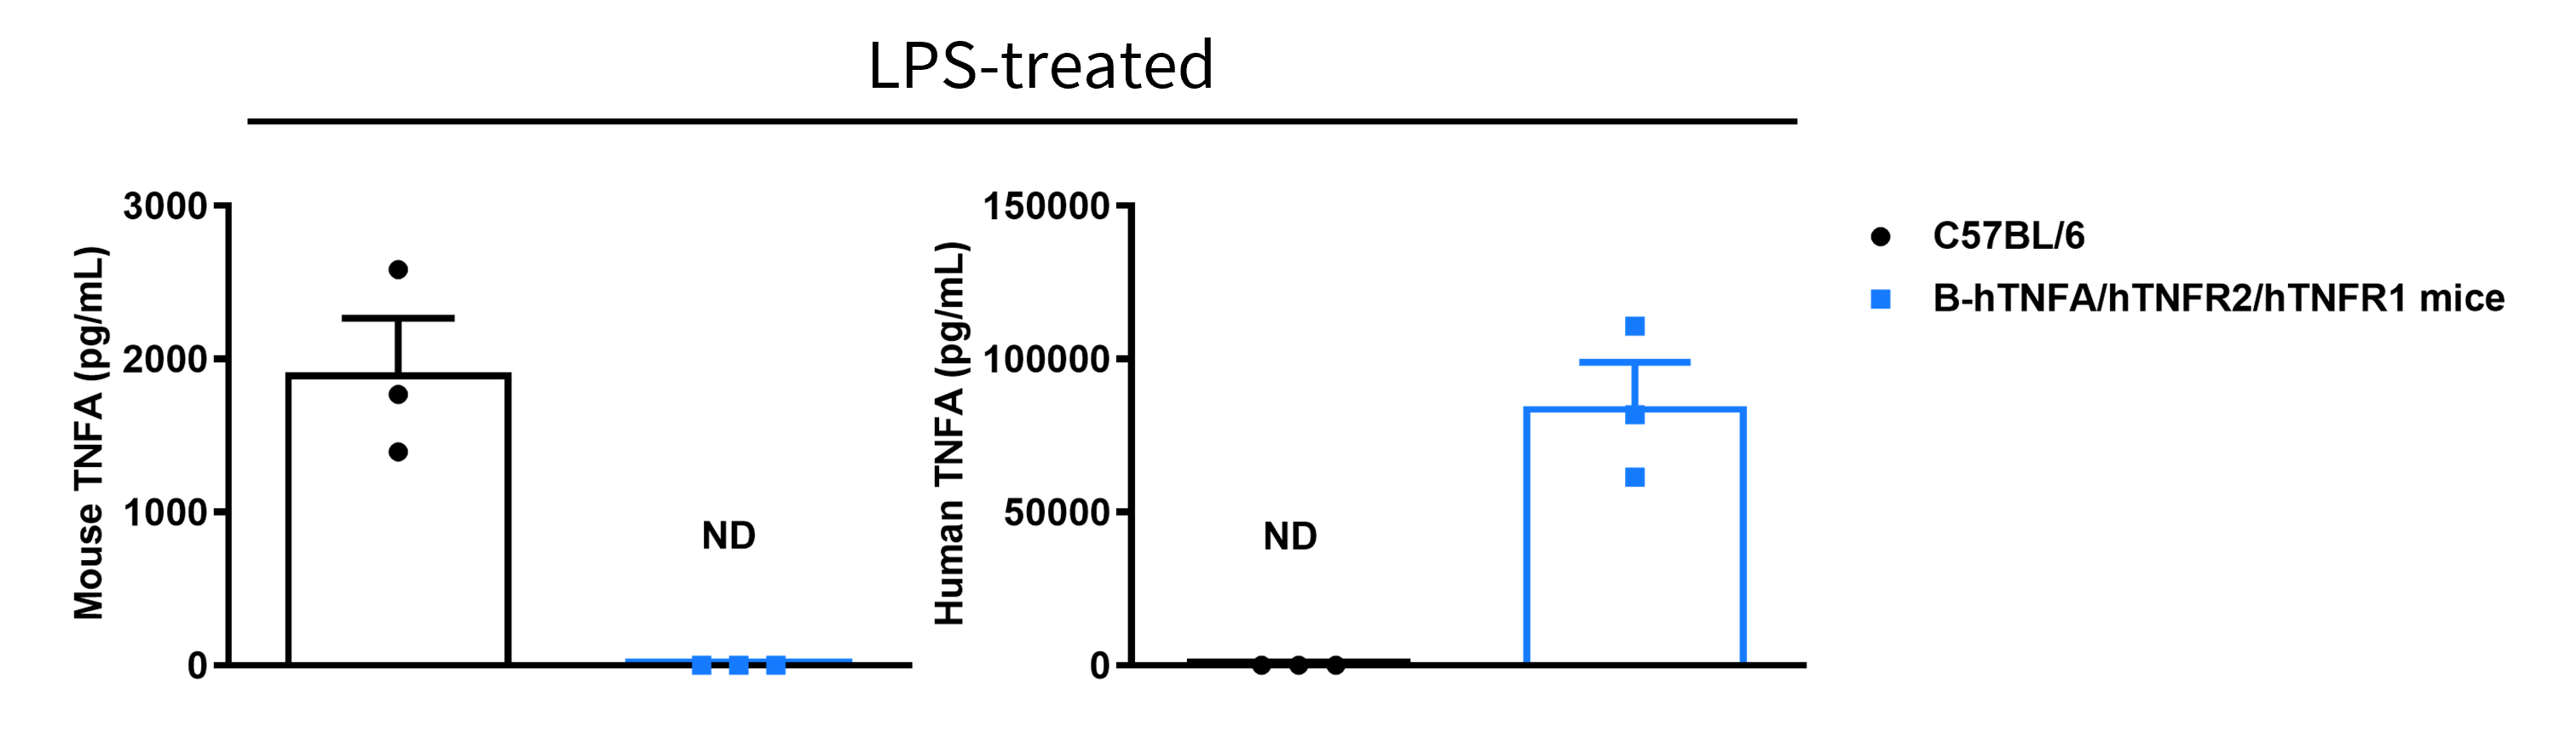
- Mouse TNFA was detected exclusively in wild-type C57BL/6 mice.
- Human TNFA was detected in homozygous B-hTNFA/hTNFR2/hTNFR1 mice, but not in wild-type mice.
Strain specific TNFA expression analysis in wild-type C57BL/6 mice and B-hTNFA/hTNFR2/hTNFR1 mice by ELISA. Serum was collected from wild-type C57BL/6 mice (+/+) and homozygous B-hTNFA/hTNFR2/hTNFR1 mice (H/H;H/H;H/H) stimulated with LPS in vivo, and analyzed by ELISA with species-specific TNFA ELISA kit. Mouse TNFA was detectable in wild-type C57BL/6 mice mice. Human TNFA was exclusively detectable in homozygous B-hTNFA/hTNFR2/hTNFR1 mice (H/H;H/H;H/H) but not C57BL/6 mice (+/+) . Values are expressed as mean ± SEM. ND: not detectable.
TNFR1 Protein Expression in Spleen
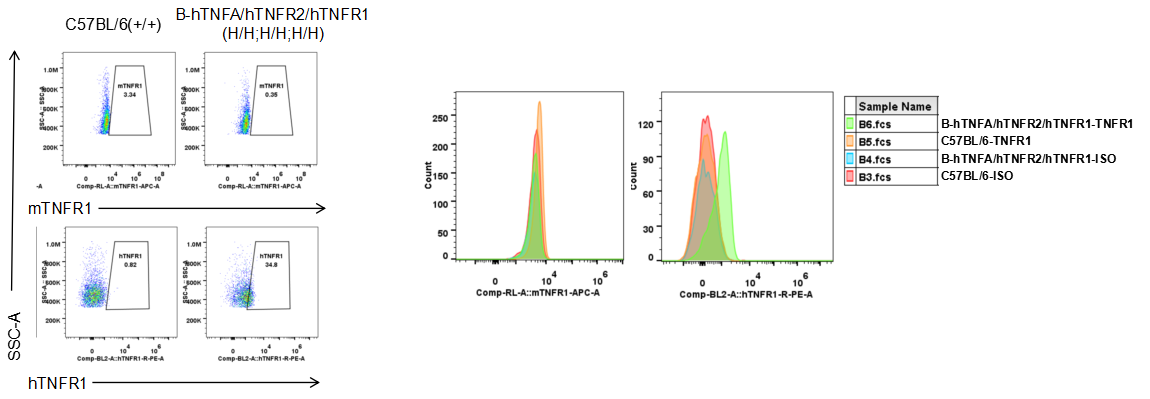
- Human TNFR1 was exclusively expressed on neutrophils in B-hTNFA/hTNFR2/hTNFR1 mice.
Strain specific TNFR1 expression analysis in homozygous B-hTNFA/hTNFR2/hTNFR1 mice by flow cytometry. Splenocytes were collected from C57BL/6 wild-type mice (+/+) and homozygous B-hTNFA/hTNFR2/hTNFR1 mice (H/H;H/H;H/H), and analyzed by flow cytometry with species-specific anti-TNFR1 antibody. Mouse TNFR1 was detectable in C57BL/6 mice (+/+). Human TNFR1 was exclusively detectable in homozygous B-hTNFA/hTNFR2/hTNFR1 mice (H/H;H/H;H/H) but not in C57BL/6 mice (+/+).
TNFR2 Protein Expression in Spleen
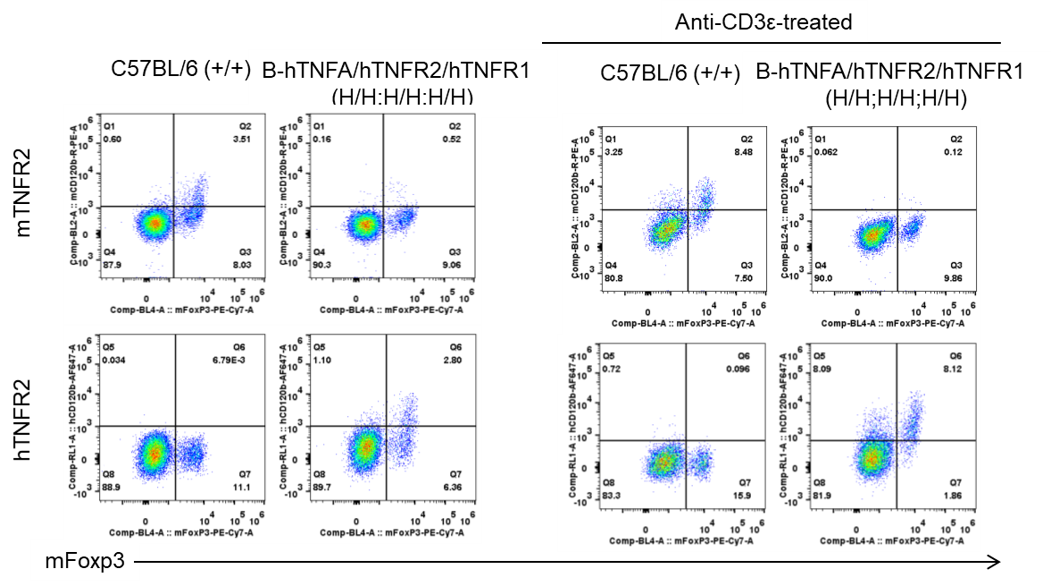
- Human TNFR2 was exclusively expressed on regulatory T cells in B-hTNFA/hTNFR2/hTNFR1 mice.
Strain specific TNFR2 expression analysis in homozygous B-hTNFA/hTNFR2/hTNFR1 mice by flow cytometry. Splenocytes were collected from C57BL/6 wild-type mice (+/+) and homozygous B-hTNFA/hTNFR2/hTNFR1 mice (H/H;H/H;H/H) stimulated with anti-CD3ε in vivo, and analyzed by flow cytometry with species-specific anti-TNFR2 antibody. Mouse TNFR2 was detectable in C57BL/6 mice (+/+). Human TNFR2 was exclusively detectable in homozygous B-hTNFA/hTNFR2/hTNFR1 mice (H/H;H/H;H/H) but not in C57BL/6 mice (+/+).
Analysis of Leukocyte Subpopulations
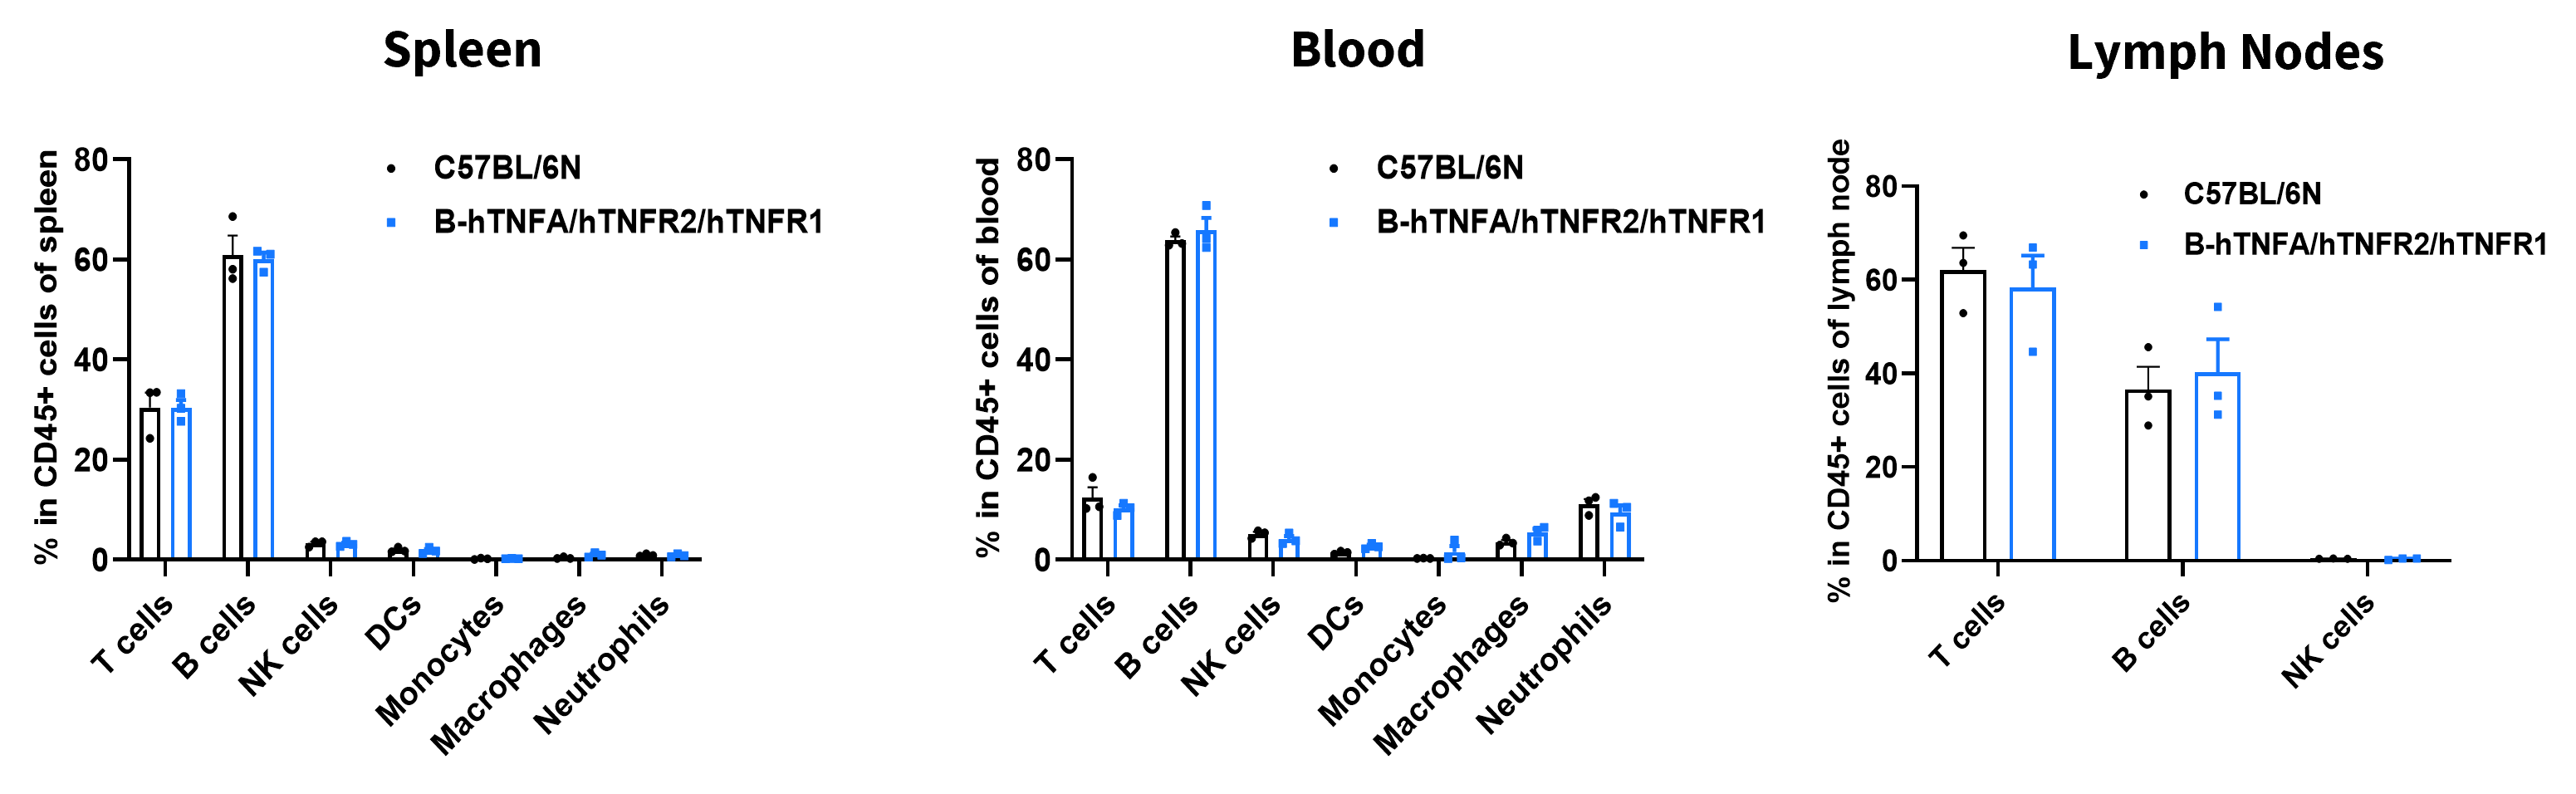
- The percentages of T cells, B cells, NK cells, DCs, neutrophils, monocytes, and macrophages in homozygous B-hTNFA/hTNFR2/hTNFR1 mice were similar to those in C57BL/6N mice.
- Humanization of TNF, TNFR1, and TNFR2 does not affect normal immune cell development or splenic distribution.
Analysis of leukocyte subpopulations by flow cytometry in immune organs and blood. Splenocytes, peripheral blood, and lymph nodes were isolated from female C57BL/6N and B-hTNFA/hTNFR2/hTNFR1 mice (female, 9-week-old, n = 3). Single live cells were gated on the CD45⁺ population and analyzed by flow cytometry as indicated. Values are expressed as mean ± SEM.
Analysis of T Cell Subpopulations
- The proportions of CD4⁺ T cells, CD8⁺ T cells, and Tregs in homozygous B-hTNFA/hTNFR2/hTNFR1 mice were comparable to those in C57BL/6N mice.
- Humanization of TNF, TNFR1, and TNFR2 does not affect normal T cell development, differentiation, or splenic distribution.
Analysis of T-cell subpopulations by flow cytometry in immune organs and blood. Splenocytes, peripheral blood, and lymph nodes were isolated from female C57BL/6N and B-hTNFA/hTNFR2/hTNFR1 mice (female, 9-week-old, n = 3). Single live cells were gated on the CD3⁺ T-cell population and analyzed by flow cytometry as indicated. Values are expressed as mean ± SEM.
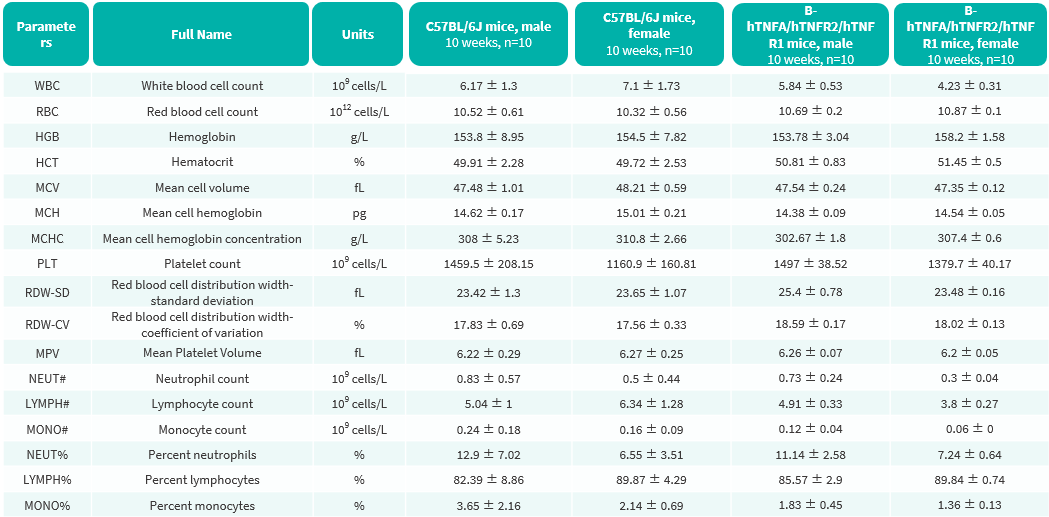
Hematology Analysis
- No significant differences were observed compared with wild-type mice.
Complete blood count (CBC) of B-hTNFA/hTNFR2/hTNFR1 mice. Values are expressed as mean ± SD.
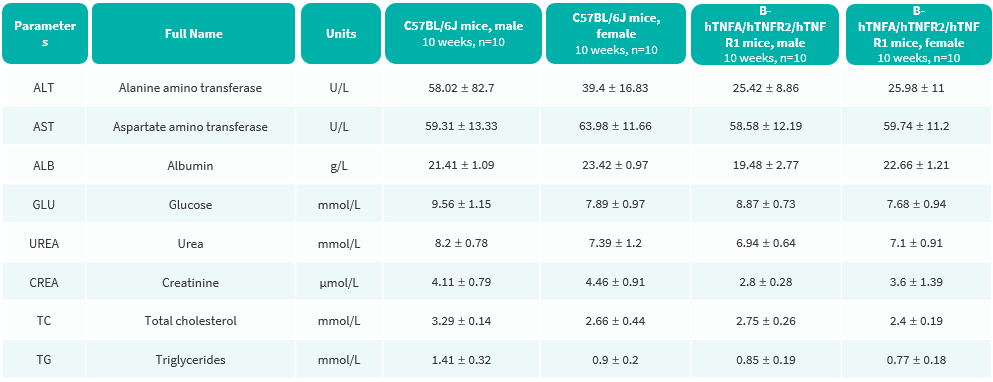
Blood Biochemical Analysis
- No significant differences were observed compared with wild-type mice.
Blood biochemical parameters of B-hTNFA/hTNFR2/hTNFR1 mice are shown. Values are expressed as mean ± SD.
In Vivo Efficacy of Anti-human TNFA Antibody in LPS-induced Response
- Anti-human TNFA significantly decreased mouse IL6 and mouse IFNγ expression at four hours after LPS injection, indicating a successful inhibition of the downstream activation caused by hTNFA.
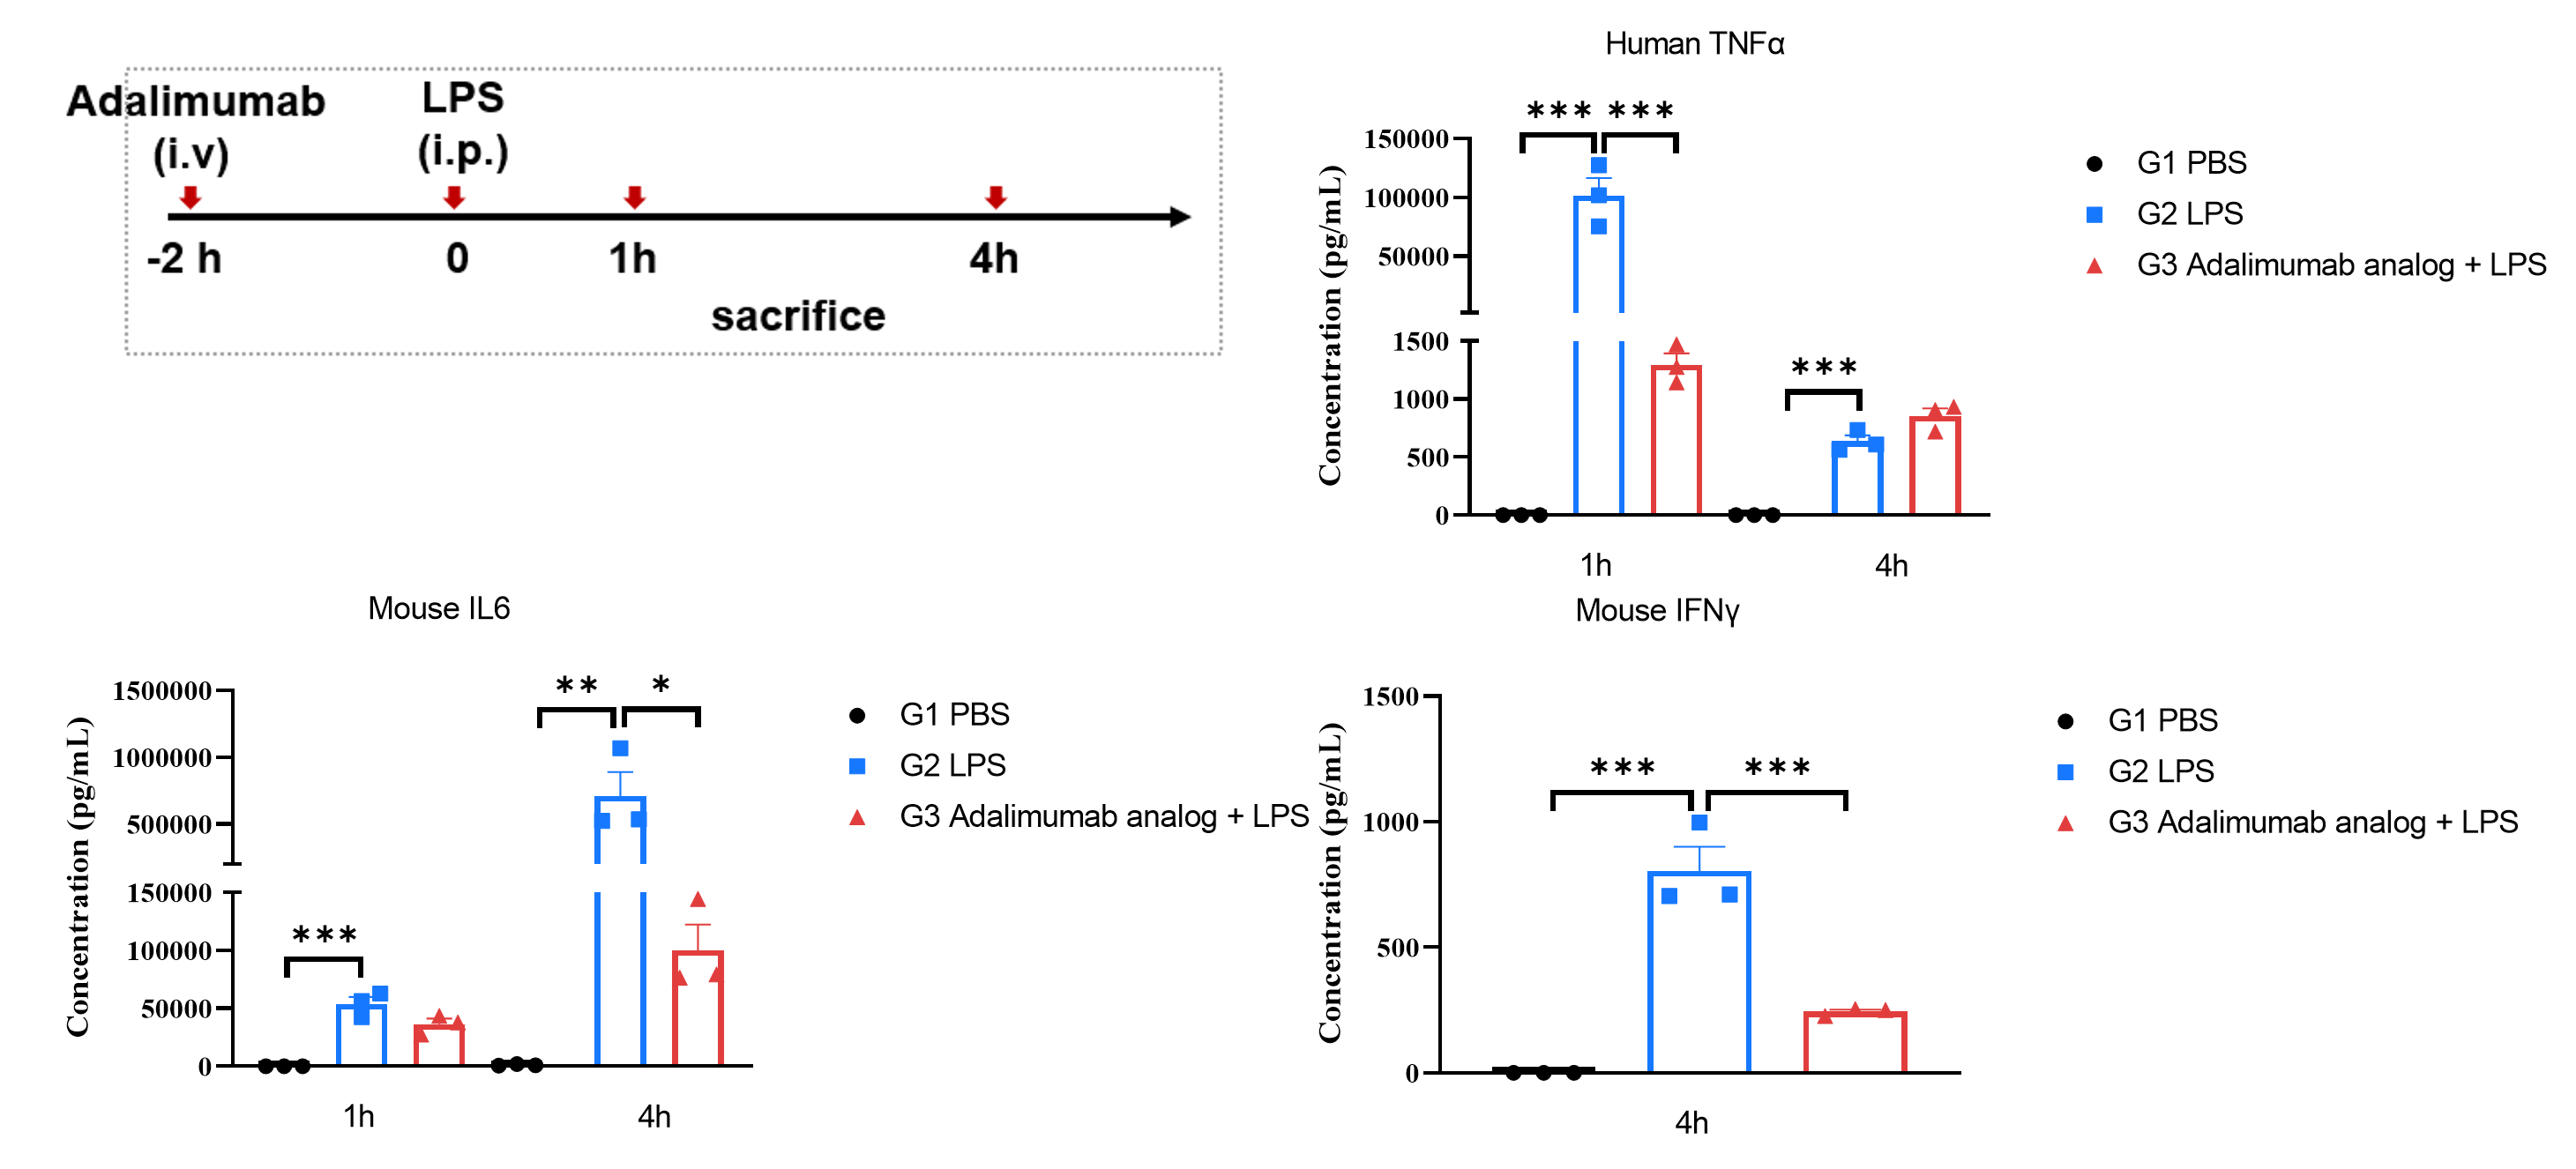
Human TNFA, mouse IL6, and mouse IFNγ expression analysis in homozygous humanized B-hTNFA/hTNFR2/hTNFR1 mice by ELISA. Mice received LPS injection (i.p.) two hours following PBS or adalimumab analog (i.v., in house) treatment. Serum was collected from homozygous B-hTNFA/hTNFR2/hTNFR1 mice one hour and four hours after LPS injection. Expression level of human TNFA, mouse IL6, and mouse IFNγ, were analyzed by ELISA (ELISA MAX™ Deluxe Set Human TNF-α, Biolegend, 430204; ELISA MAX™ Deluxe Set Mouse IL-6, Biolegend, 430304; ELISA MAX™ Deluxe Set Mouse IFN-γ, Biolegend, 430804). Human TNFA level was significantly increased one hour and four hours after LPS injection. Mouse IL6 level was significantly increased one hour and four hours after LPS injection. Mouse IFNγ level was significantly increased four hours after LPS injection. Pre-treatment of adalimumab analog significantly decreased human TNFA expression at one hour after LPS injection. Pre-treatment of adalimumab analog significantly decreased mouse IL6 and mouse IFNγ expression at four hours after LPS injection, indicating a successful inhibition of the downstream activation caused by hTNFA. Values are expressed as mean ± SEM. Significance was determined by one-way ANOVA test . *p < 0.05, **p < 0.01, ***p < 0.001.
In Vivo Efficacy of Anti-Human TNFR2 Antibody in a Tumor Model
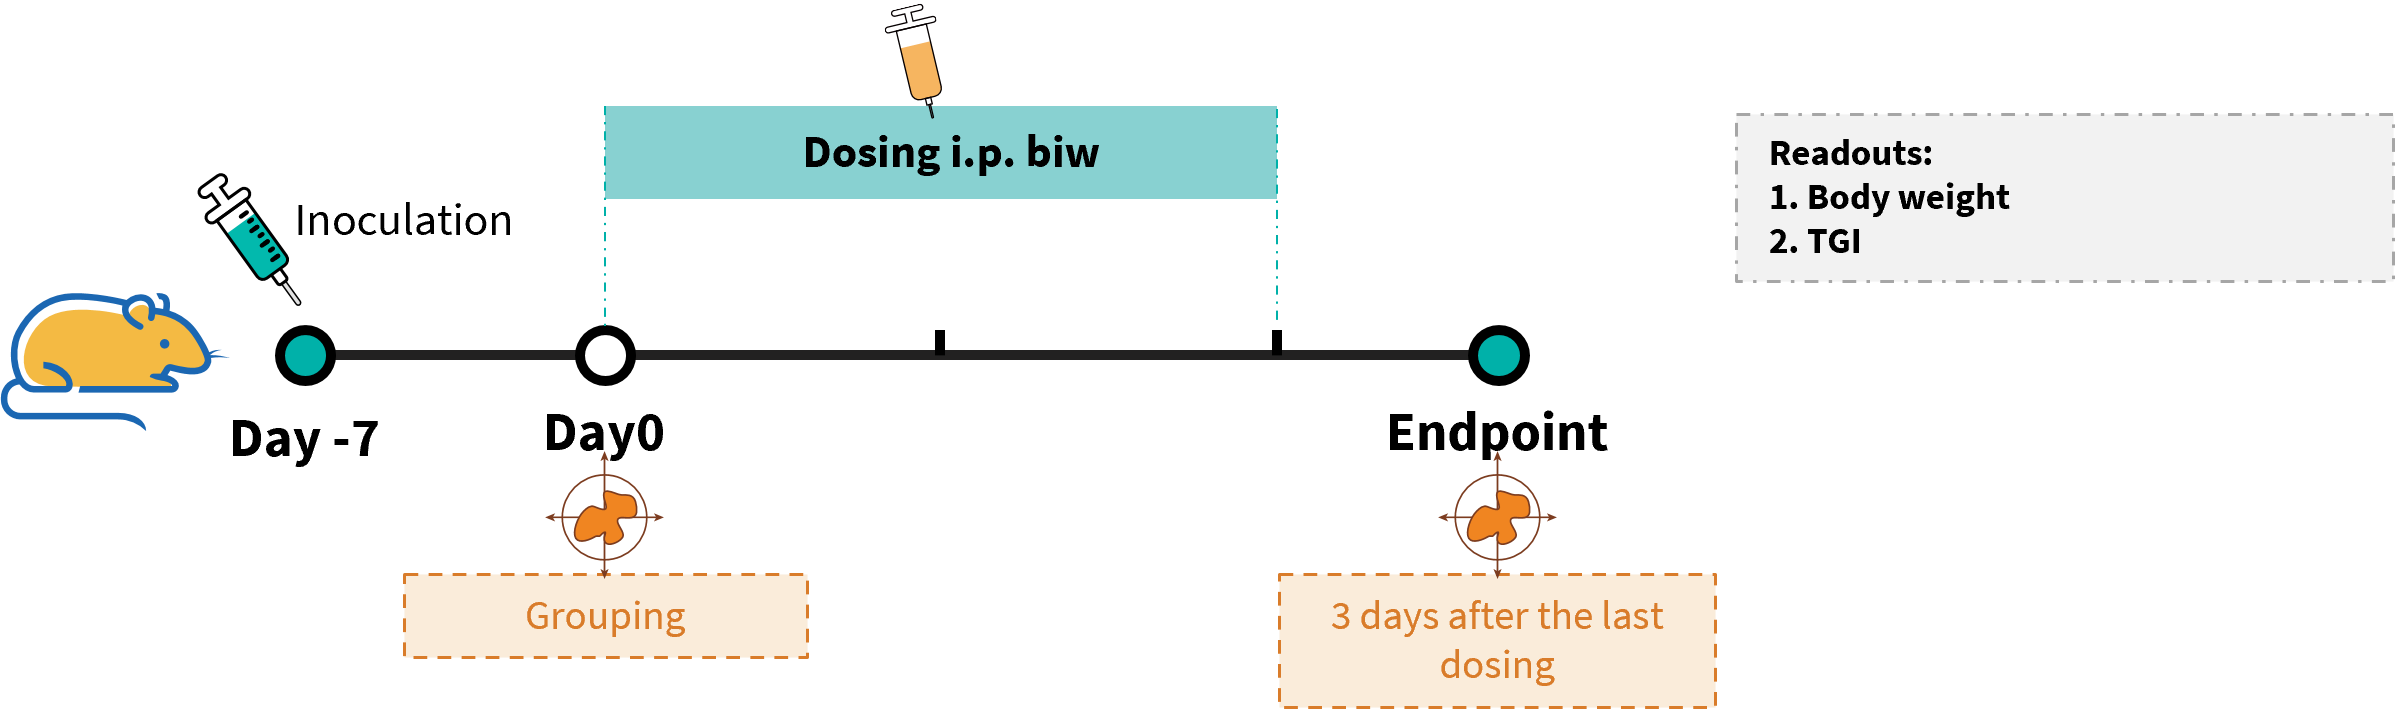
Establishment of a MC38 model and in vivo efficacy study of an anti-human TNFR2-specific antibody. MC38 cells were implanted subcutaneously into homozygous B-hTNFA/hTNFR2/hTNFR1 mice (female, 7 weeks old, n = 6). When the average tumor volume reached approximately 110 mm³, mice were randomized and subsequently administered the anti-human TNFR2 antibody via intraperitoneal injection.
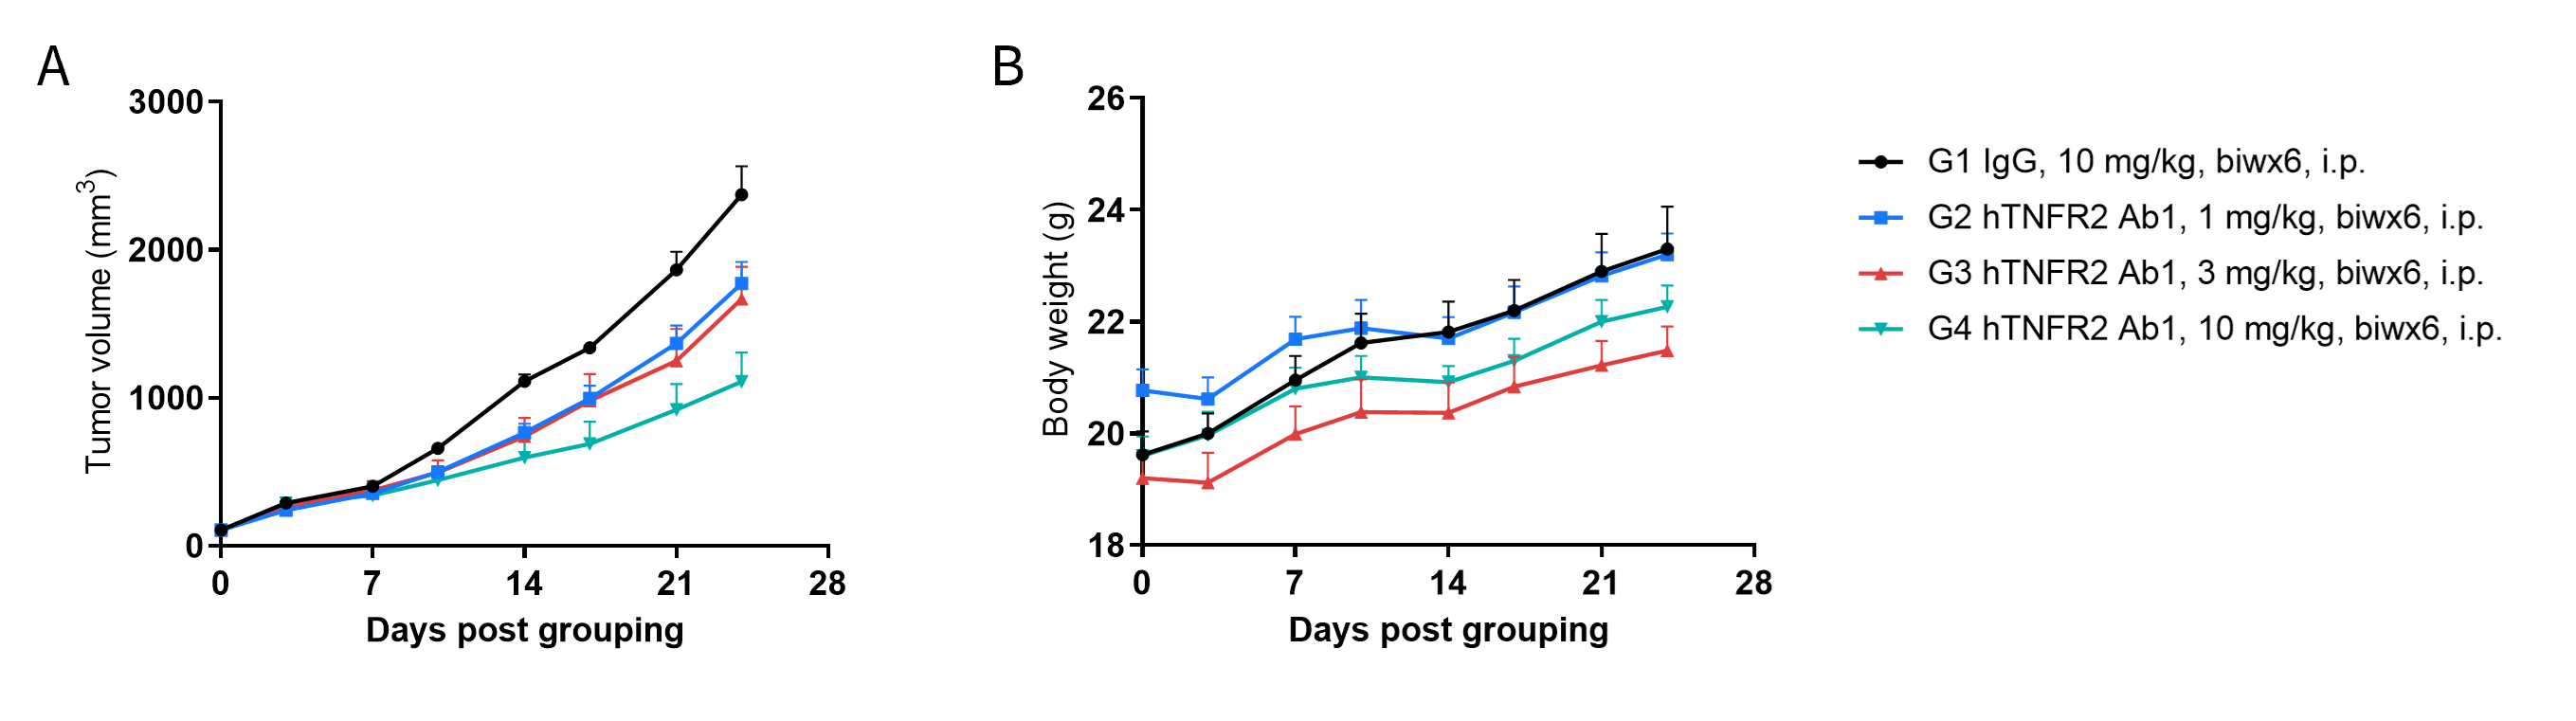
- Anti-human TNFR2 antibody treatment inhibited tumor growth compared with untreated controls.
Antitumor activity of anti-human TNFR2 antibodies in B-hTNFA/hTNFR2/hTNFR1 mice.(A) Anti-human TNFR2 antibodies inhibited MC38 tumor growth in B-hTNFA/hTNFR2/hTNFR1 mice. Murine colon cancer MC38 cells were subcutaneously implanted into homozygous B-hTNFA/hTNFR2/hTNFR1 mice (female, 8 week-old, n=6). Mice were grouped according to body weight differences, at which time they were treated with anti-TNFR2 Ab1 provided by the client with doses and schedules indicated in panel A. (B) Body weight changes during treatment. As shown in panel A, anti-human TNFR2 antibodies were efficacious in controlling tumor growth in B-hTNFA/hTNFR2/hTNFR1 mice in a dose-dependent manner, demonstrating that the B-hTNFA/hTNFR2/hTNFR1 mice provide a powerful preclinical model for in vivo evaluation of anti-human TNFR2 antibody. Values are expressed as mean ± SEM.
Establishment of Collagen-induced Arthritis Model
- Arthritis model was successfully induced in B-hTNFA/hTNFR2/hTNFR1 mice and C57BL/6 mice using collagen.
The arthritis model was induced in B-hTNFA/hTNFR2/hTNFR1 mice and C57BL/6 mice using collagen (CII). (A) mouse body weight change; (B) clinical score. The results showed that the clinical score of B-hTNFA/hTNFR2/hTNFR1 mice was significantly increased, suggesting that the arthritis model was successfully established.
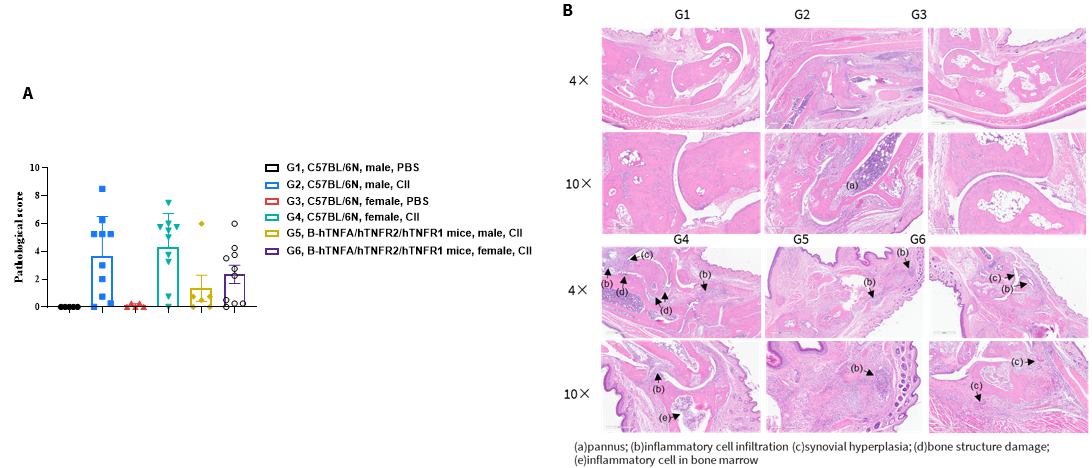
Pathological analysis after the establishment of arthritis in B-hTNFA/hTNFR2/hTNFR1 mice and C57BL/6 mice. (A) Pathological score; (B) H&E staining of pathological sections. In the model group, subcutaneous mixed inflammatory cell infiltration, periarticular stenosis, articular cartilage and bone tissue destruction and other arthritic lesions were observed in all or part of the limb joints, suggesting that the arthritis model was successfully established.
In Vivo Efficacy of Anti–Human TNFA Antibody in Collagen-induced Arthritis
- Adalimumab analog significantly reduced clinical score compared with controls.

Efficacy of anti-human TNFA antibody in B-hTNFA/hTNFR2/hTNFR1 mice with collagen induced arthritis (CIA) model. Arthritis was induced by the subcutaneous injection of CII emulsion into B-hTNFA/hTNFR2/hTNFR1 mice on Day 0 and Day 21 (female, n=9-10 in each group). The development of arthritis was monitored and the arthritis score was evaluated every day. The mice were divided into groups at the moment of inflammation onset (defined as day 0, Clinical score >1 or the continuous score =1). The treatment group was intraperitoneally injected with different doses of anti-human TNFA antibody adalimumab analog (in house). Body weight change(A) and clinical score (B) were evaluated daily during treatment. Mice were euthanized at 2 days after the last treatment, and the paws were removed. Joint pathology was evaluated on decalcified H&E-stained sections. There was no significant change in body weight, while total clinical score increased in the groups except control during treatment. It indicated that the arthritis model was successfully established. Dose-dependent reduction in clinical score in the adalimumab analog (in house) treatment groups. The results indicated the B-hTNFA/hTNFR2/hTNFR1 mice provide a powerful preclinical CIA mouse model for in vivo evaluation of anti-human TNFA antibody.
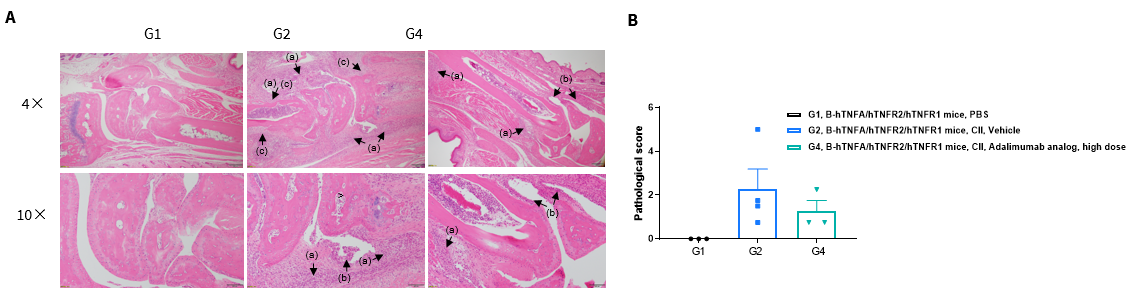
Efficacy of anti-human TNFA antibody in B-hTNFA/hTNFR2/hTNFR1 mice with collagen induced arthritis (CIA) model. Histopathological examination was performed on the joints of the extremities at endpoint.(A) H&E staining of pathological sections. Inflammatory cell infiltration (a), synovial hyperplasia (b) and bone structure damage(c). (B) Pathological score. The pathological score of G2 group was higher than that of G1 group, indicating successful modeling. The pathological score of G2 group was higher than that of G4 group, indicating that drugs had a therapeutic effect. The results indicated B-hTNFA/hTNFR2/hTNFR1 mice provide a powerful preclinical CIA mouse model for in vivo evaluation of anti-human TNFA antibody.
* When publishing results obtained using this animal model, please acknowledge the source as follows: The animal model [B-hTNFA/hTNFR2/hTNFR1 mice] (Cat# 131706) was purchased from Biocytogen.