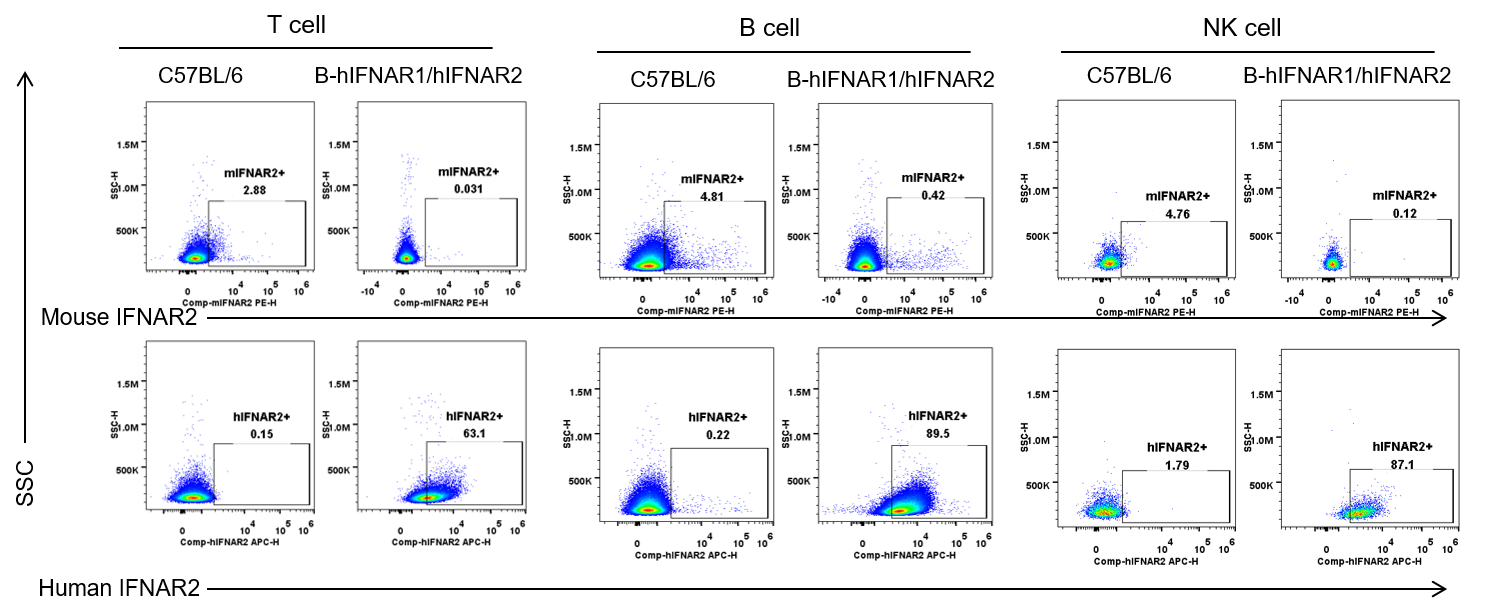
Protein expression analysis
Human IFNAR2 expression analysis in wild-type C57BL/6 and B-hIFNAR1/hIFNAR2 mice by flow cytometry. Splenocytes were collected from wild-type C57BL/6 and homozygous B-hIFNAR1/hIFNAR2 mice. Protein expression was analyzed with anti-mouse IFNAR2 antibody (R&D, FAB1083P) and anti-human IFNAR2 antibody (Miltenyi Biotec, 130-099-560) by flow cytometry. Mouse IFNAR2 was detectable exclusively in T cells, B cells, and NK cells of wild-type mice. Human IFNAR2 was detectable in T cells, B cells, and NK cells of B-hIFNAR1/hIFNAR2 mice but not in wild-type mice.
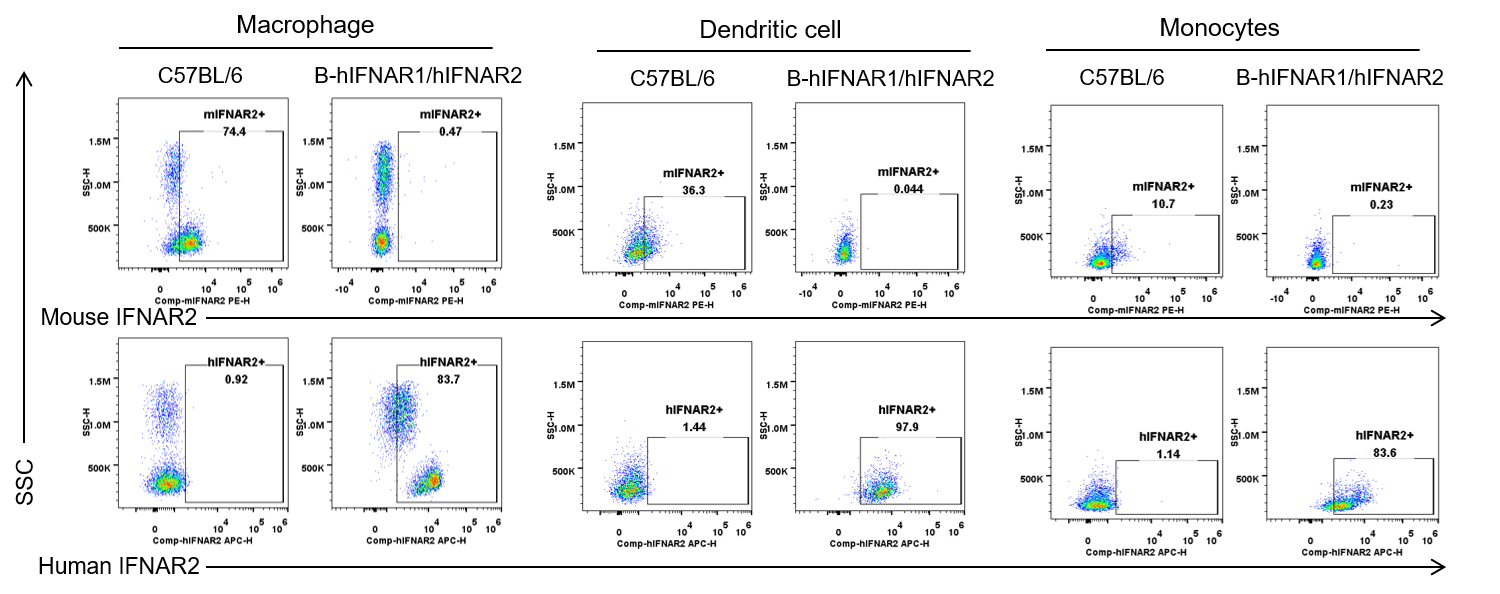
Human IFNAR2 expression analysis in wild-type C57BL/6 and B-hIFNAR1/hIFNAR2 mice by flow cytometry. Splenocytes were collected from wild-type C57BL/6 and homozygous B-hIFNAR1/hIFNAR2 mice. Protein expression was analyzed with anti-mouse IFNAR2 antibody (R&D, FAB1083P) and anti-human IFNAR2 antibody (Miltenyi Biotec, 130-099-560) by flow cytometry. Mouse IFNAR2 was detectable exclusively in macrophages, monocytes, and dendritic cell of wild-type mice. Human IFNAR2 was detectable in macrophages, monocytes, and dendritic cell of B-hIFNAR1/hIFNAR2 mice but not in wild-type mice.
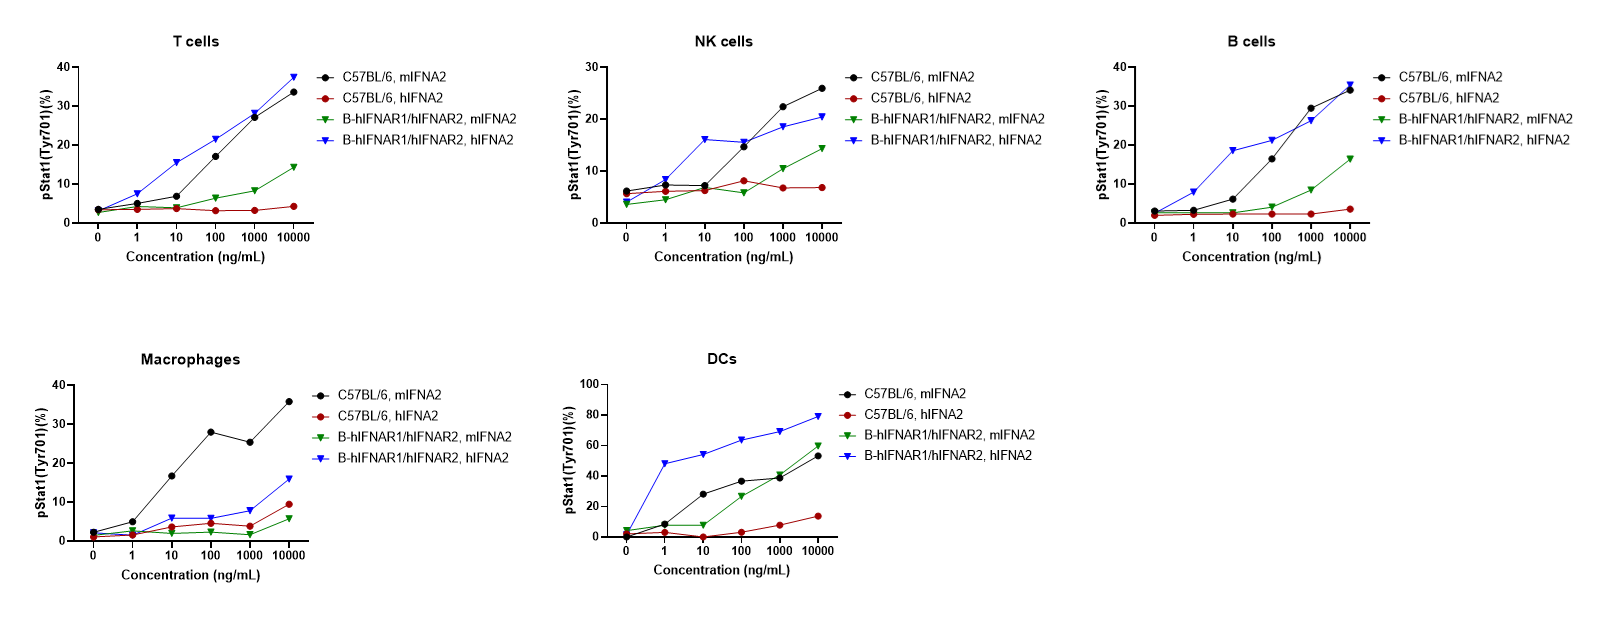
IFNA2 induced the phosphorylation of Stat1 in splenocytes
Analysis of the phosphorylation of stat1 in B-hIFNAR1/hIFNAR2 mice by flow cytometry. Splenocytes from wild-type C57BL/6 mice and homozygous B-hIFNAR1/hIFNAR2 mice were stimulated with mouse IFNA2 or human IFNA2 in vitro. Then FACS was performed to assay the phosphorylation of stat1. Mouse IFNA2 induced the pStat1 expression in wild-type mice in a dose-dependent manner. Human IFNA2 only induced the pStat1 expression in B-hIFNAR1/hIFNAR2 mice.
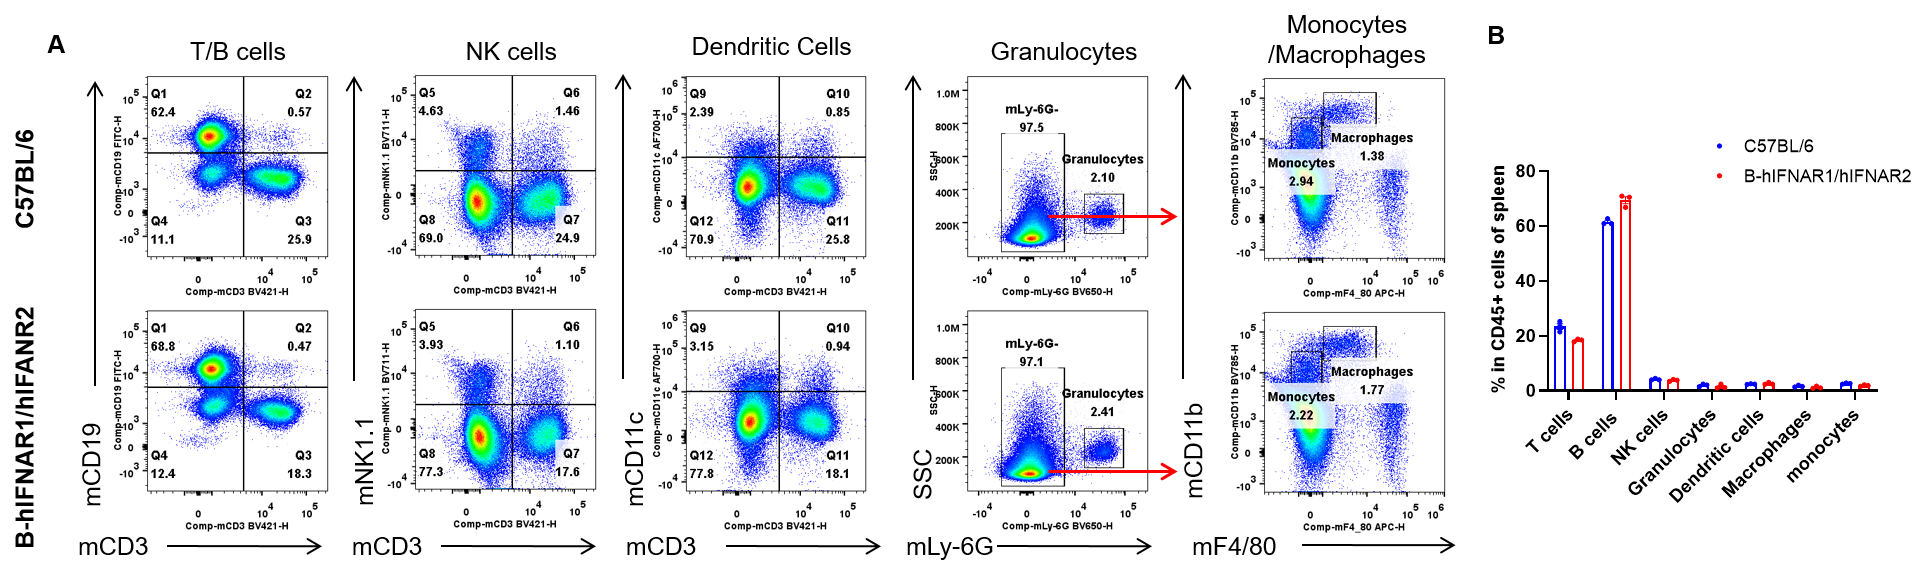
Analysis of leukocytes cell subpopulation in spleen
Analysis of spleen leukocyte subpopulations by flow cytometry. Splenocytes were isolated from C57BL/6 and B-hIFNAR1/hIFNAR2 mice (n=3, 7-week-old). Flow cytometry analysis of the splenocytes was performed to assess leukocyte subpopulations. A. Representative FACS plots. Single live cells were gated for the CD45+ population and used for further analysis as indicated here. B. Results of FACS analysis. Percent of T cells, B cells, NK cells, dendritic cells, granulocytes, monocytes and macrophages in homozygous B-hIFNAR1/hIFNAR2 mice were similar to those in the C57BL/6 mice. Values are expressed as mean ± SEM.
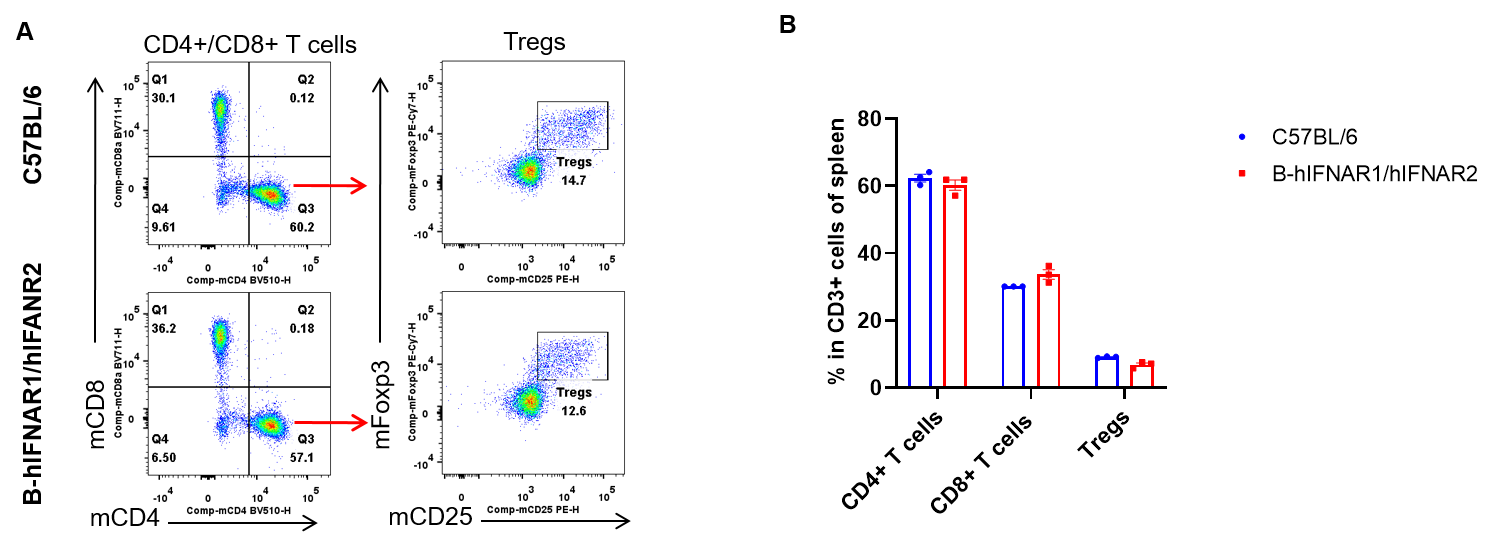
Analysis of T cell subpopulation in spleen
Analysis of spleen T cell subpopulations by flow cytometry. Splenocytes were isolated from C57BL/6 and B-hIFNAR1/hIFNAR2 mice (n=3, 7-week-old). Flow cytometry analysis of the splenocytes was performed to assess leukocyte subpopulations. A. Representative FACS plots. Single live CD45+ cells were gated for CD3+ T cell population and used for further analysis as indicated here. B. Results of FACS analysis. The percent of CD8+ T cells, CD4+ T cells and Tregs in homozygous B-hIFNAR1/hIFNAR2 mice were similar to those in the C57BL/6 mice. Values are expressed as mean ± SEM.
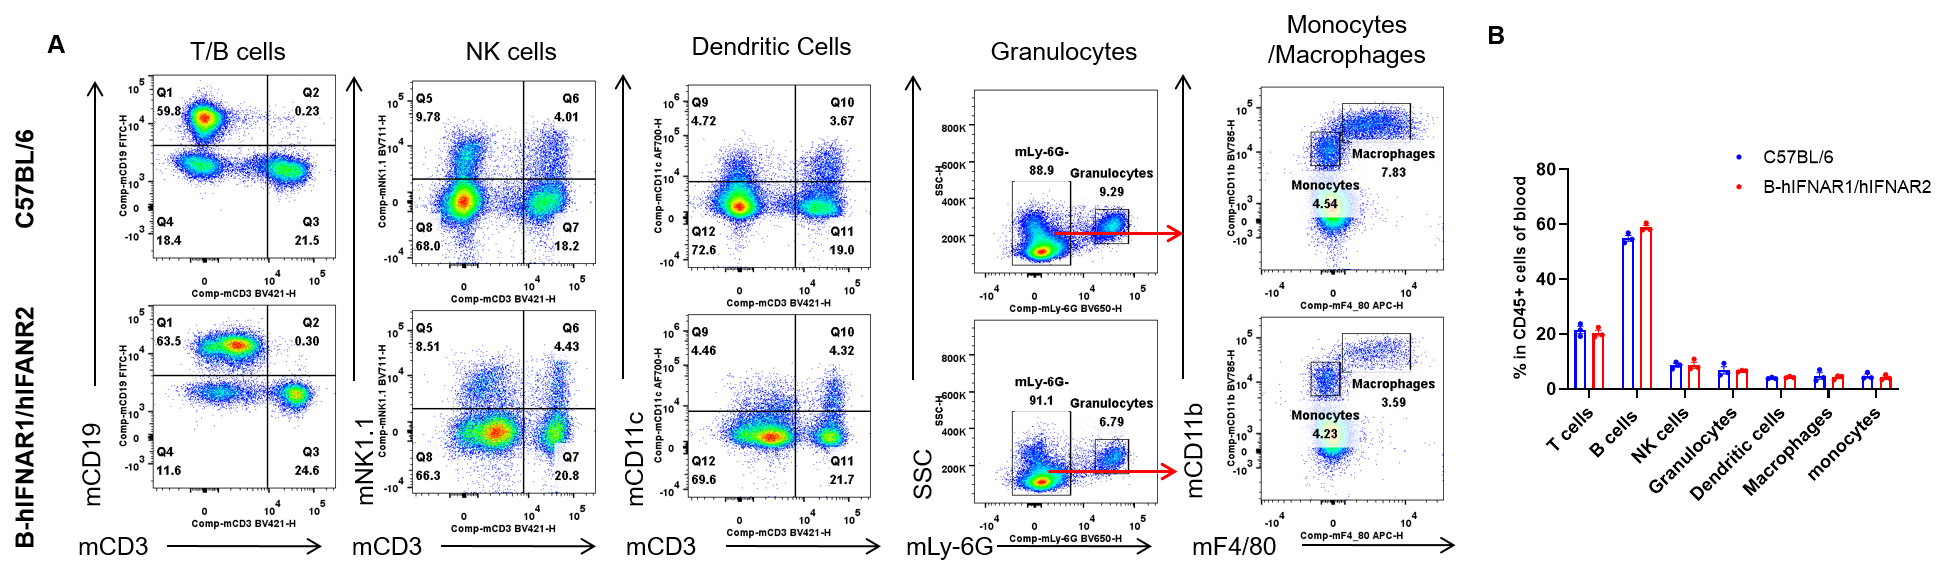
Analysis of leukocytes cell subpopulation in blood
Analysis of blood leukocyte subpopulations by flow cytometry. Blood were isolated from C57BL/6 and B-hIFNAR1/hIFNAR2 mice (n=3, 7-week-old). Flow cytometry analysis of the blood was performed to assess leukocyte subpopulations. A. Representative FACS plots. Single live cells were gated for the CD45+ population and used for further analysis as indicated here. B. Results of FACS analysis. Percent of T cells, B cells, NK cells, dendritic cells, granulocytes, monocytes and macrophages in homozygous B-hIFNAR1/hIFNAR2 mice were similar to those in the C57BL/6 mice. Values are expressed as mean ± SEM.
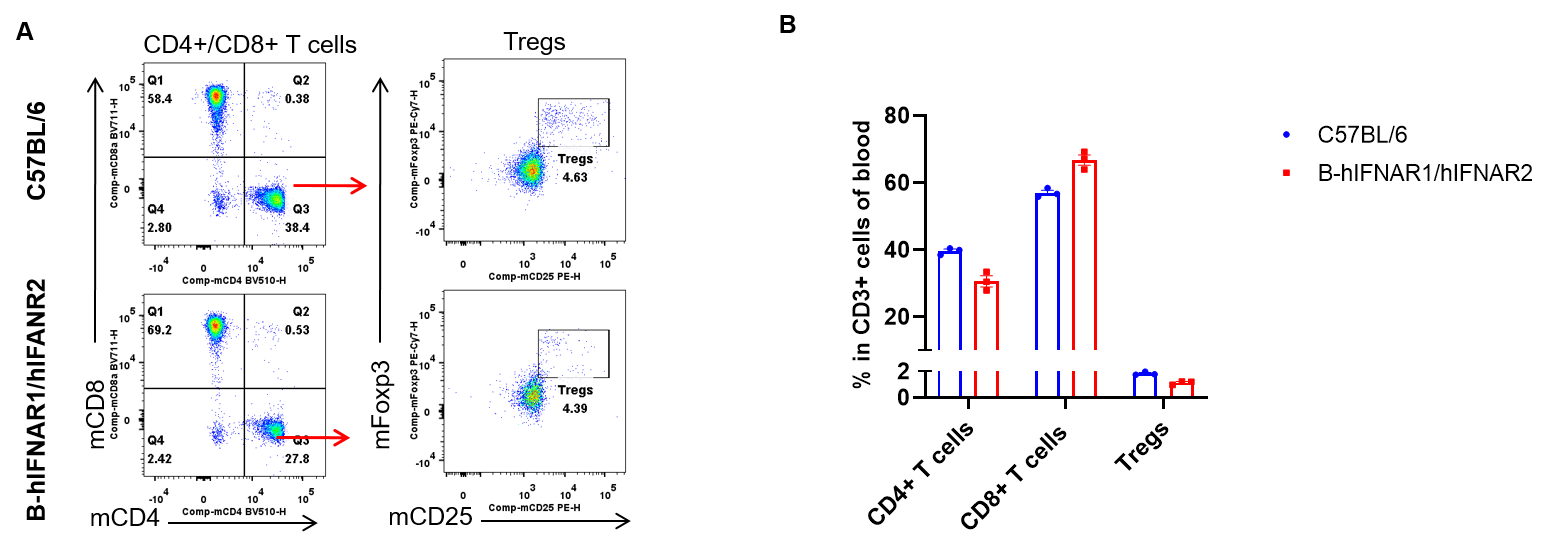
Analysis of T cell subpopulation in blood
Analysis of blood T cell subpopulations by flow cytometry. Blood were isolated from C57BL/6 and B-hIFNAR1/hIFNAR2 mice (n=3, 7-week-old). Flow cytometry analysis of the blood was performed to assess leukocyte subpopulations. A. Representative FACS plots. Single live CD45+ cells were gated for CD3+ T cell population and used for further analysis as indicated here. B. Results of FACS analysis. The percent of CD8+ T cells, CD4+ T cells and Tregs in homozygous B-hIFNAR1/hIFNAR2 mice were similar to those in the C57BL/6 mice. Values are expressed as mean ± SEM..
* When publishing results obtained using this animal model, please acknowledge the source as follows: The animal model [B-hIFNAR1/hIFNAR2 mice] (Cat# 112650) was purchased from Biocytogen.