

C57BL/6-Pdcd1tm3(PDCD1)Bcgen Il2tm1(IL2)Bcgen Il2ratm1(IL2RA)Bcgen ll2rbtm2(IL2RB)Bcgen ll2rgtm2(IL2RG)Bcgen • 113319
on this page

Targeting the PD-1: Biological Roles and Therapeutic Strategies
Targeting the IL2/IL15: Biological Roles and Therapeutic Strategies

PD-1
IL2
IL2RA
IL2RB
IL2RG
IL15
IL15RA


Strain specific IL2 expression analysis in homozygous B-hPD-1 plus/hIL2/hIL2RA/hIL2RB/hIL2RG/hIL15/hIL15RA mice by ELISA. Serum were collected from wild-type mice C57BL/6 mice (+/+) (female, 6-week old, n = 3) and homozygous B-hPD-1 plus/hIL2/hIL2RA/hIL2RB/hIL2RG/hIL15/hIL15RA mice (female, 6-week old, n = 3) stimulated with anti-mCD3e antibody (7.5 μg/mice) and anti-CD28 antibody (4 μg/mice) in vivo for 2 h, and analyzed by ELISA with species-specific anti-mouse IL-2 ELISA kit (Biolegend, 431004), and anti-human IL-2 ELISA kit (Biolegend, 431804).
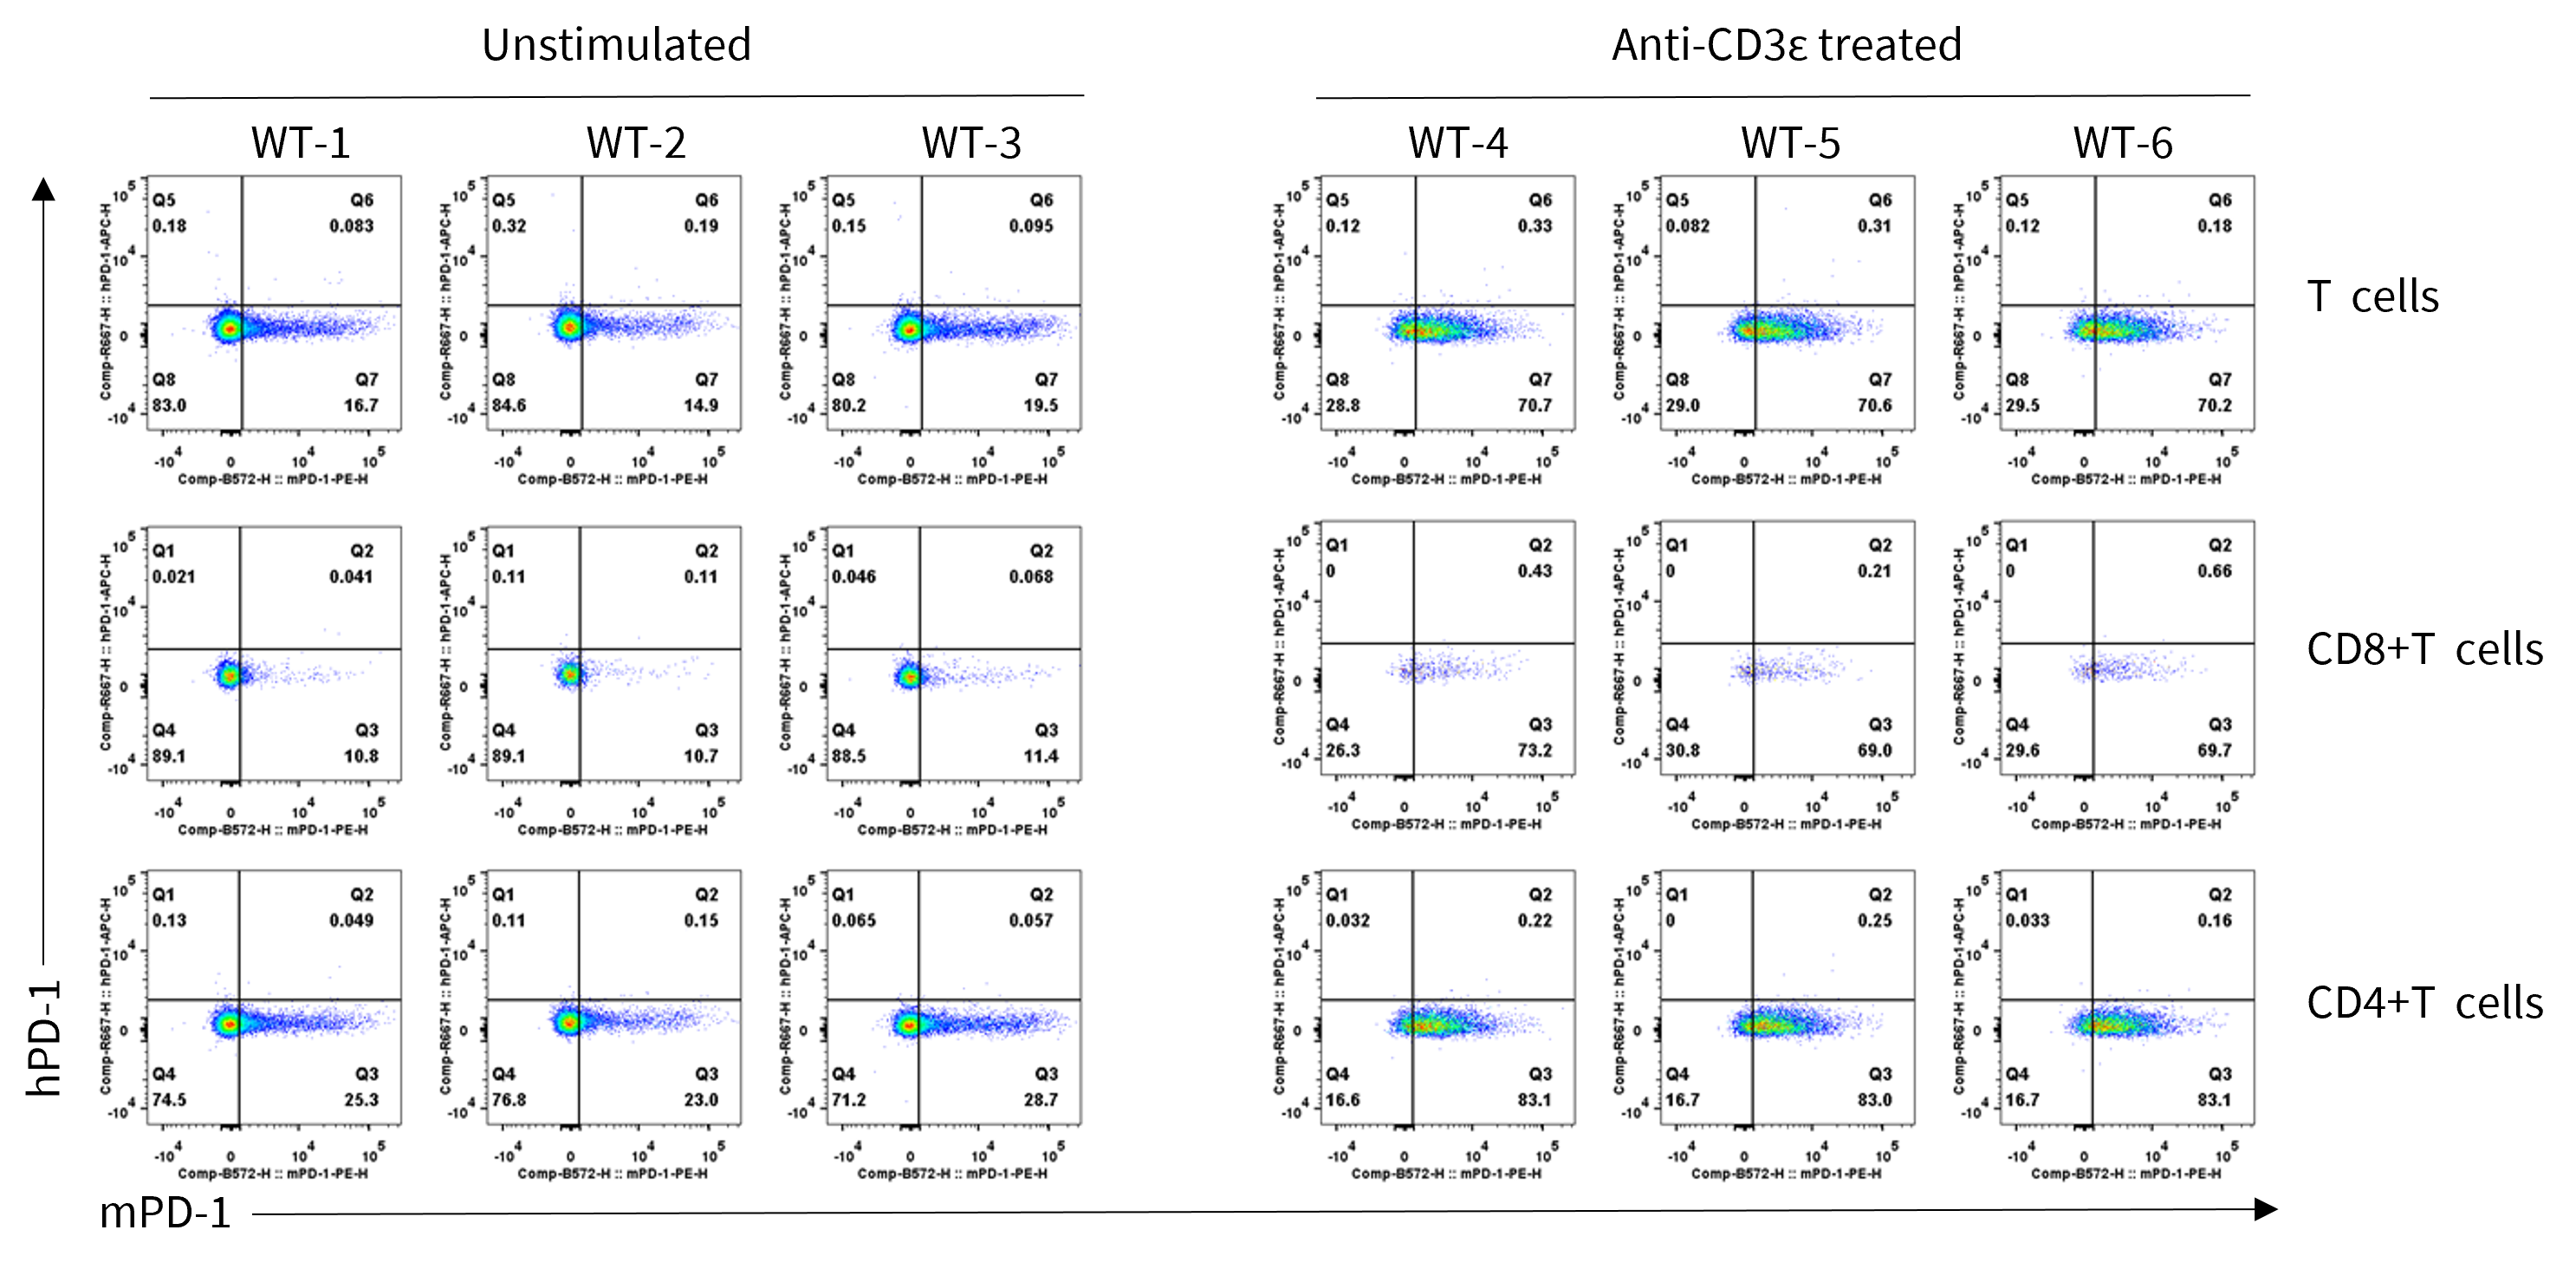
Strain specific PD-1 expression analysis in wild-type C57BL/6JNifdc mice by flow cytometry. Splenocytes were collected from wild-type C57BL/6JNifdc mice (male, 7-week-old, n=3/group) stimulated with or without anti-CD3ε antibody (7.5 μg/mice, i.p.) in vivo for 24 h, and analyzed by flow cytometry with species-specific anti-mouse PD-1 antibody (Biolegend, 109104) and anti-human PD-1 antibody (Biolegend, 329908).
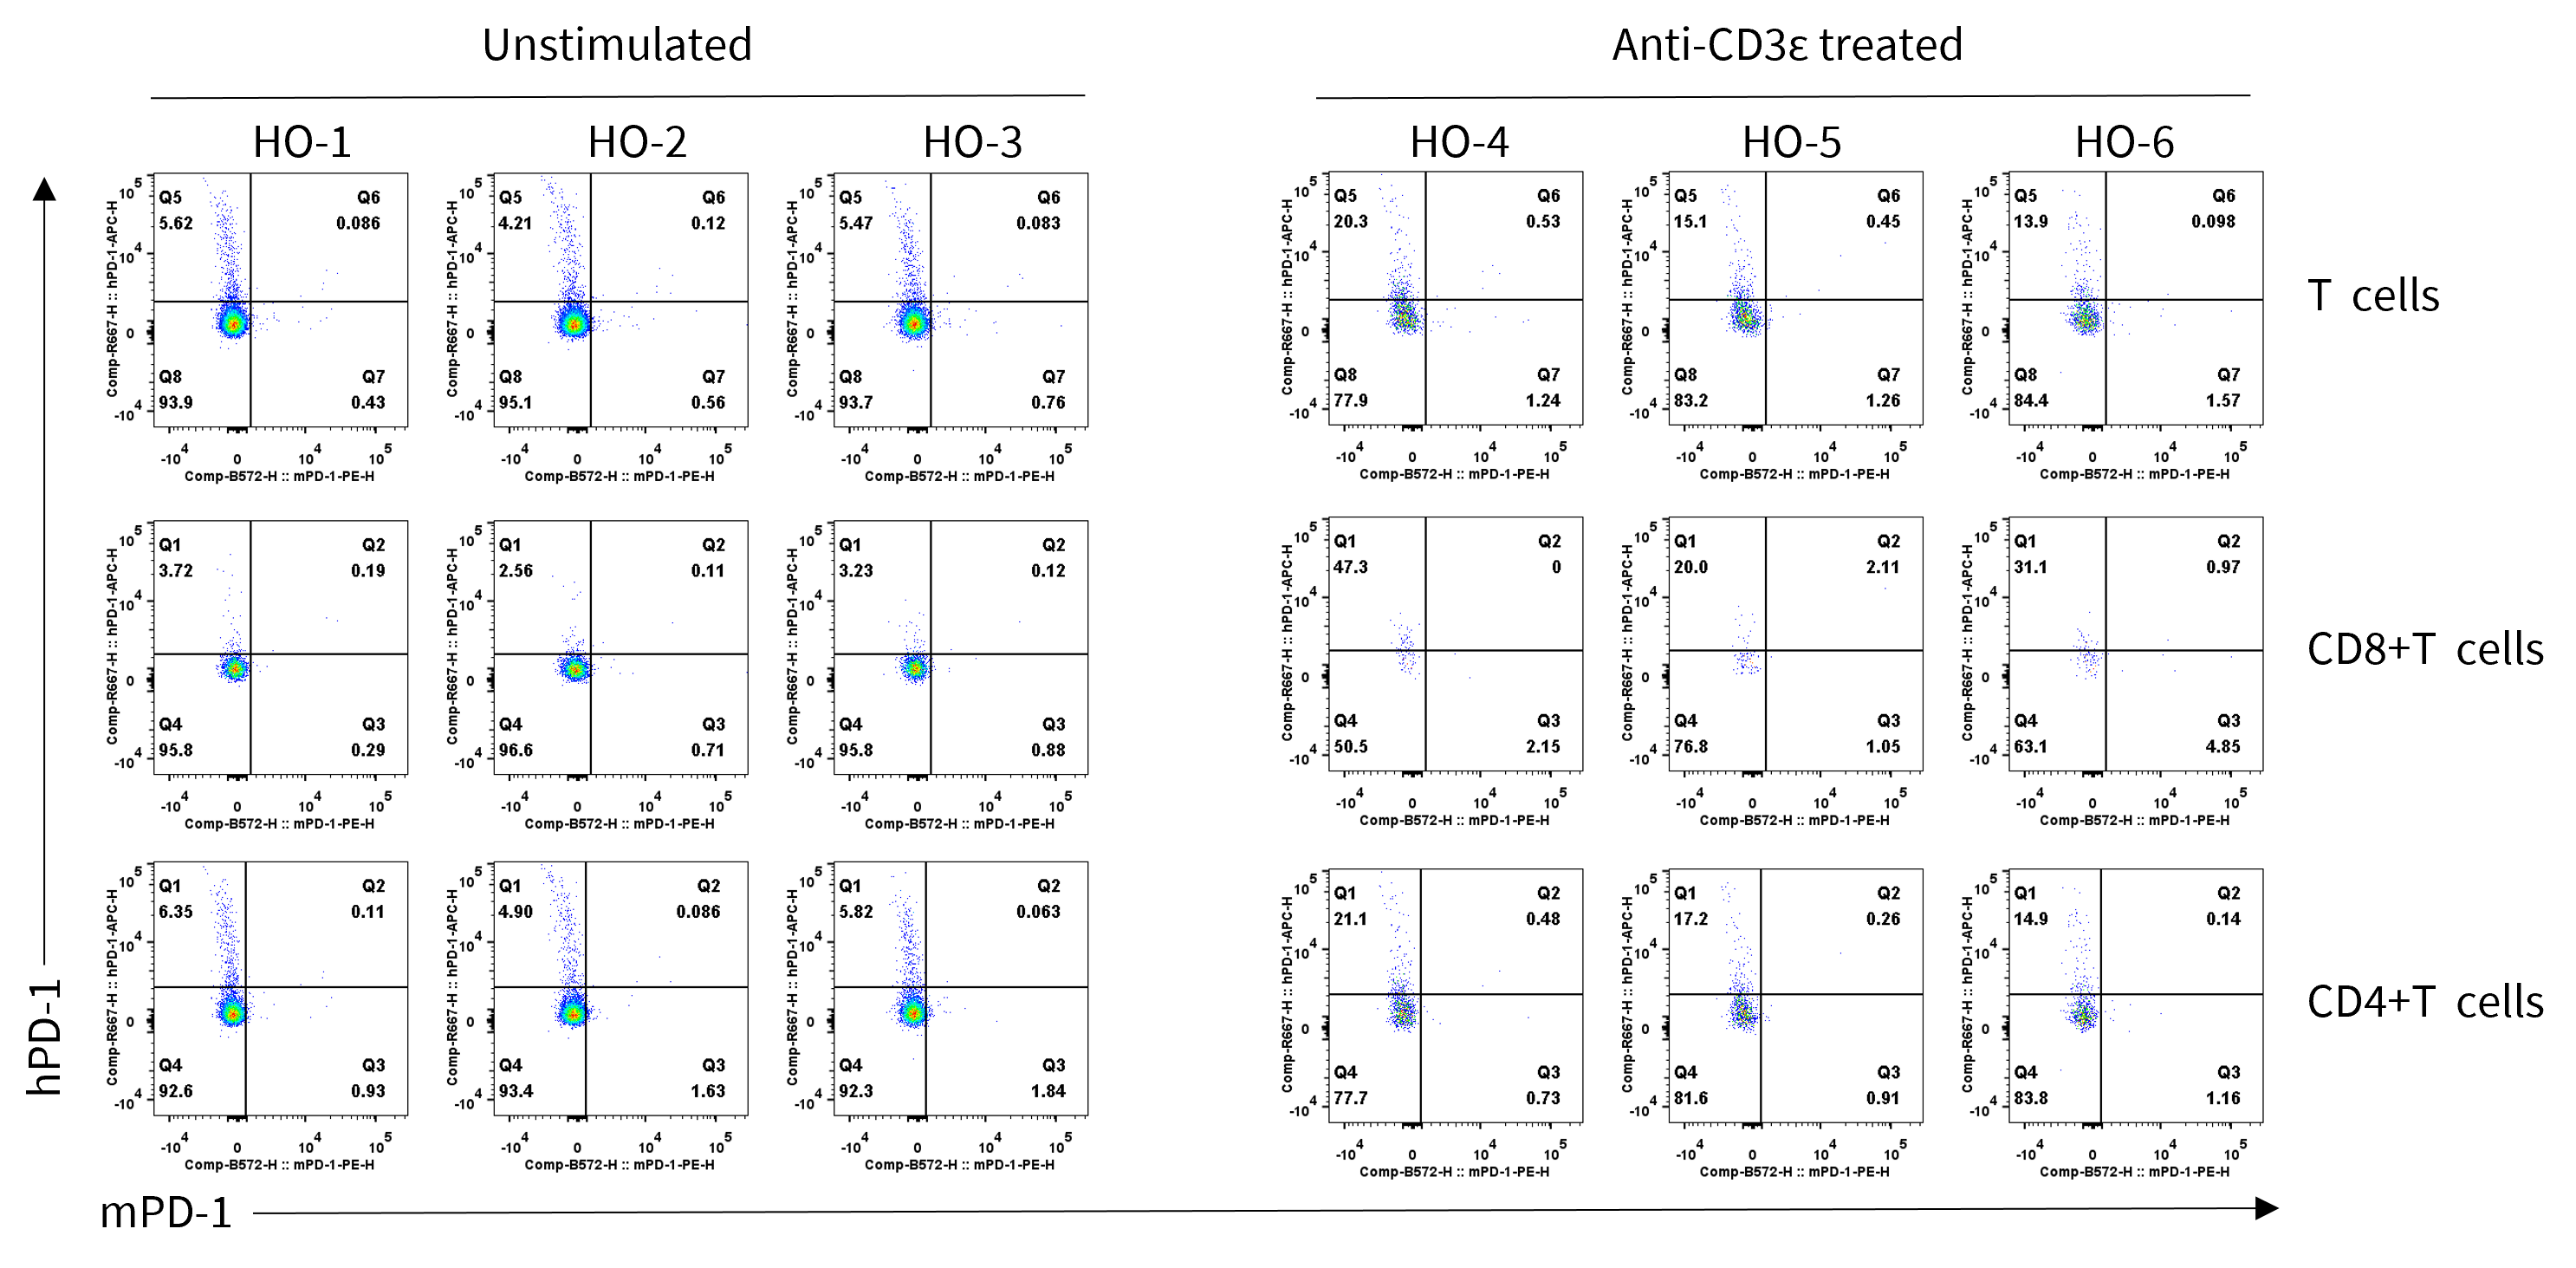
Strain specific PD-1 expression analysis in homozygous B-hPD-1 plus/hIL2RA/hIL2RB/hIL2RG/hIL15/hIL15RA mice by flow cytometry. Splenocytes were collected from homozygous B-hPD-1 plus/hIL2RA/hIL2RB/hIL2RG/hIL15/hIL15RA mice (male, 7-week-old, n = 3/group) stimulated with or without anti-CD3ε antibody (7.5 μg/mice, i.p.) in vivo for 24 h, and analyzed by flow cytometry with species-specific anti-mouse PD-1 antibody (Biolegend, 109104) and anti-human PD-1 antibody (Biolegend, 329908).
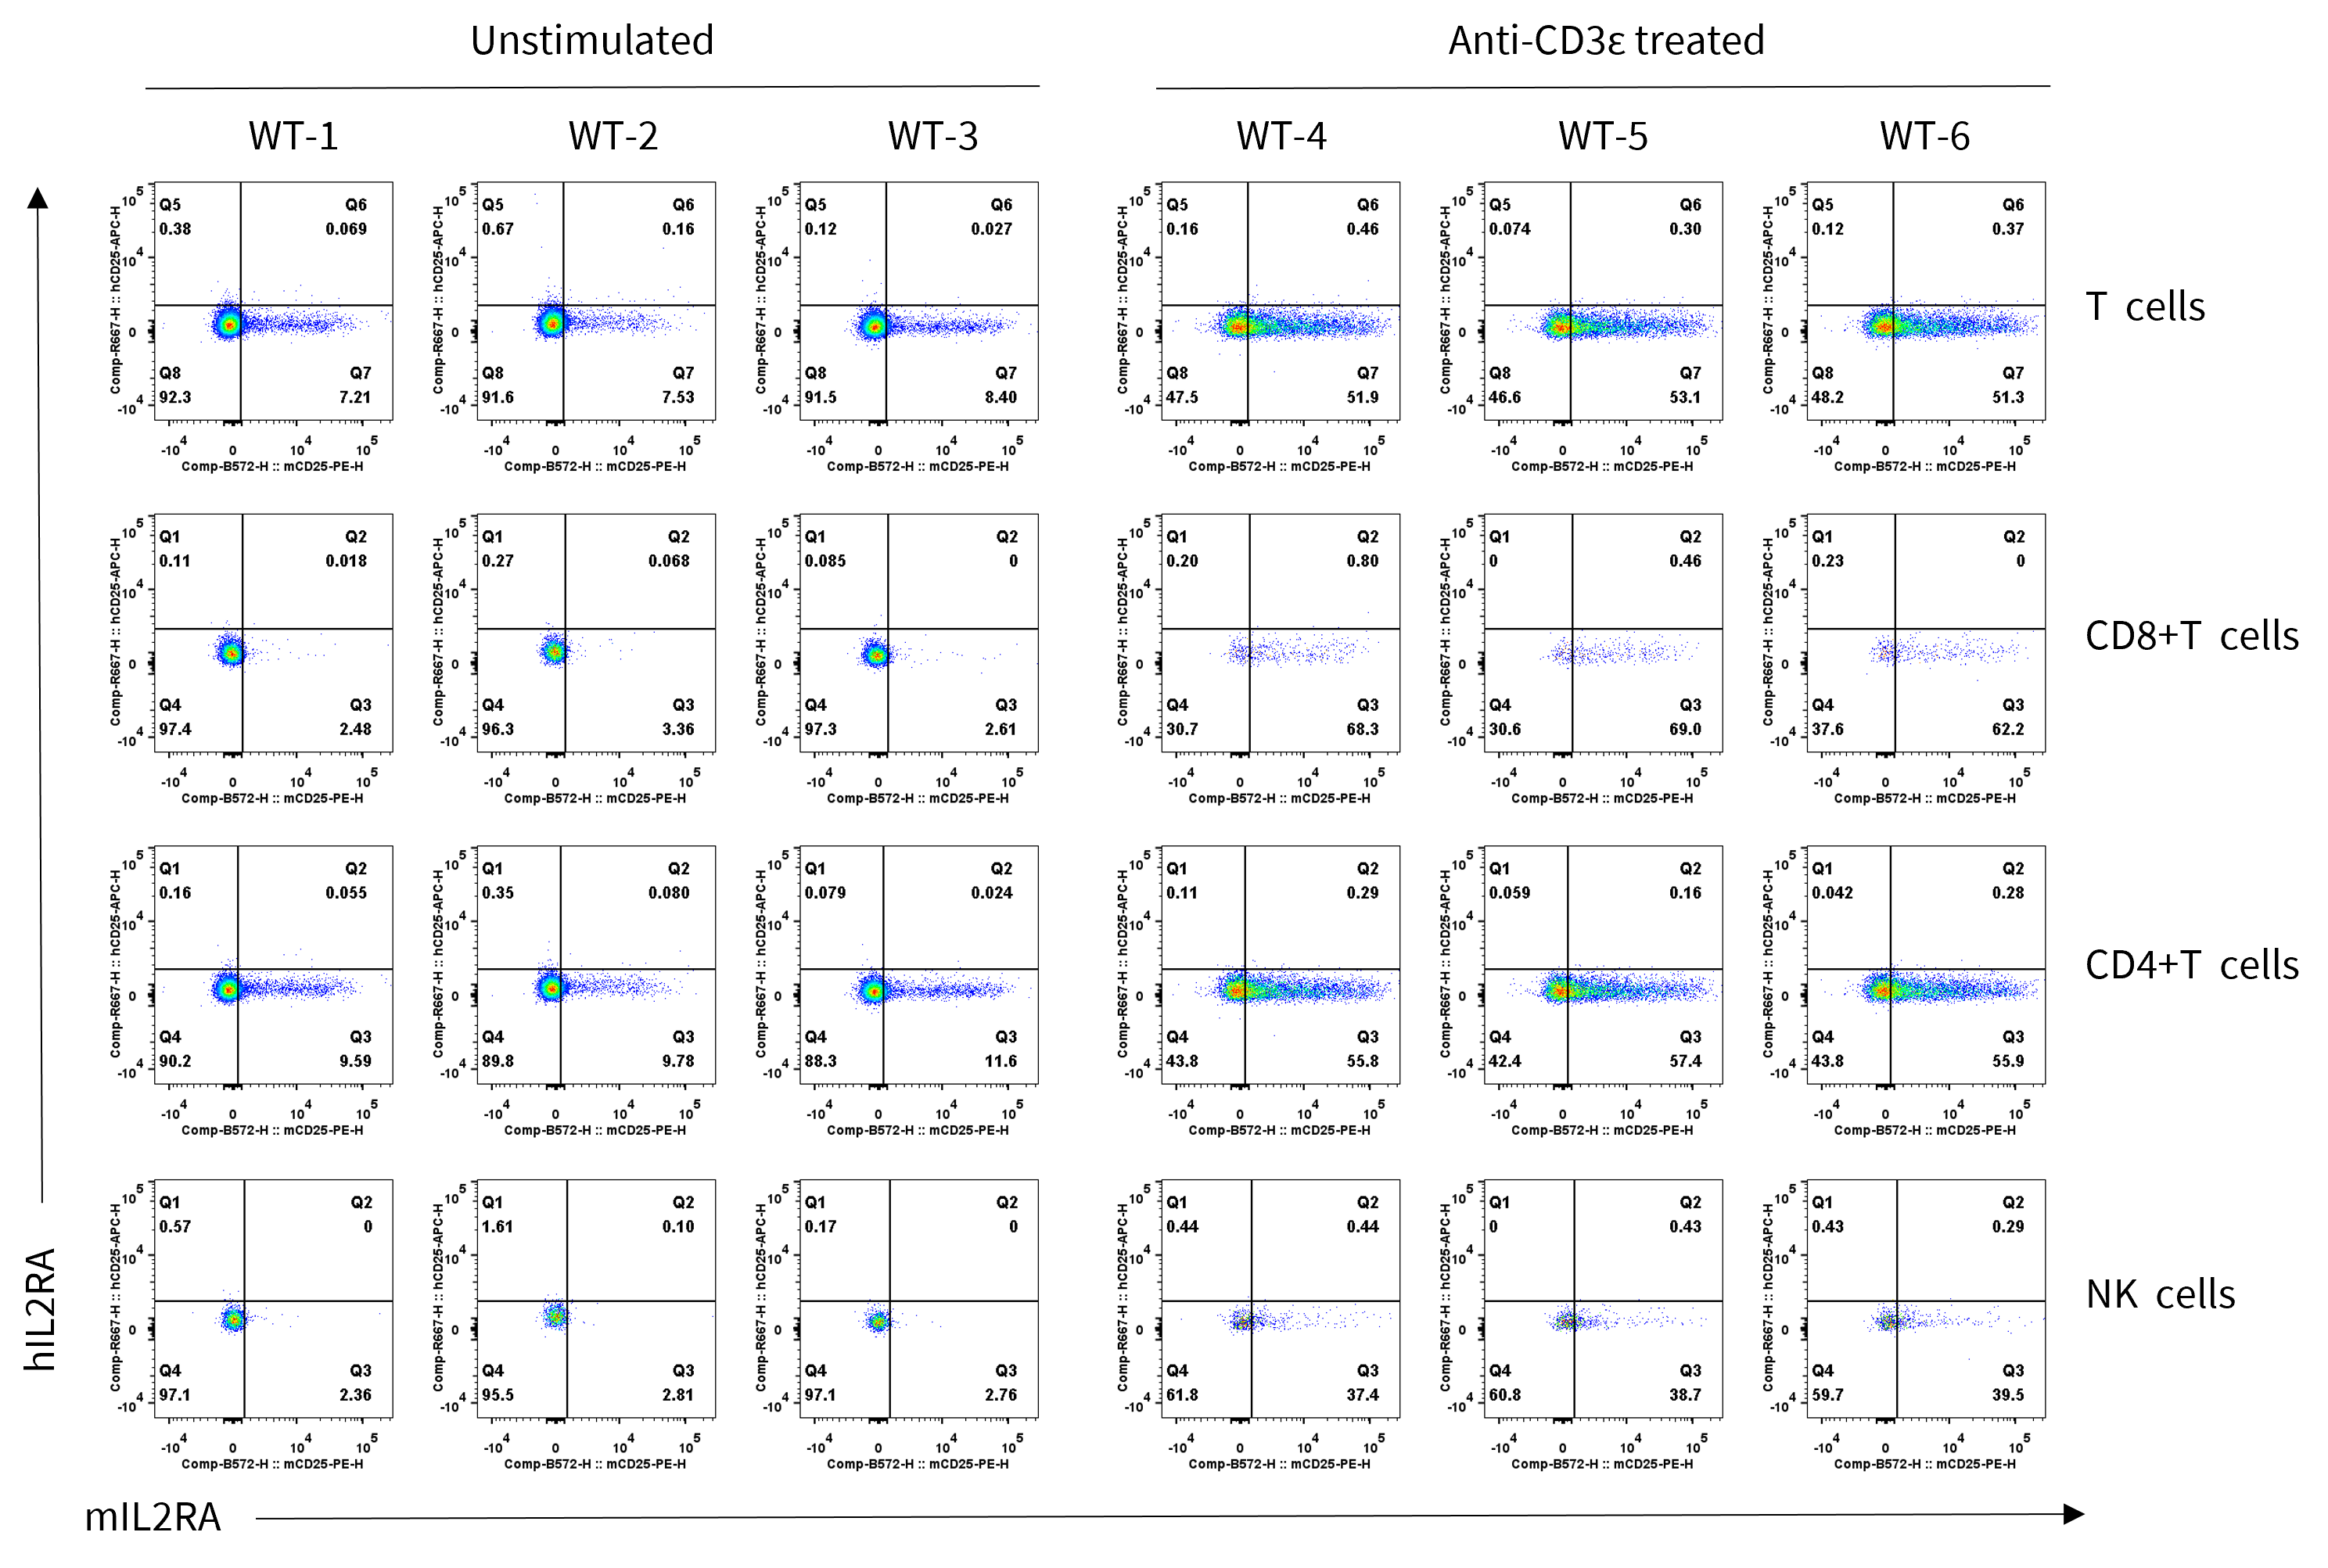
Strain specific IL2RA expression analysis in wild-type C57BL/6JNifdc mice by flow cytometry. Splenocytes were collected from wild-type C57BL/6JNifdc mice (male, 7-week-old, n = 3/group) stimulated with or without anti-CD3ε antibody (7.5 μg/mice, i.p.) in vivo for 24 h, and analyzed by flow cytometry with species-specific anti-mouse IL2RA antibody (Biolegend, 102008) and anti-human IL2RA antibody (Biolegend, 302610).
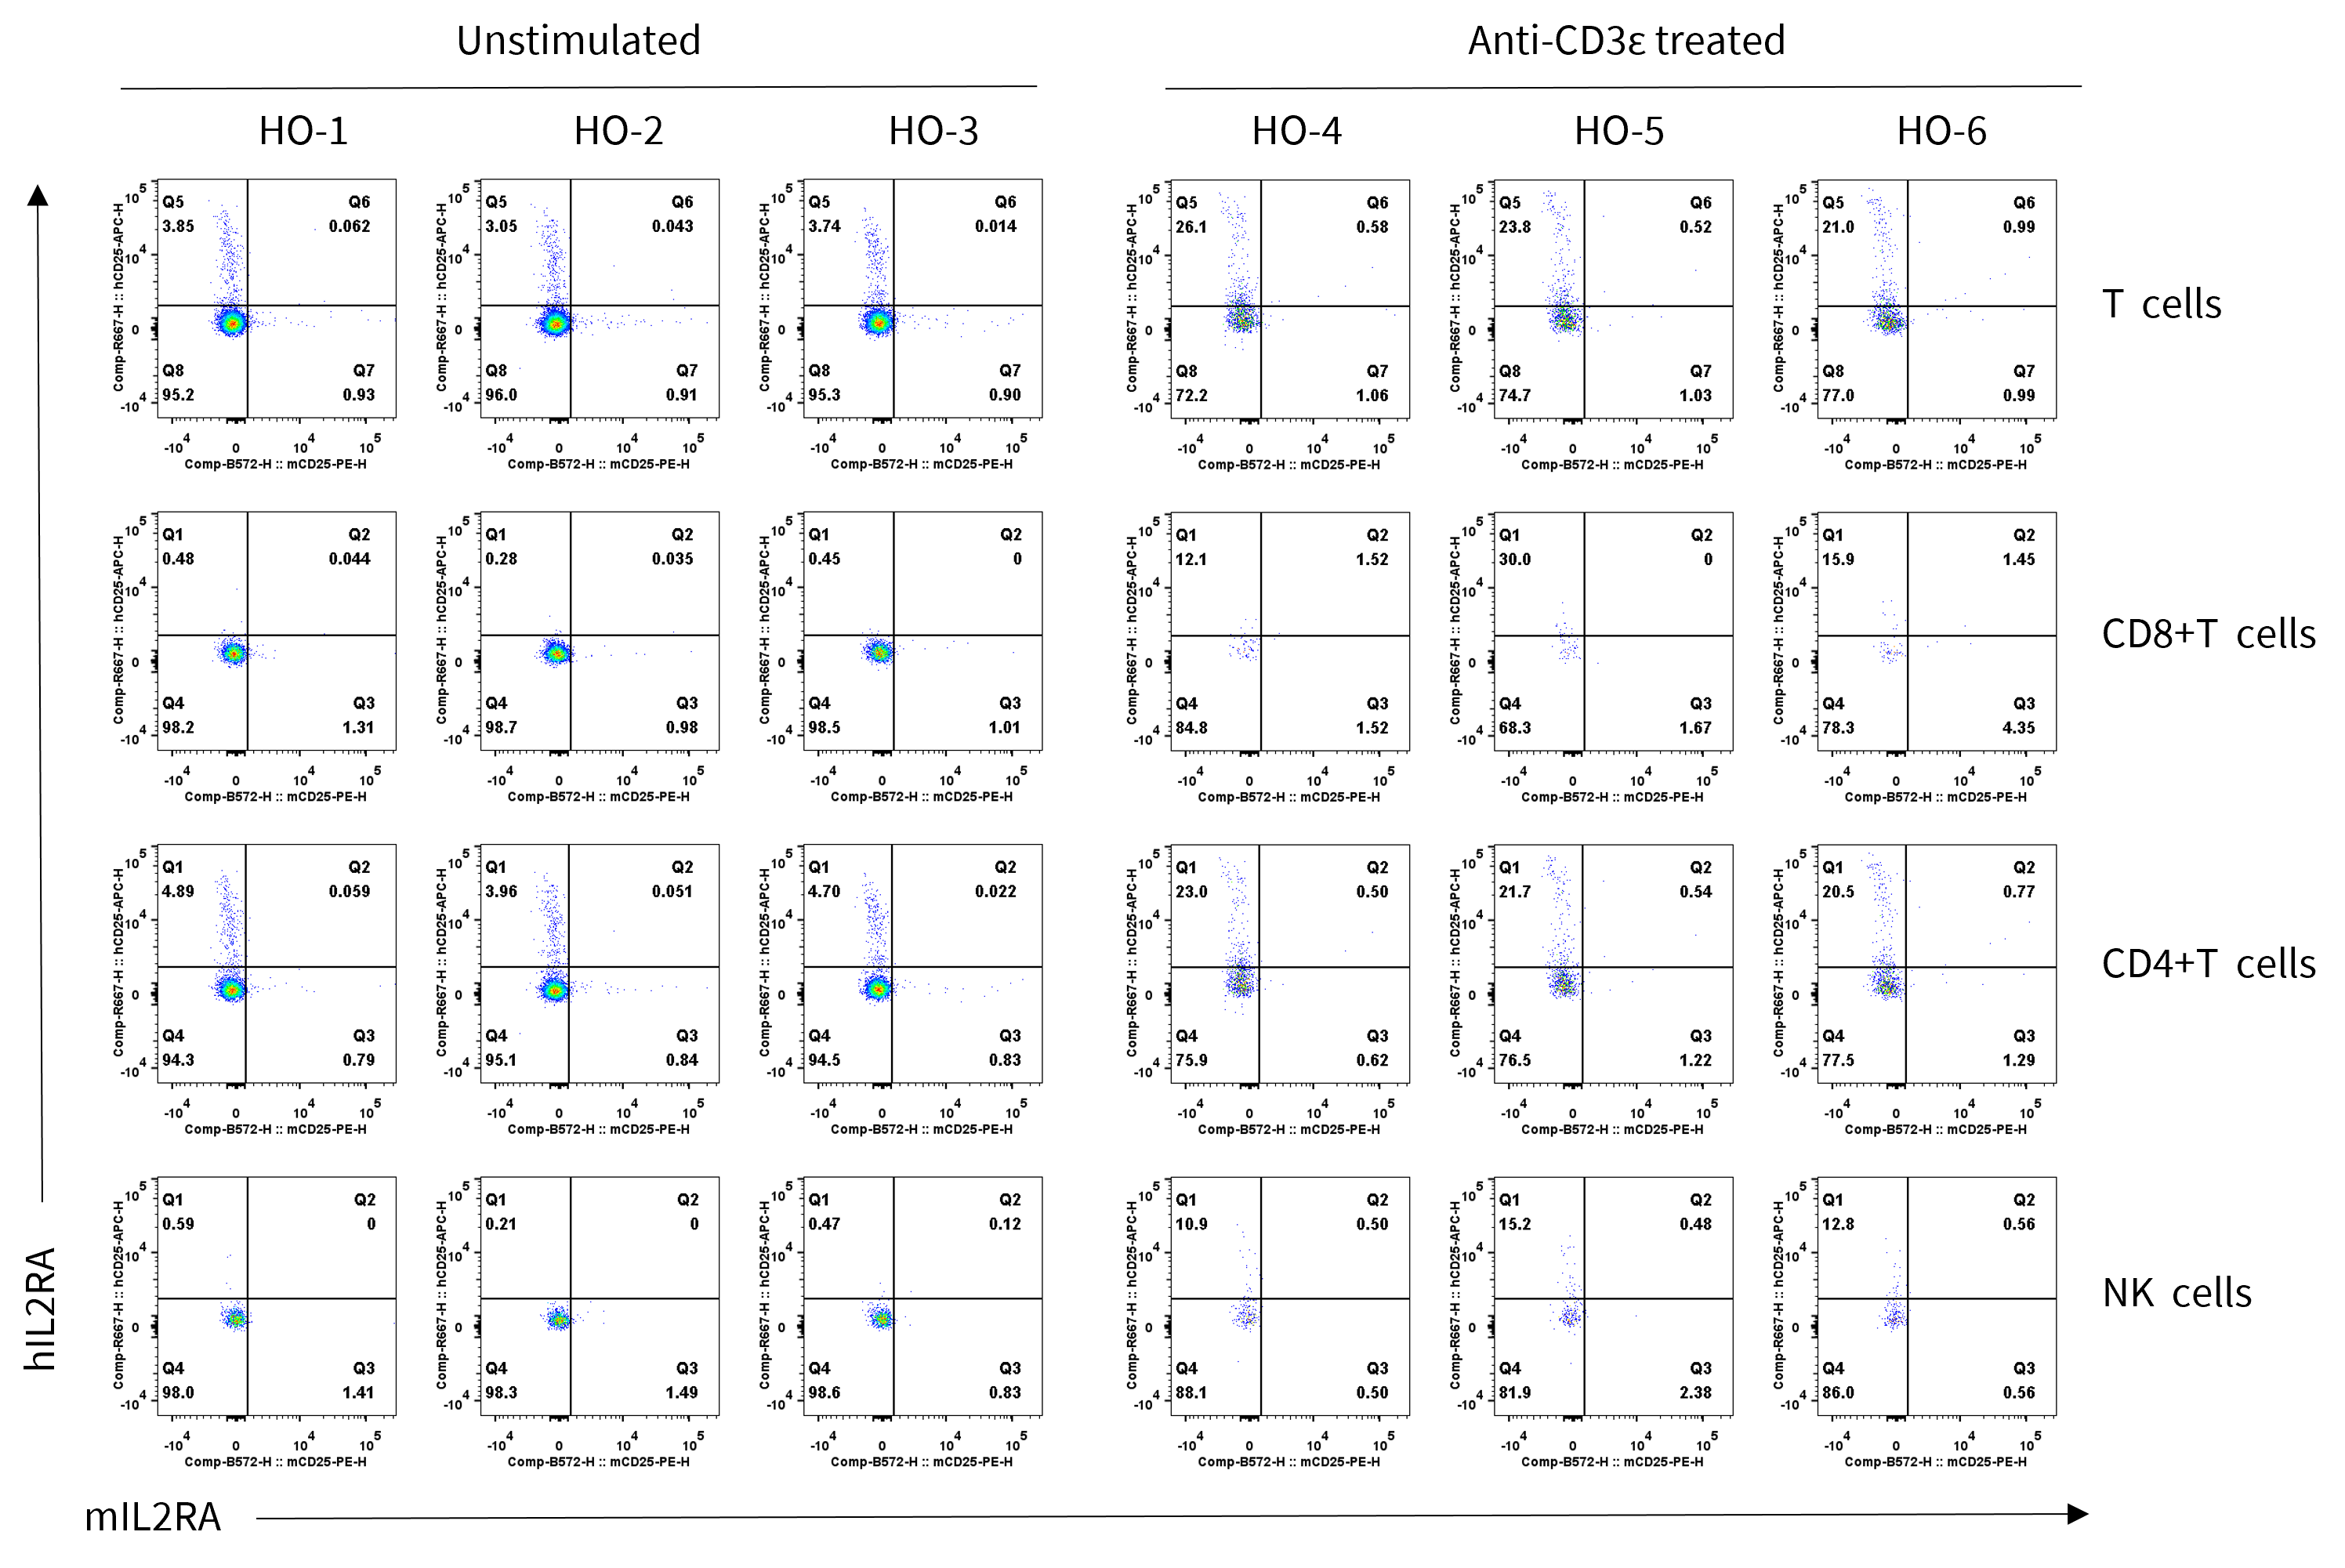
Strain specific IL2RA expression analysis in homozygous B-hPD-1 plus/hIL2RA/hIL2RB/hIL2RG/hIL15/hIL15RA mice by flow cytometry. Splenocytes were collected from homozygous B-hPD-1 plus/hIL2RA/hIL2RB/hIL2RG/hIL15/hIL15RA mice (male, 7-week-old, n = 3/group) stimulated with or without anti-CD3ε antibody (7.5 μg/mice, i.p.) in vivo for 24 h, and analyzed by flow cytometry with species-specific anti-mouse IL2RA antibody (Biolegend, 102008) and anti-human IL2RA antibody (Biolegend, 302610).
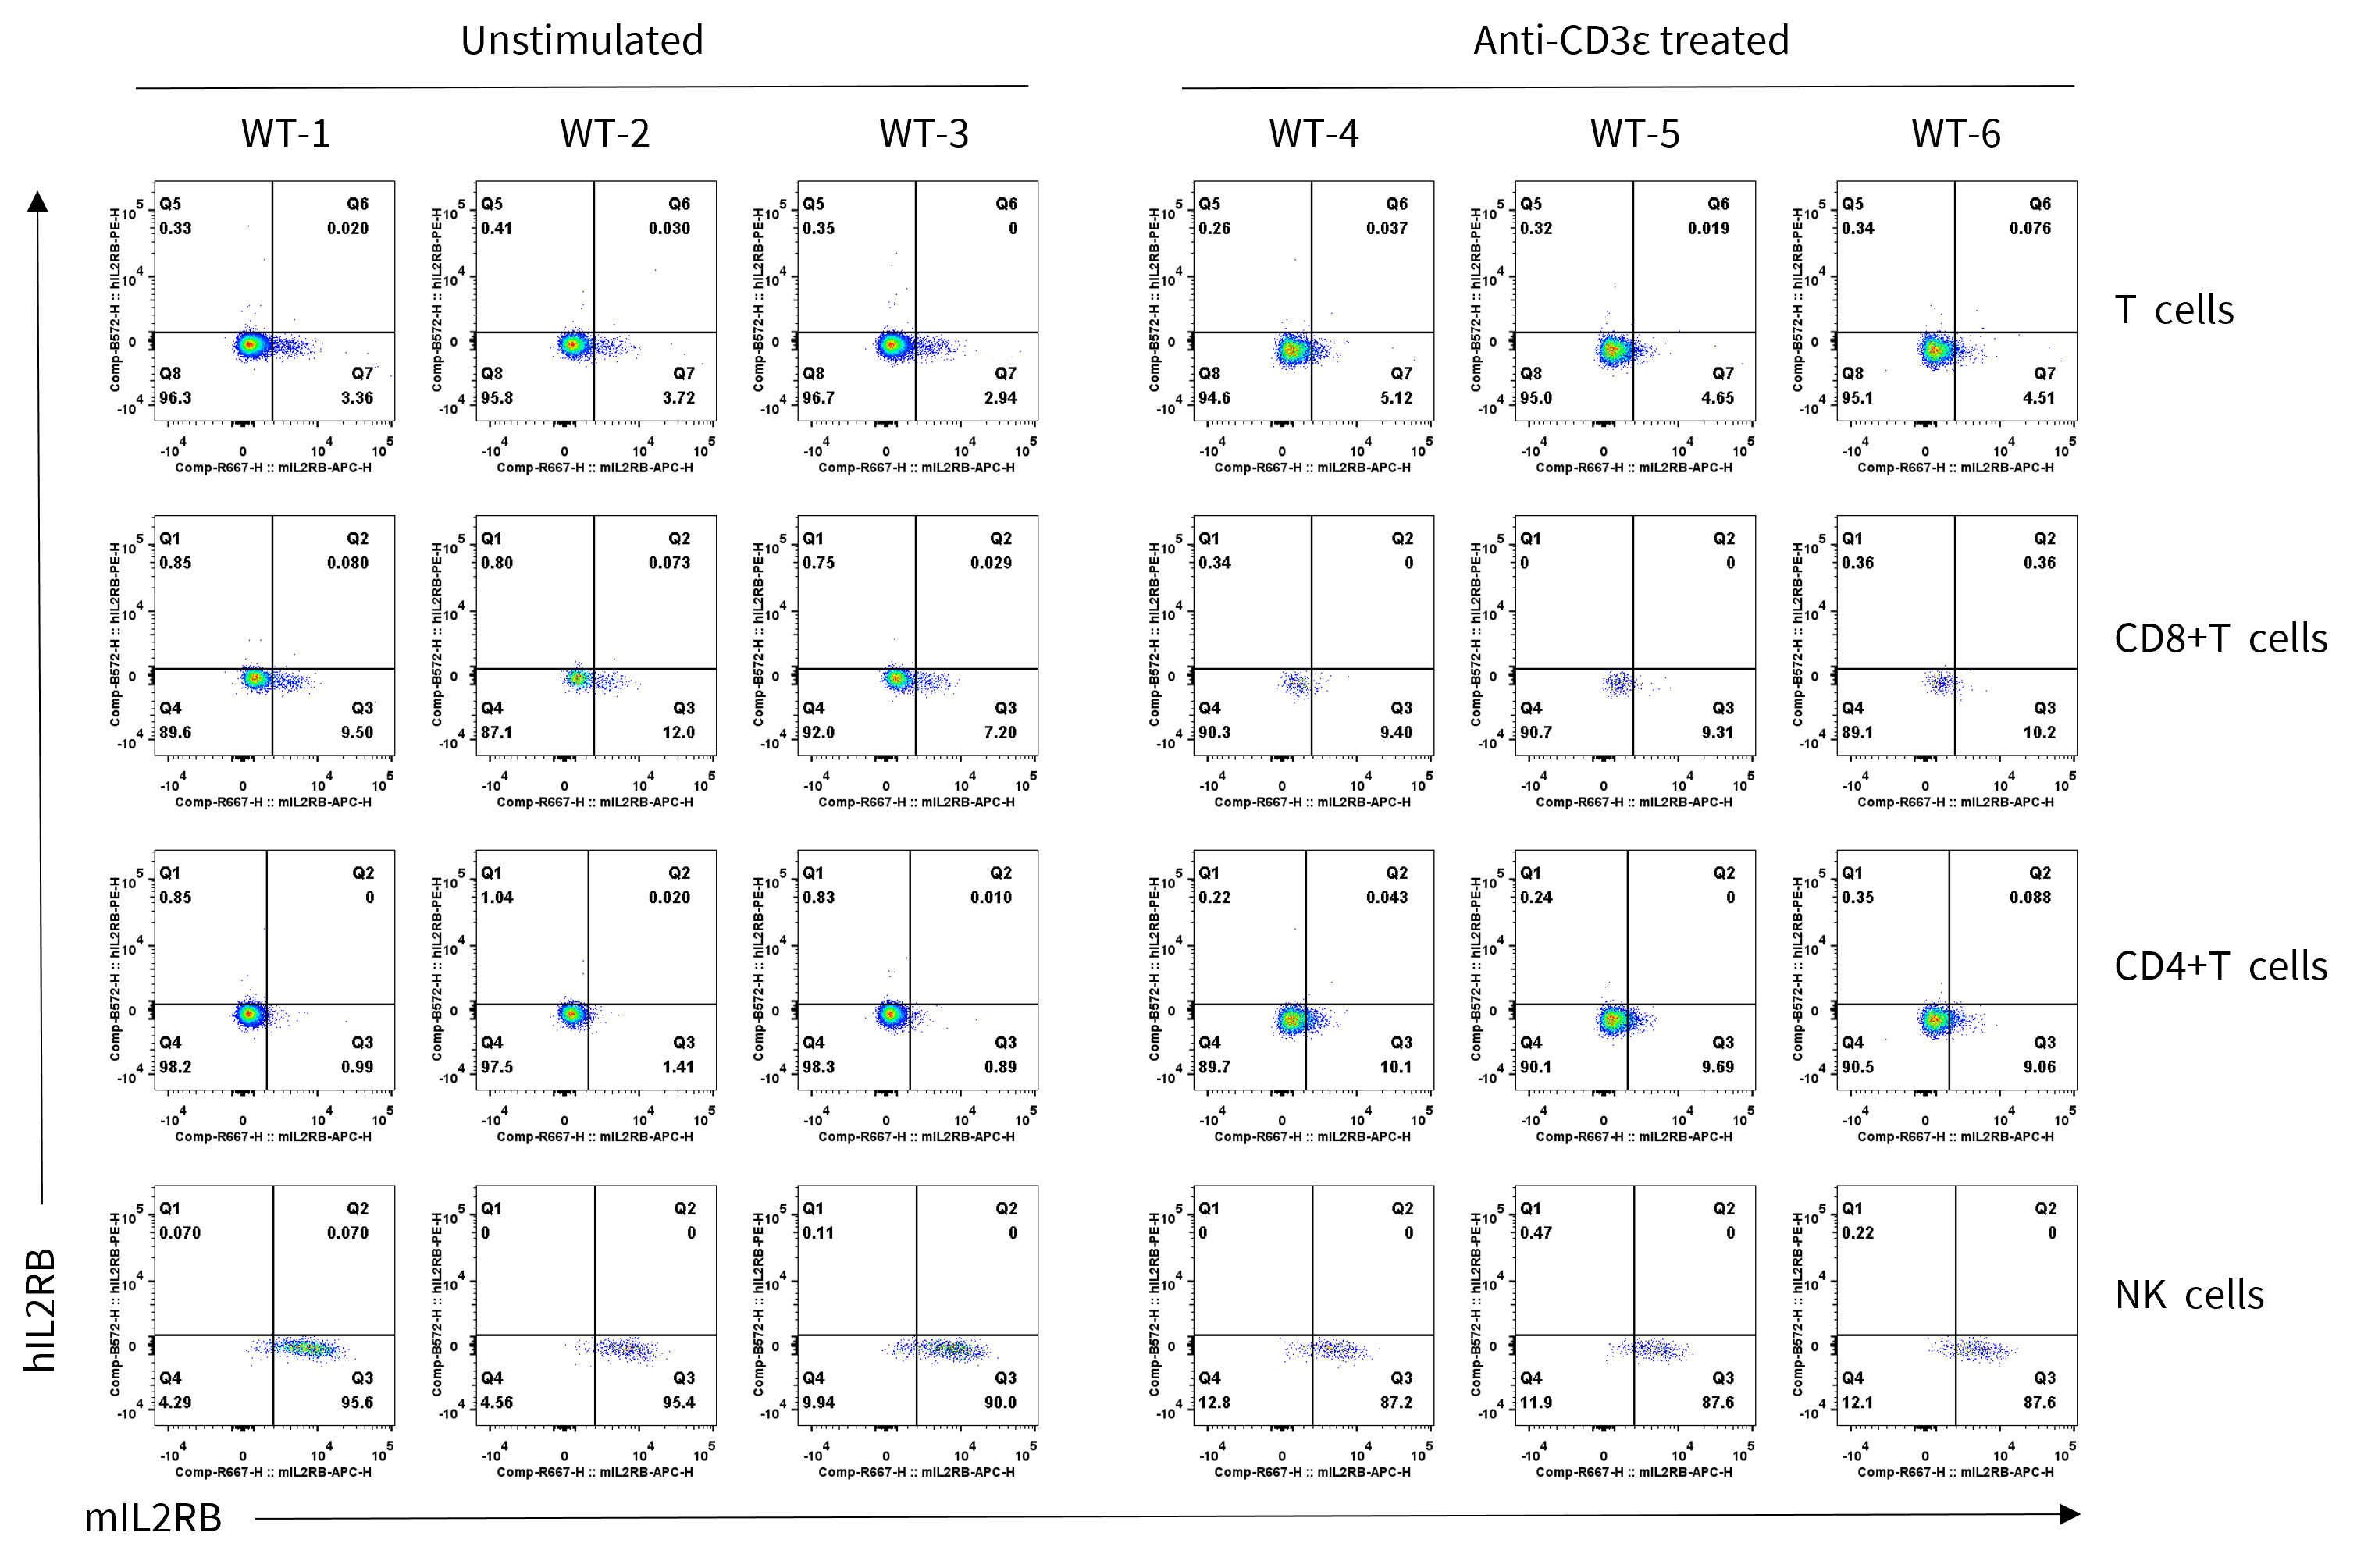
Strain specific IL2RB expression analysis in wild-type C57BL/6JNifdc mice by flow cytometry. Splenocytes were collected from wild-type C57BL/6JNifdc mice (male, 7-week-old, n = 3/group) stimulated with or without anti-CD3ε antibody (7.5 μg/mice, i.p.) in vivo for 24 h, and analyzed by flow cytometry with species-specific anti-mouse IL2RB antibody (Biolegend, 105912) and anti-human IL2RB antibody (Biolegend, 339005).
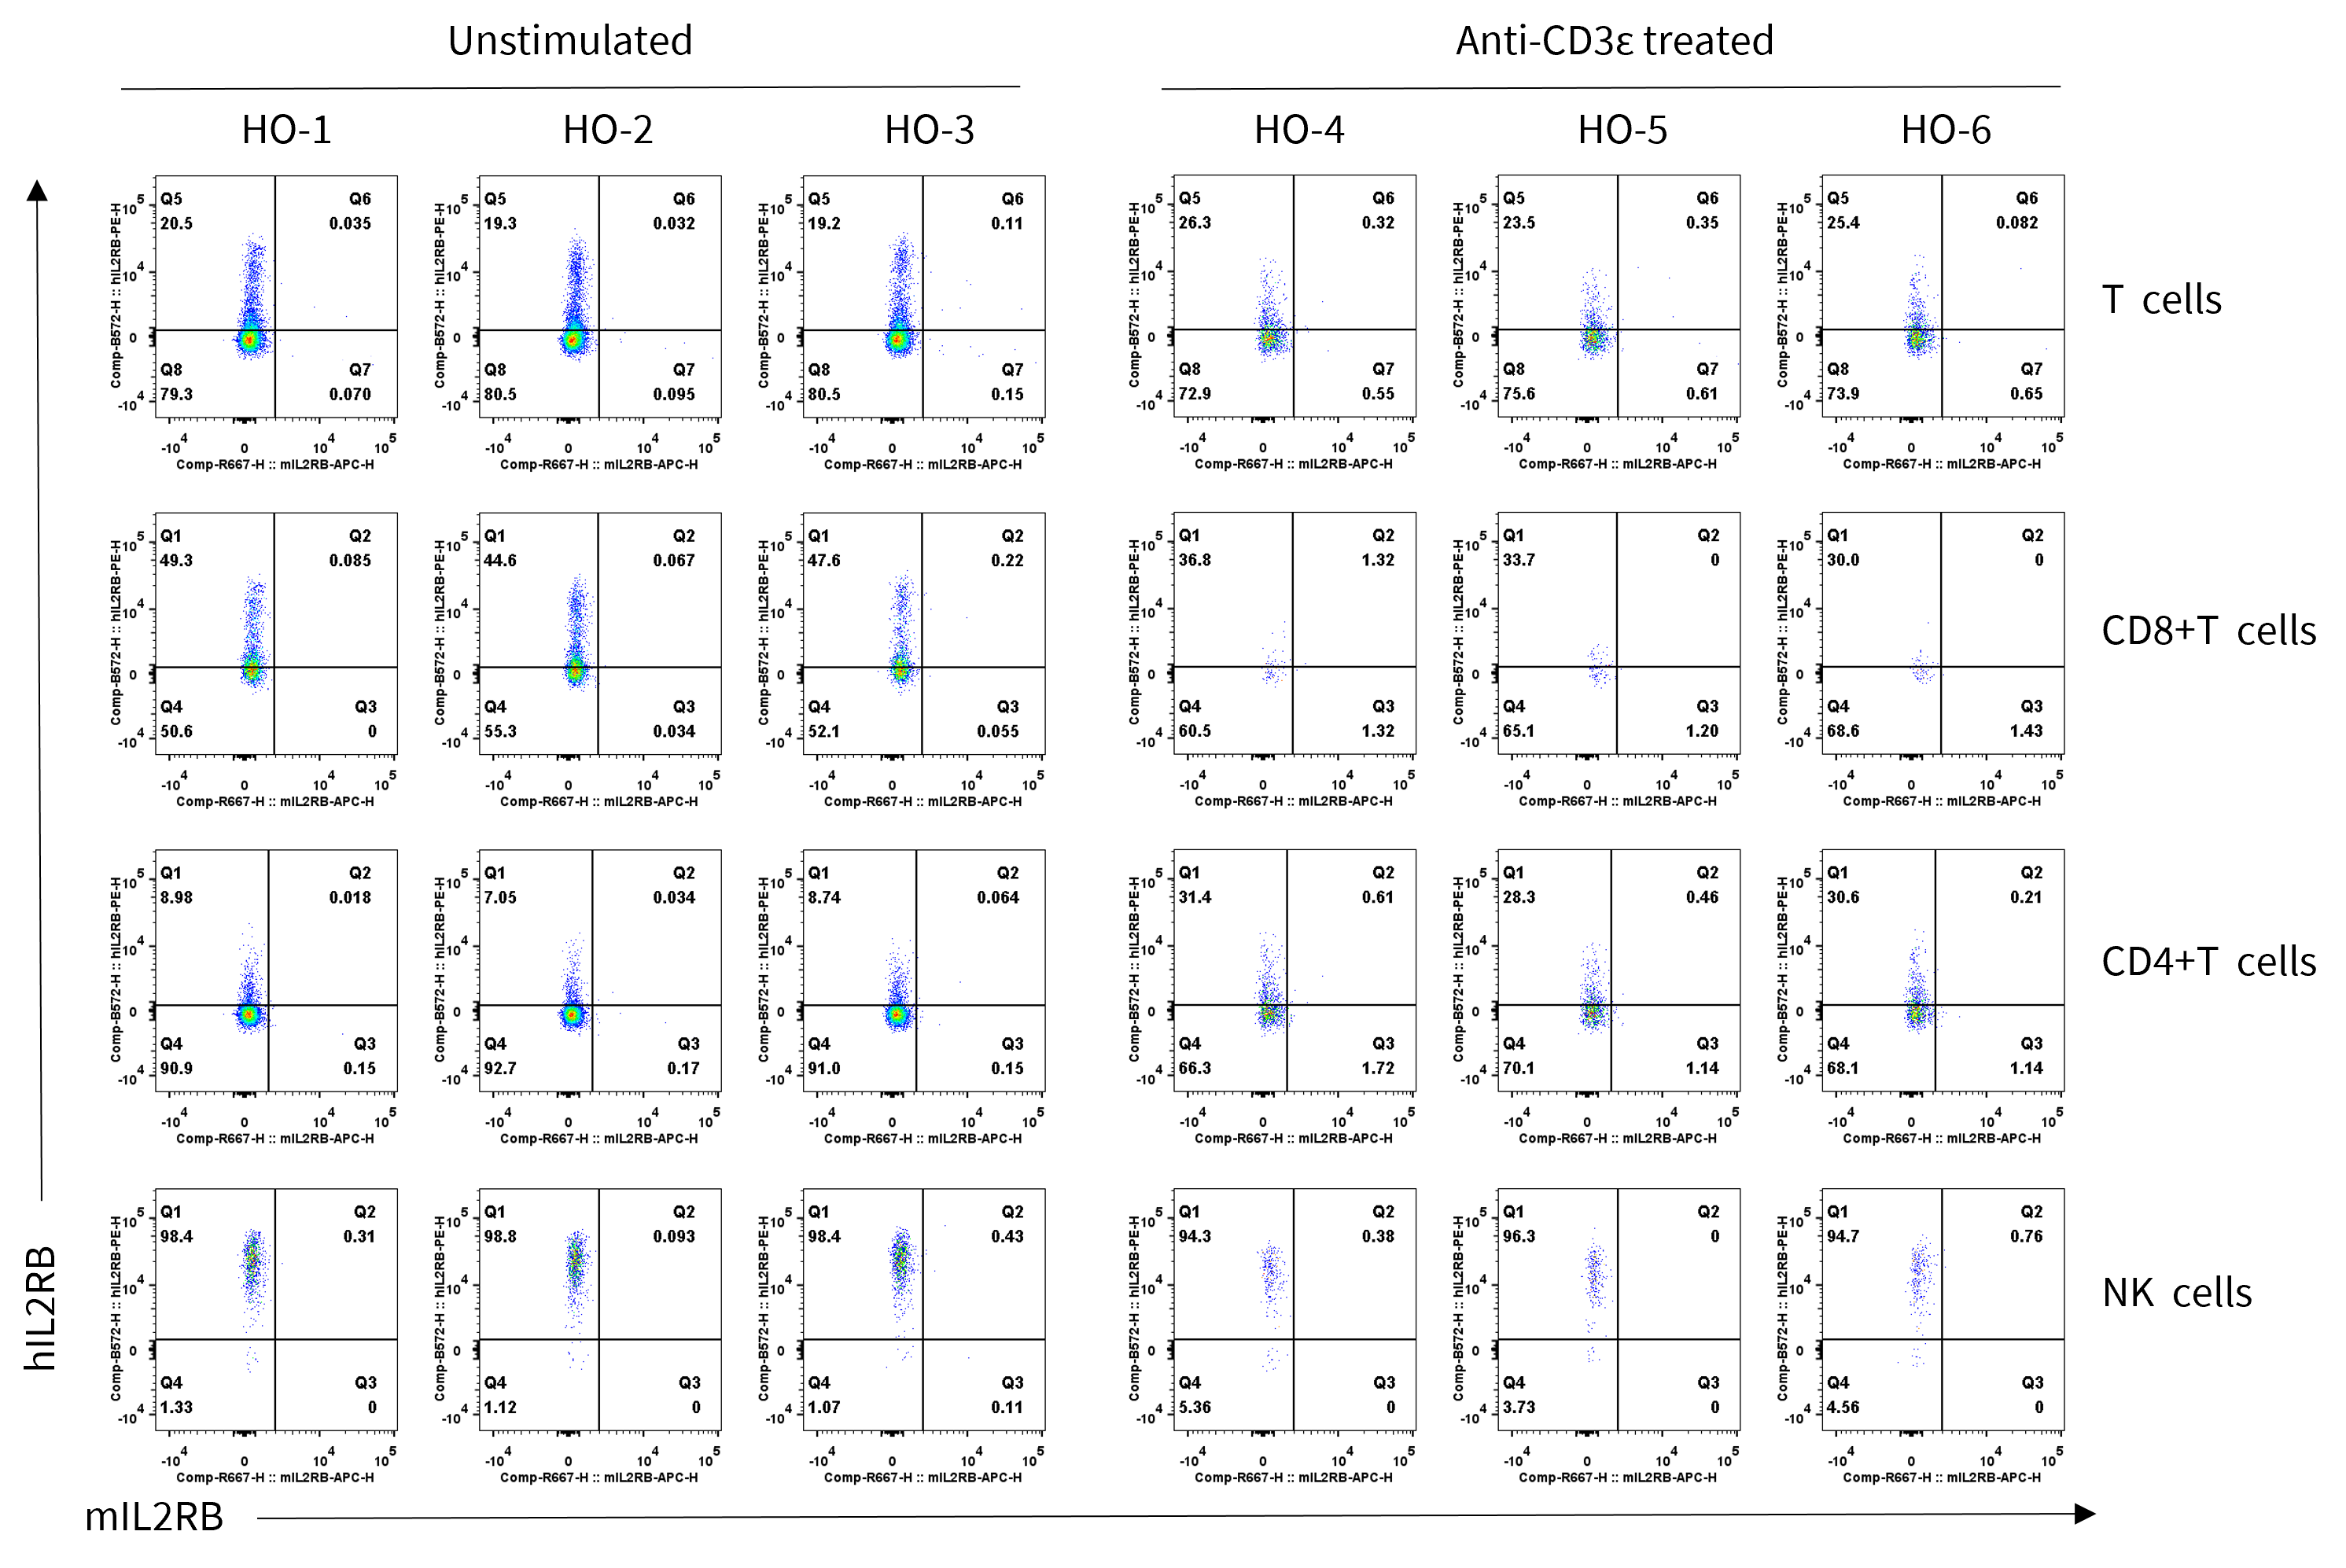
Strain specific IL2RB expression analysis in homozygous B-hPD-1 plus/hIL2RA/hIL2RB/hIL2RG/hIL15/hIL15RA mice by flow cytometry. Splenocytes were collected from homozygous B-hPD-1 plus/hIL2RA/hIL2RB/hIL2RG/hIL15/hIL15RA mice (male, 7-week-old, n = 3/group) stimulated with or without anti-CD3ε antibody (7.5 μg/mice, i.p.) in vivo for 24 h, and analyzed by flow cytometry with species-specific anti-mouse IL2RB antibody (Biolegend, 105912) and anti-human IL2RB antibody (Biolegend, 339005).
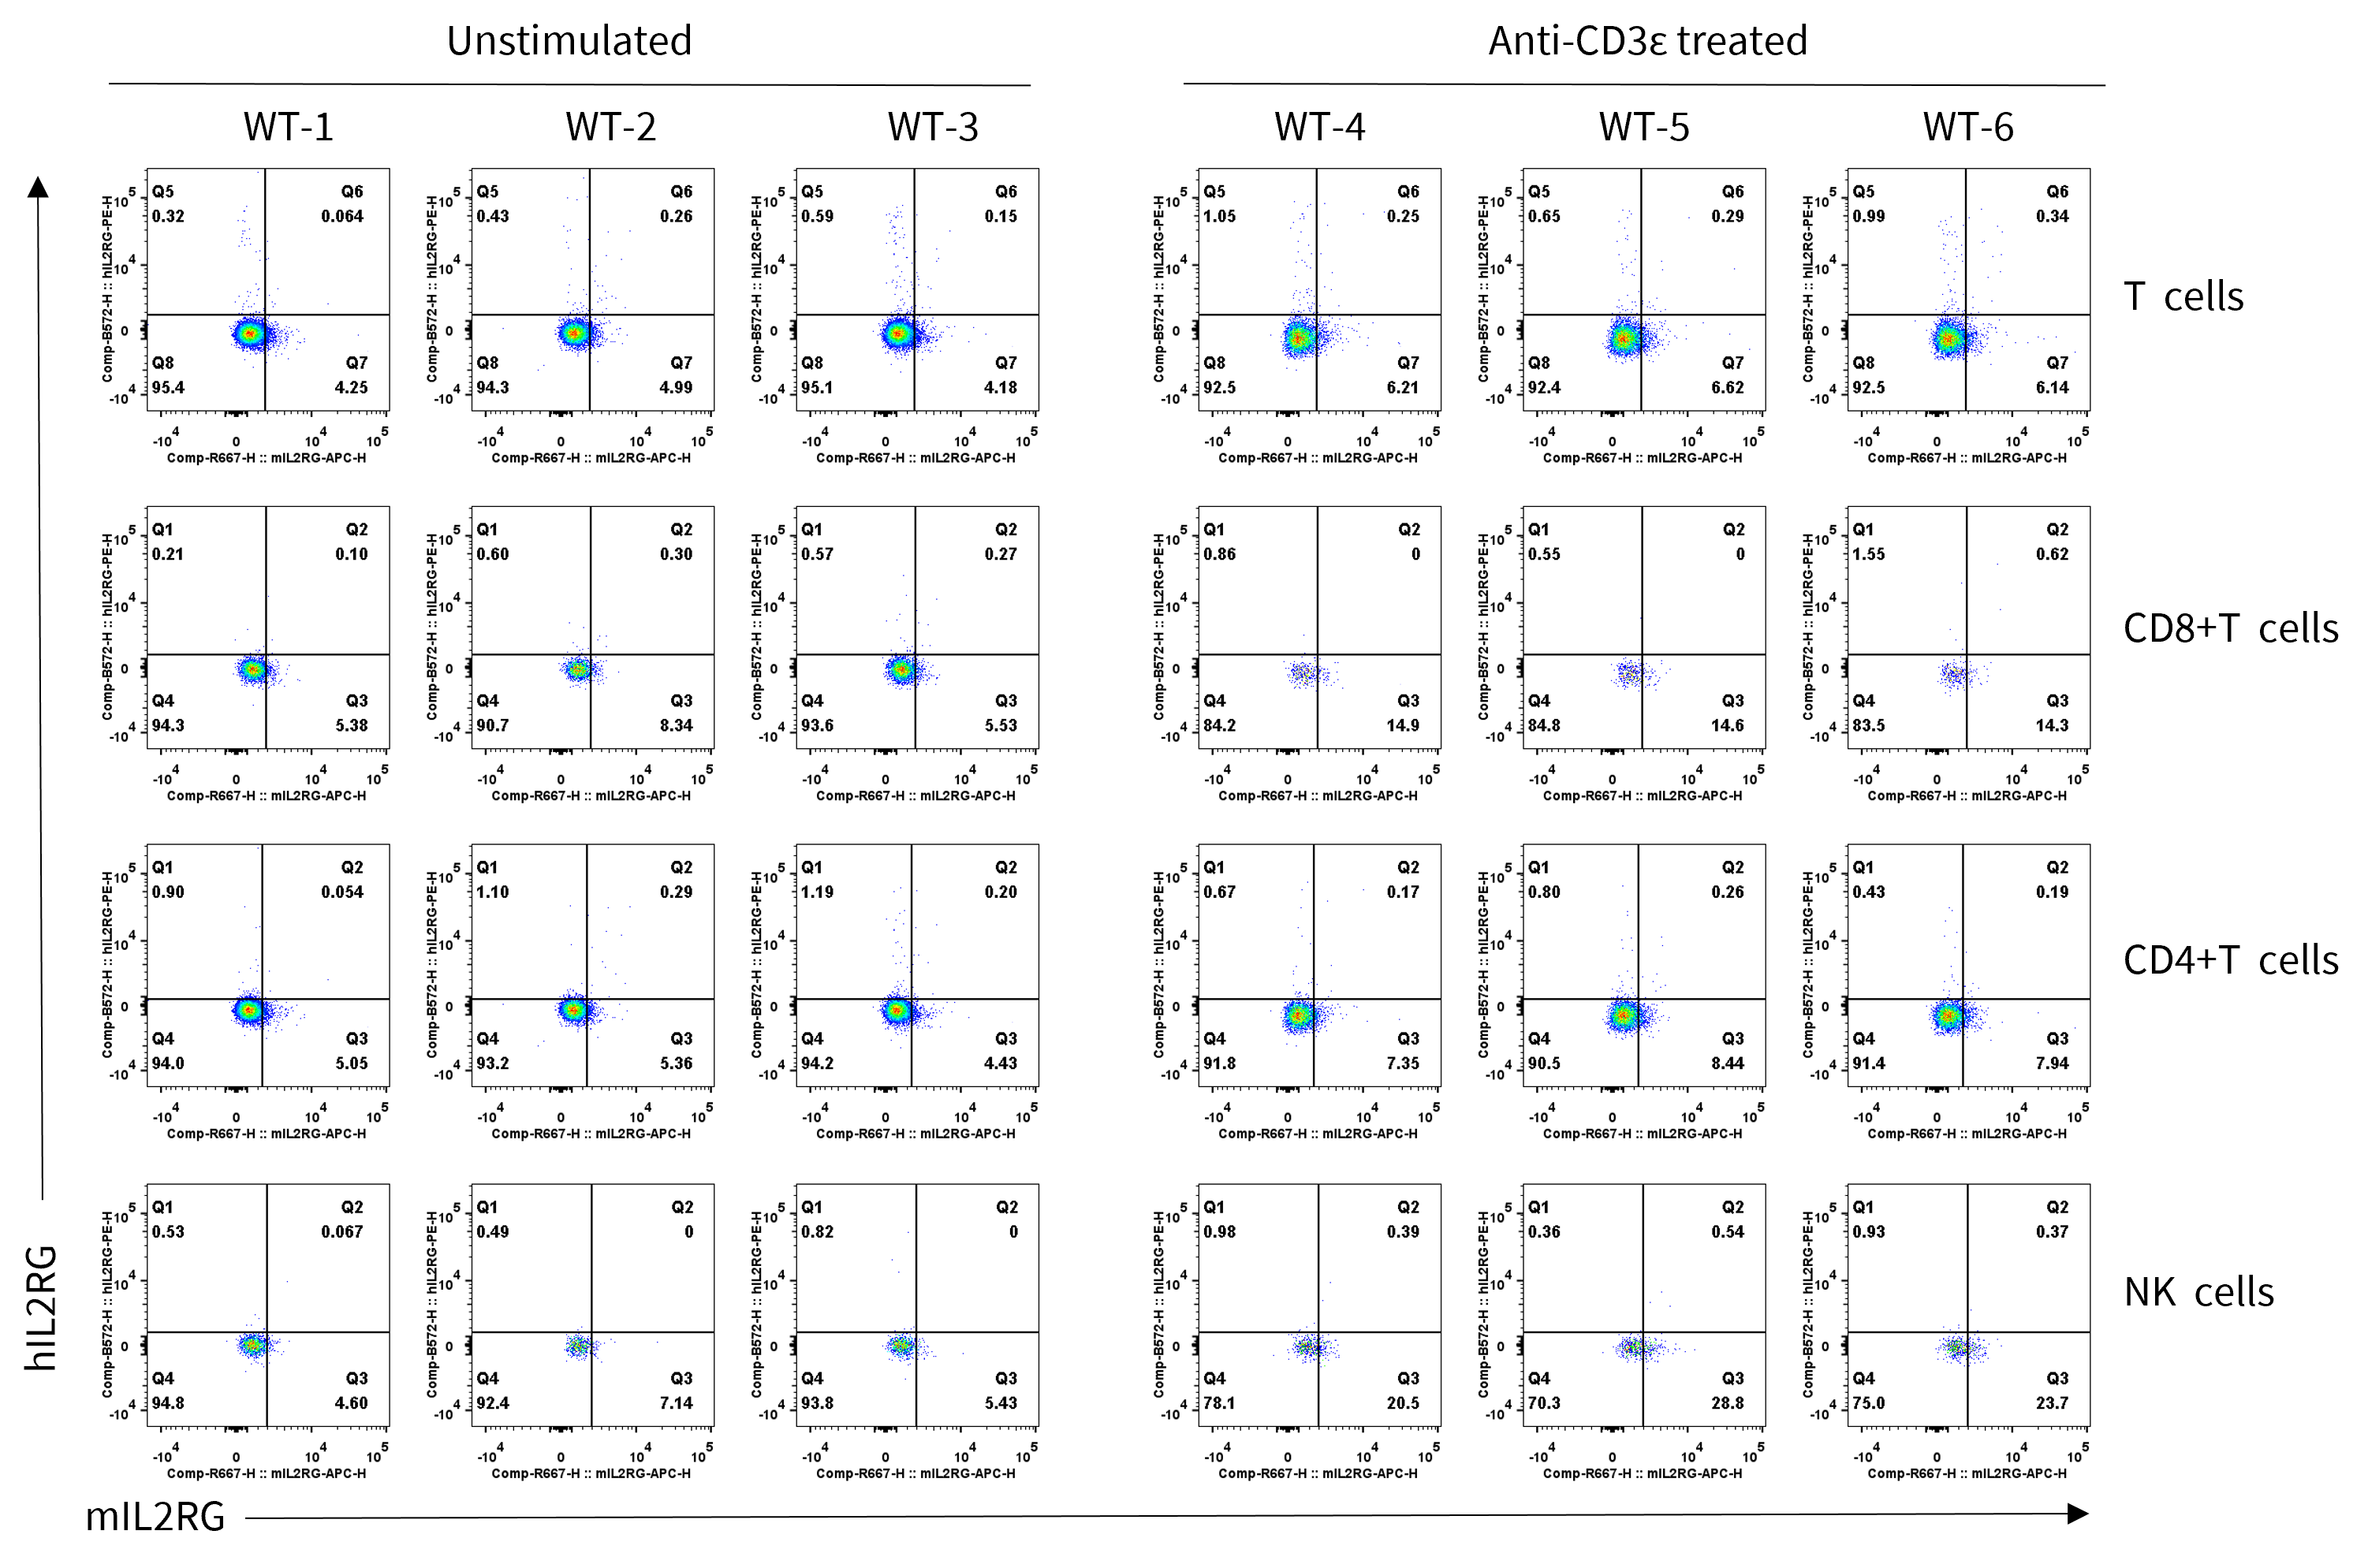
Strain specific IL2RG expression analysis in wild-type C57BL/6JNifdc mice by flow cytometry. Splenocytes were collected from wild-type C57BL/6JNifdc mice (male, 7-week-old, n = 3/group) stimulated with or without anti-CD3ε antibody (7.5 μg/mice, i.p.) in vivo for 24 h, and analyzed by flow cytometry with species-specific anti-mouse IL2RG antibody (Biolegend, 132307) and anti-human IL2RG antibody (Biolegend, 338605).
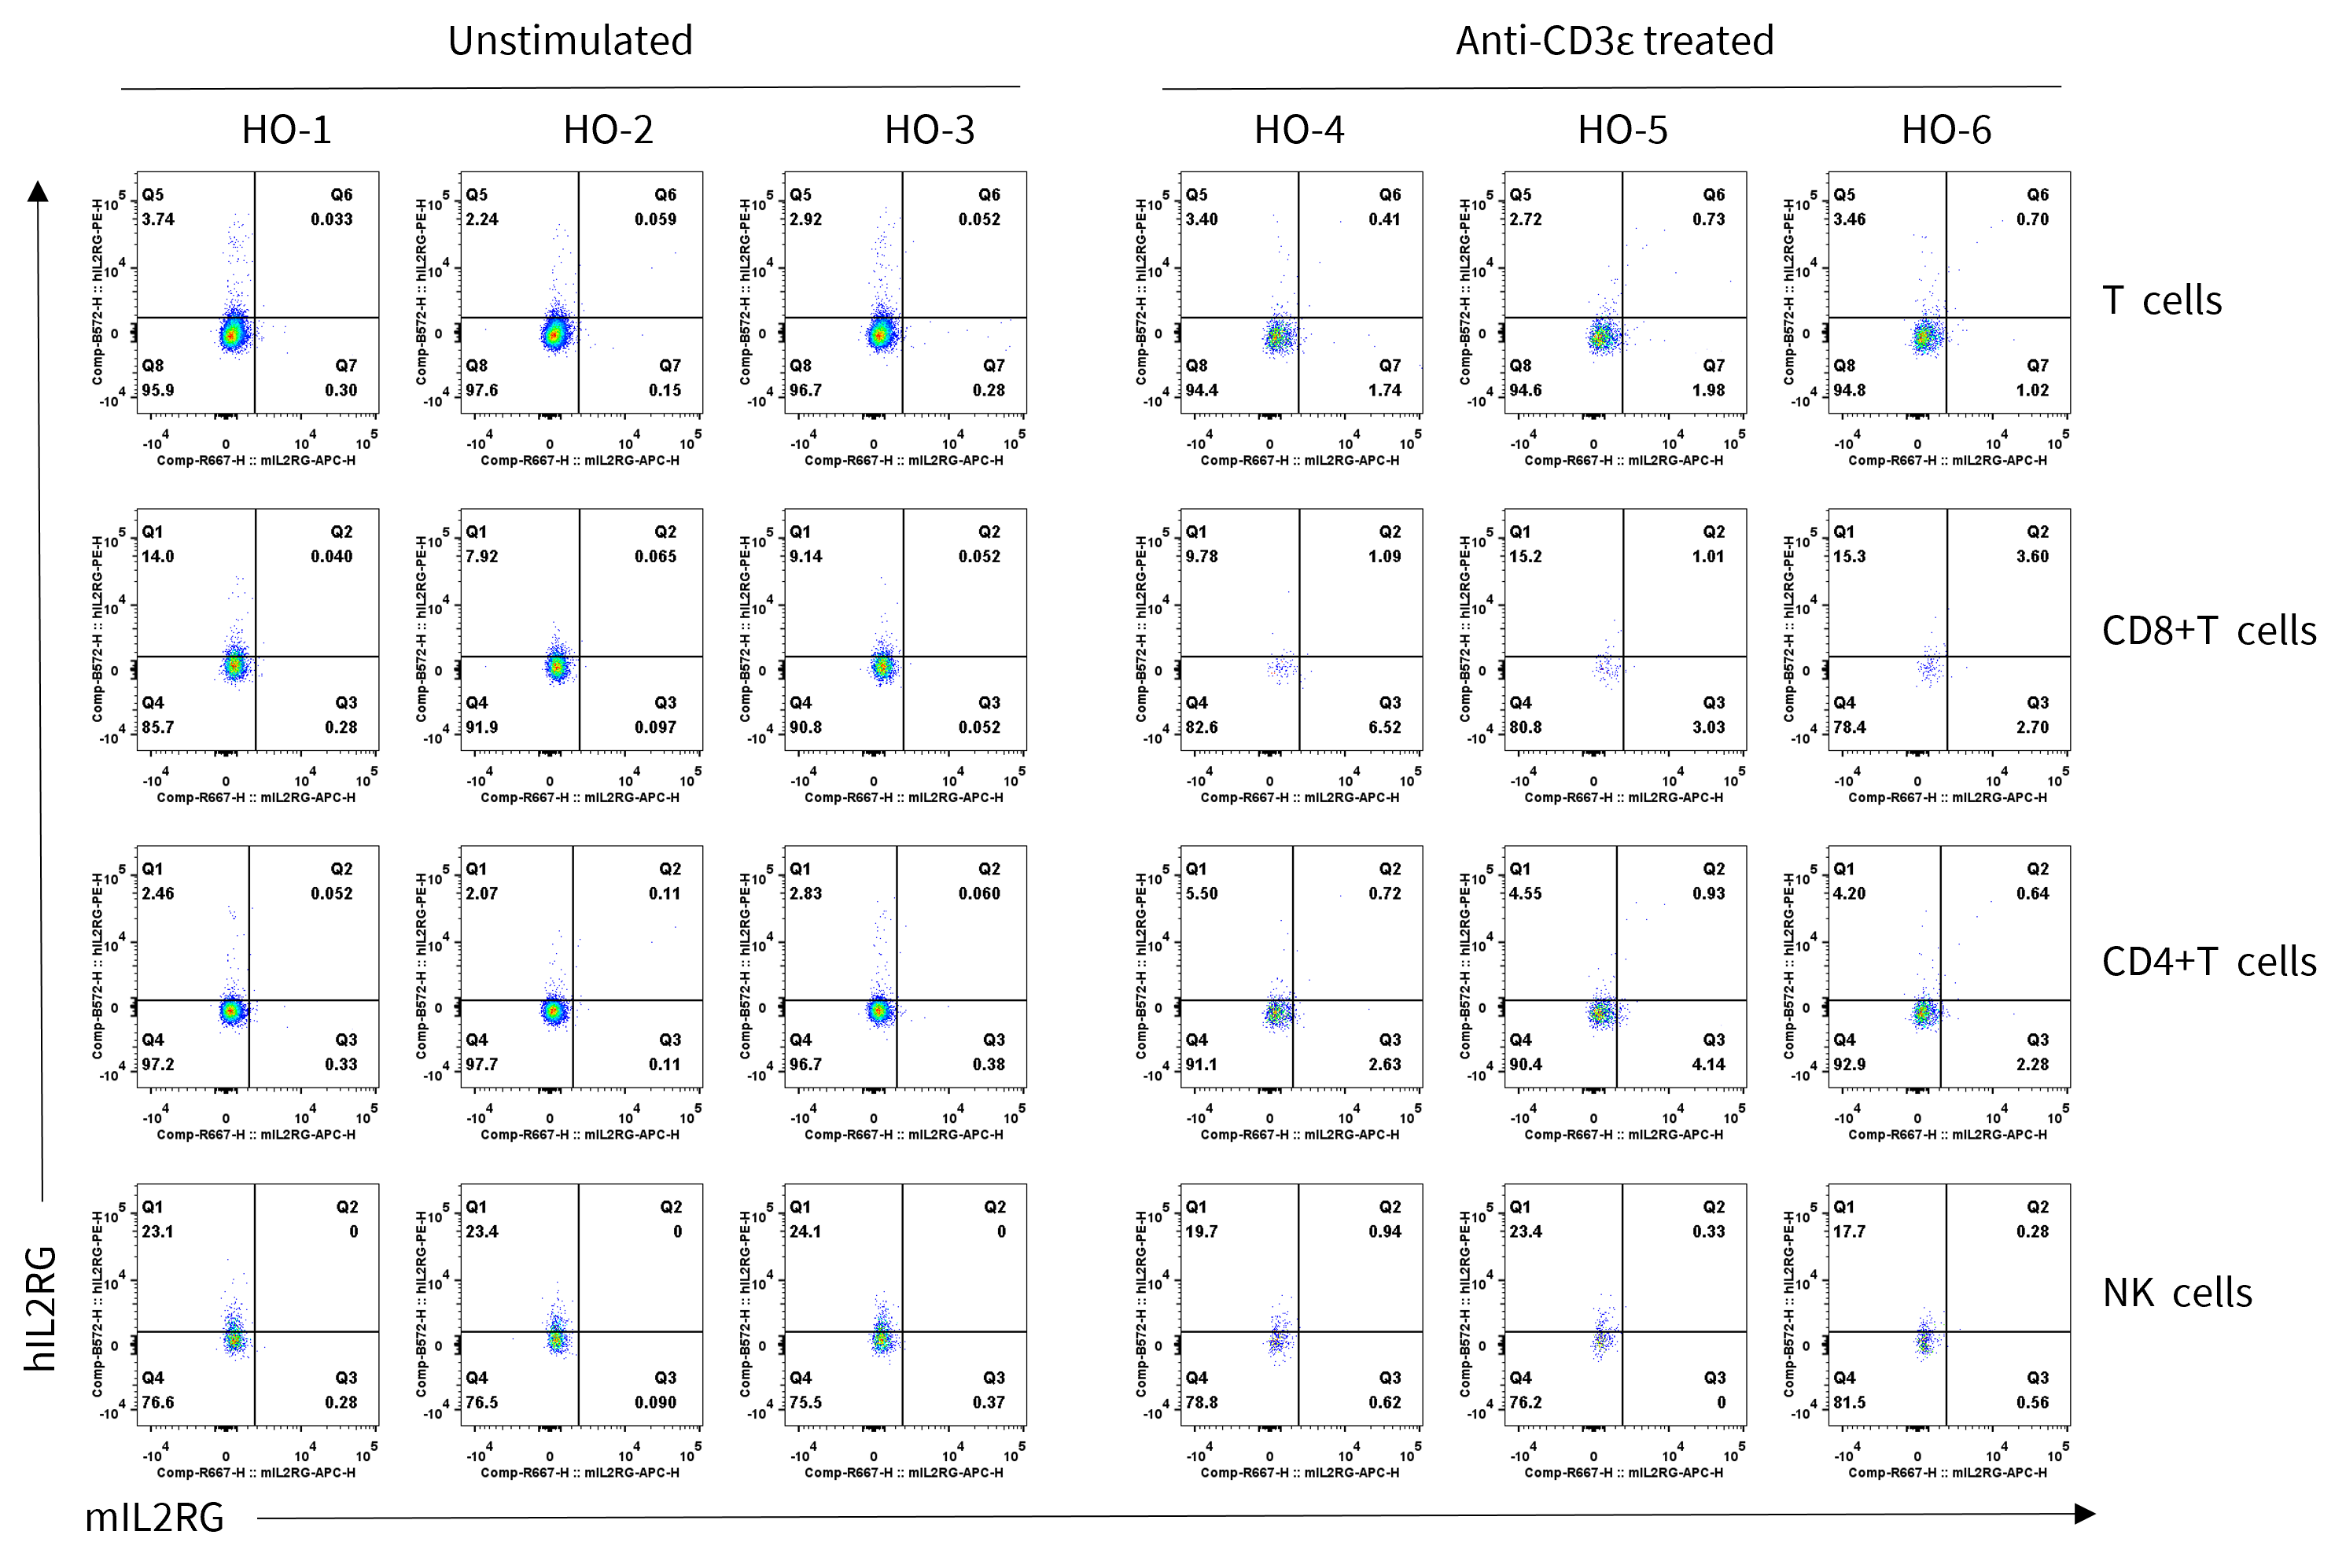
Strain specific IL2RG expression analysis in homozygous B-hPD-1 plus/hIL2RA/hIL2RB/hIL2RG/hIL15/hIL15RA mice by flow cytometry. Splenocytes were collected from homozygous B-hPD-1 plus/hIL2RA/hIL2RB/hIL2RG/hIL15/hIL15RA mice (male, 7-week-old, n=3/group) stimulated with or without anti-CD3ε antibody (7.5 μg/mice, i.p.) in vivo for 24 h, and analyzed by flow cytometry with species-specific anti-mouse IL2RG antibody (Biolegend, 132307) and anti-human IL2RG antibody (Biolegend, 338605).

Strain specific IL15 expression analysis in wild-type C57BL/6JNifdc mice and homozygous B-hPD-1 plus/hIL2/hIL2RA/hIL2RB/hIL2RG/hIL15/hIL15RA mice by ELISA. Serum was collected from wild-type C57BL/6JNifdc mice and homozygous B-hPD-1 plus/hIL2/hIL2RA/hIL2RB/hIL2RG/hIL15/hIL15RA mice (Female, 6-week-old, n = 3/group,) stimulated with 350 mg/kg APAP in vivo for 18 h. Expression level of human IL15 was analyzed by ELISA (anti-human IL15 ELISA kit: R&D D1500). Values are expressed as mean ± SEM.
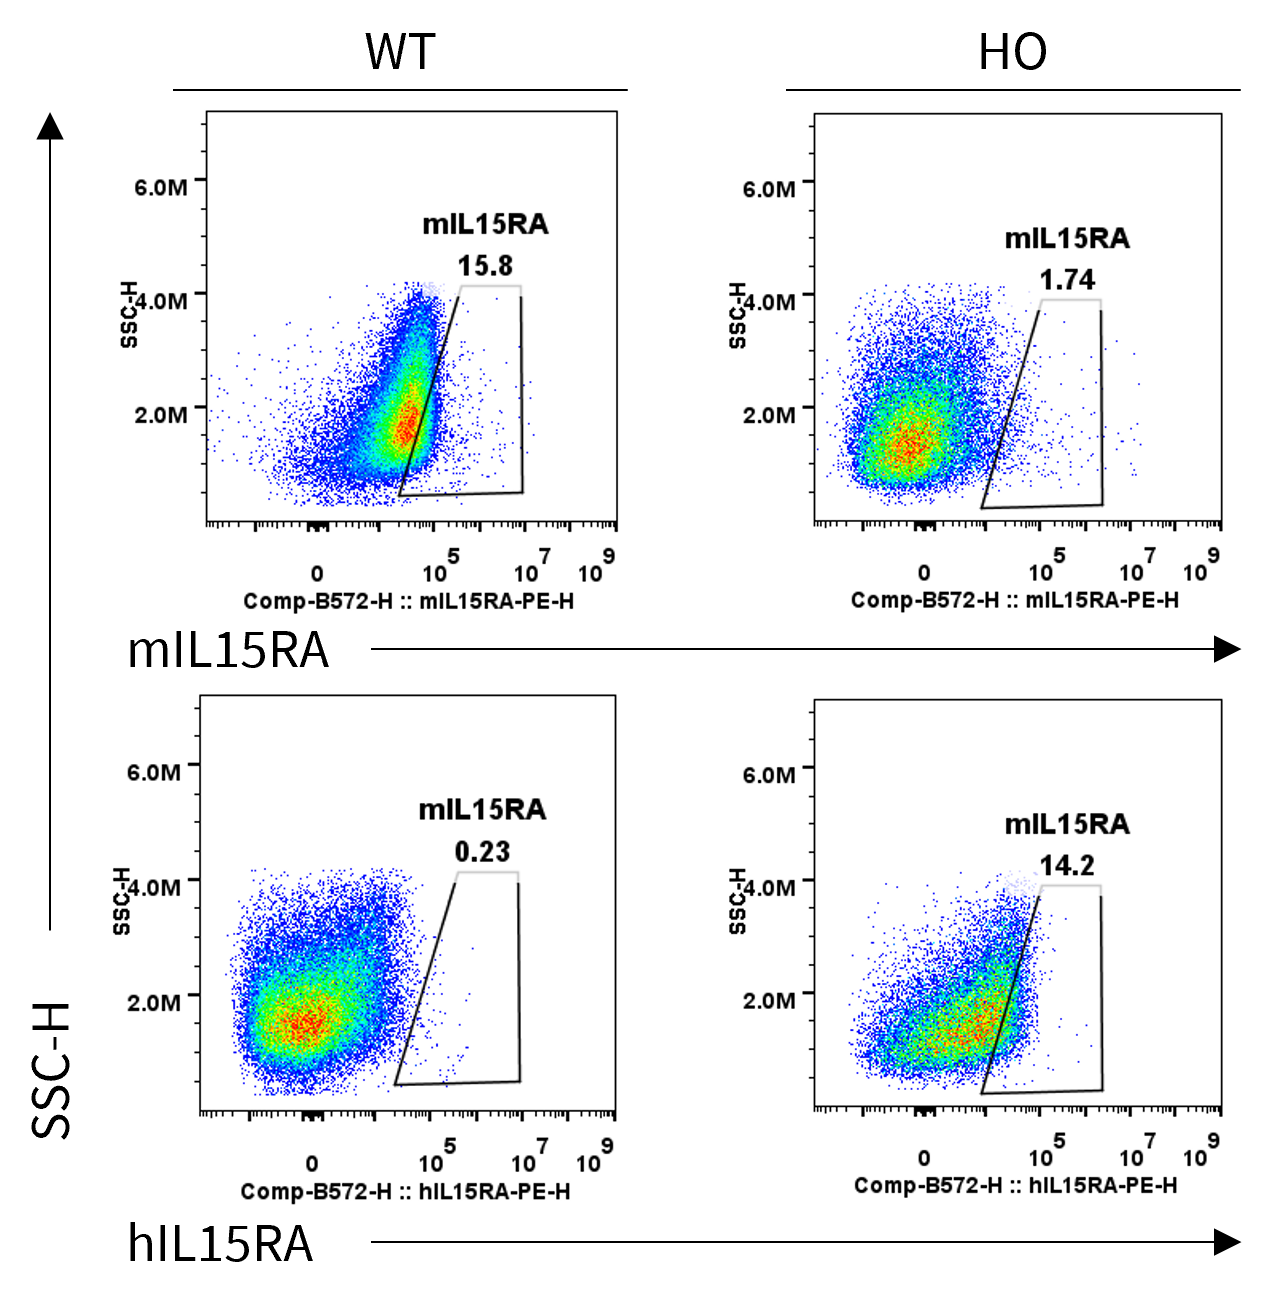
Strain specific IL15RA expression analysis in homozygous B-hPD-1 plus/hIL2/hIL2RA/hIL2RB/hIL2RG/hIL15/hIL15RA mice by flow cytometry. Bone marrow cells were collected from wild-type (WT) C57BL/6JNifdc mice and homozygous (HO) B-hPD-1 plus/hIL2/hIL2RA/hIL2RB/hIL2RG/hIL15/hIL15RA mice, and cultured in 6-well plates stimulated with GM-CSF and IL-4 for 6 days and LPS (1 μg/mL) for 18 h to induce BMDCs. Then BMDCs were collected and analyzed by flow cytometry with anti-mouse IL15RA antibody (BD, 568235) and anti-human IL15RA antibody (Biolegend, 330207).

Analysis of leukocyte subpopulations by flow cytometry in immune organs and blood. Splenocytes, blood, and lymph nodes were isolated from C57BL/6JNifdc and B-hPD-1 plus/hIL2RA/hIL2RB/hIL2RG/hIL15/hIL15RA mice (female, 8-week-old, n = 3). Single live cells were gated on the CD45⁺ population and analyzed by flow cytometry as indicated. Values are expressed as mean ± SEM.

Analysis of T-cell subpopulations by flow cytometry in immune organs and blood. Splenocytes, blood, and lymph nodes were isolated from C57BL/6JNifdc and B-hPD-1 plus/hIL2RA/hIL2RB/hIL2RG/hIL15/hIL15RA mice (female, 8-week-old, n = 3). Single live cells were gated on the CD3⁺ T-cell population and analyzed by flow cytometry as indicated. Values are expressed as mean ± SEM.
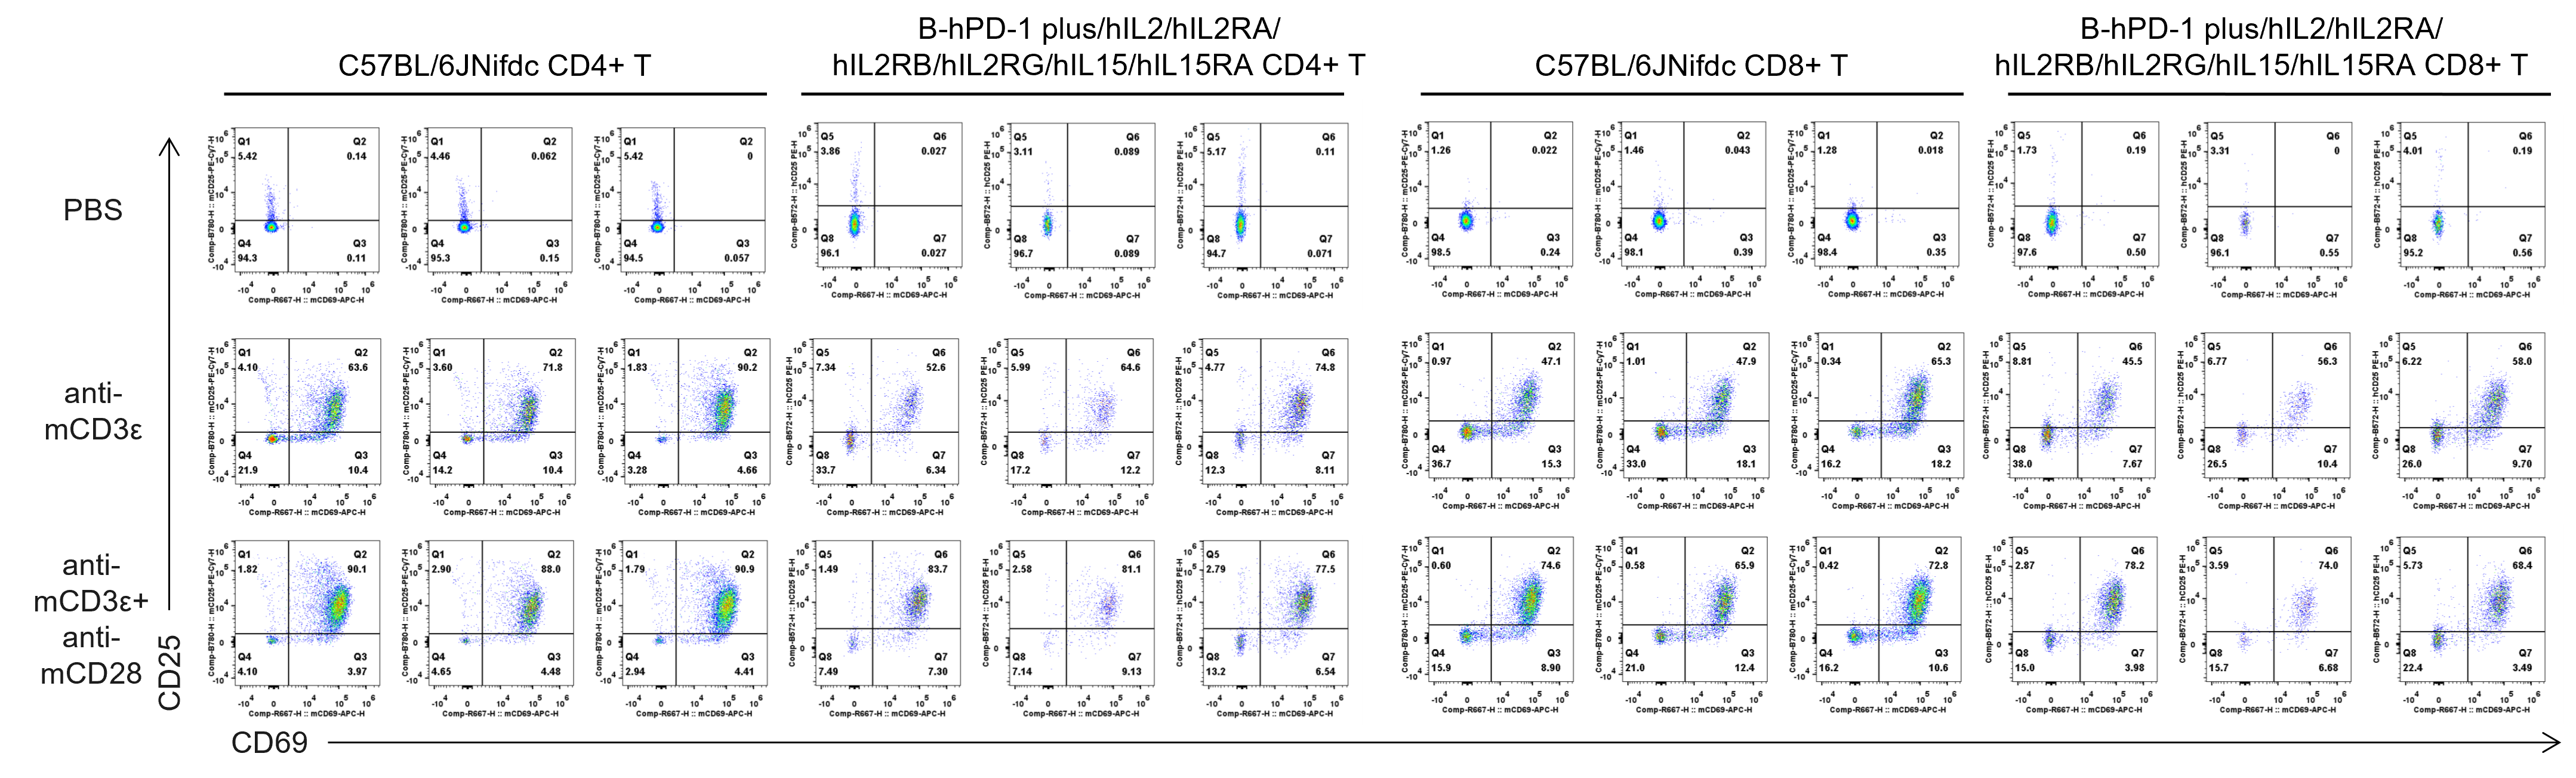
In vitro T cell activation by anti-mCD3ε antibody with or without anti-mCD28 antibody in wild-type C57BL/6JNifdc mice and homozygous B-hPD-1 plus/hIL2/hIL2RA/hIL2RB/hIL2RG/hIL15/hIL15RA mice (24h). T cells were isolated from splenocytes of C57BL/6JNifdc and B-hPD-1 plus/hIL2/hIL2RA/hIL2RB/hIL2RG/hIL15/hIL15RA mice (female, 13-week-old, n=3), and incubated in the presence of anti-mCD3ε antibody (2 ug/ml, BioXcell, BE0001-2), with or witnout anti-mCD28 antibody (5 ug/ml, BioXcell, BE0015-1) for 24h.
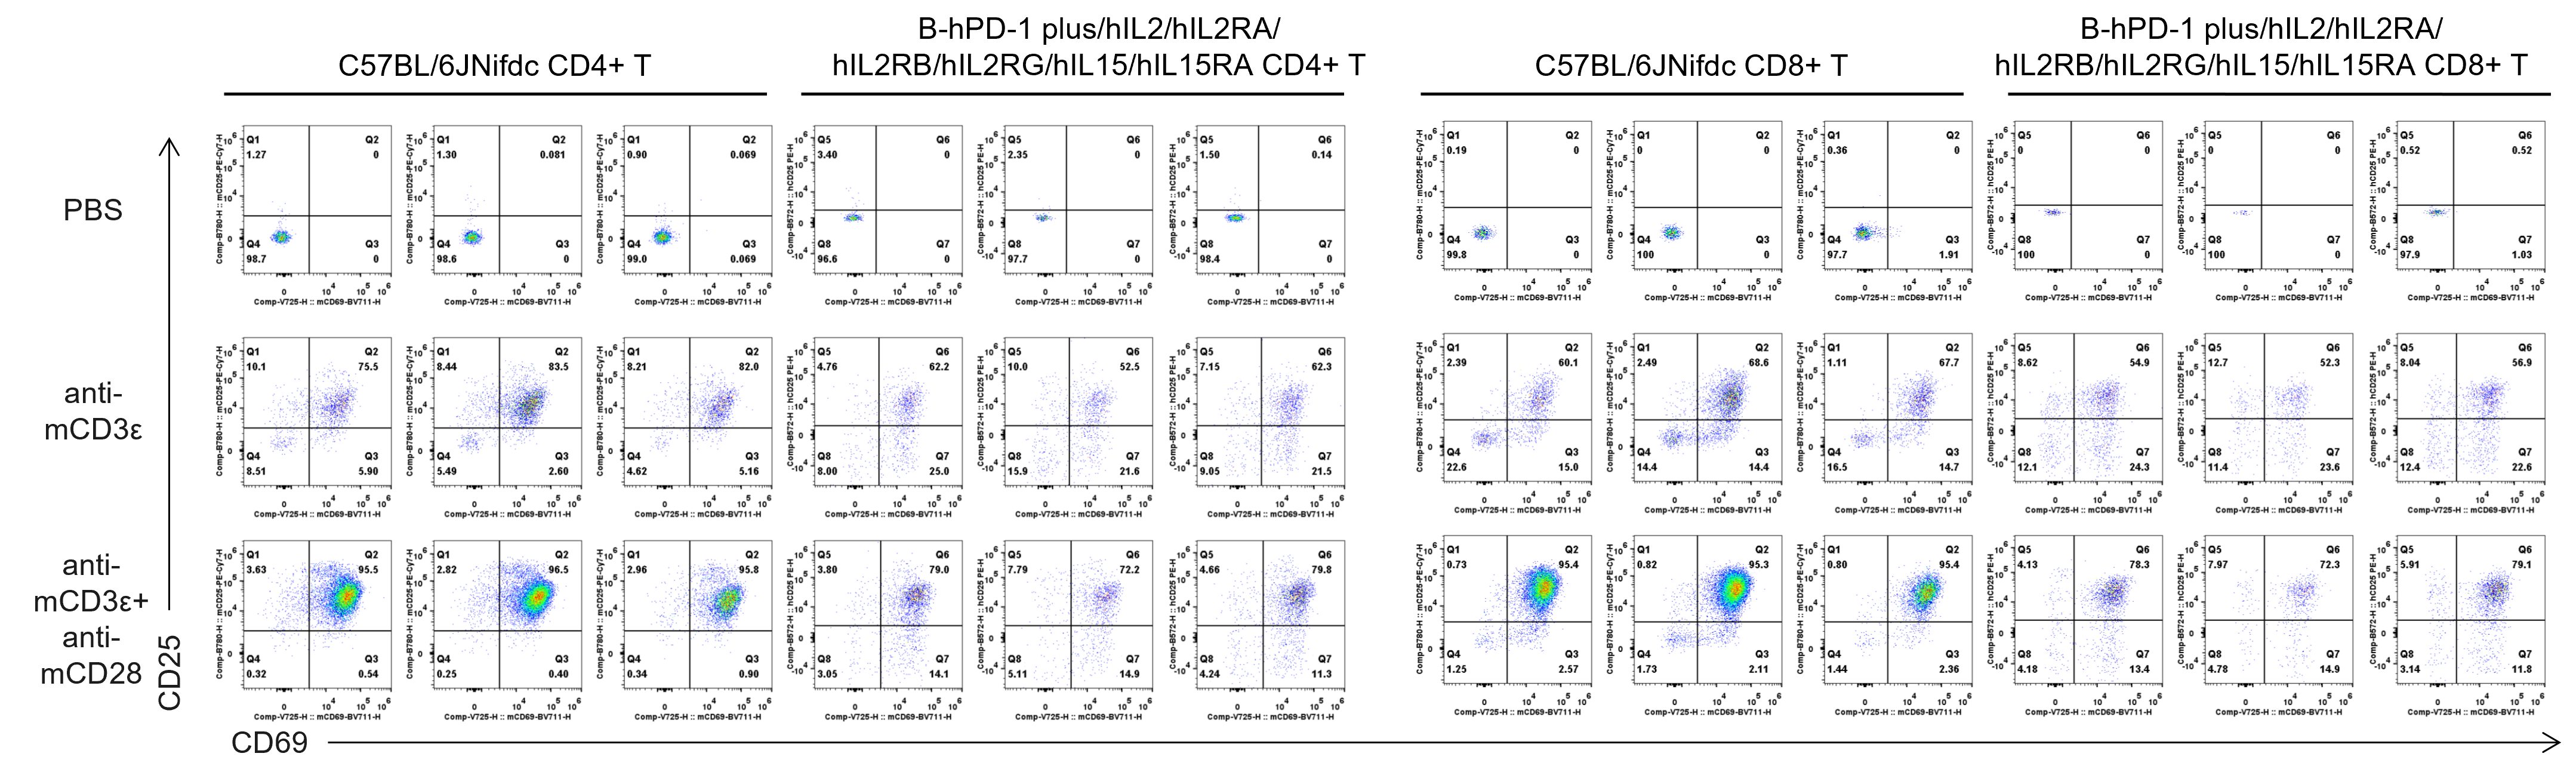
In vitro T cell activation by anti-mCD3ε antibody with or without anti-mCD28 antibody in wild-type C57BL/6JNifdc mice and homozygous B-hPD-1 plus/hIL2/hIL2RA/hIL2RB/hIL2RG/hIL15/hIL15RA mice (48h). T cells were isolated from splenocytes of C57BL/6JNifdc and B-hPD-1 plus/hIL2/hIL2RA/hIL2RB/hIL2RG/hIL15/hIL15RA mice (female, 13-week-old, n=3), and incubated in the presence of anti-mCD3ε antibody (2 ug/ml, BioXcell, BE0001-2), with or witnout anti-mCD28 antibody (5 ug/ml, BioXcell, BE0015-1) for 48h.
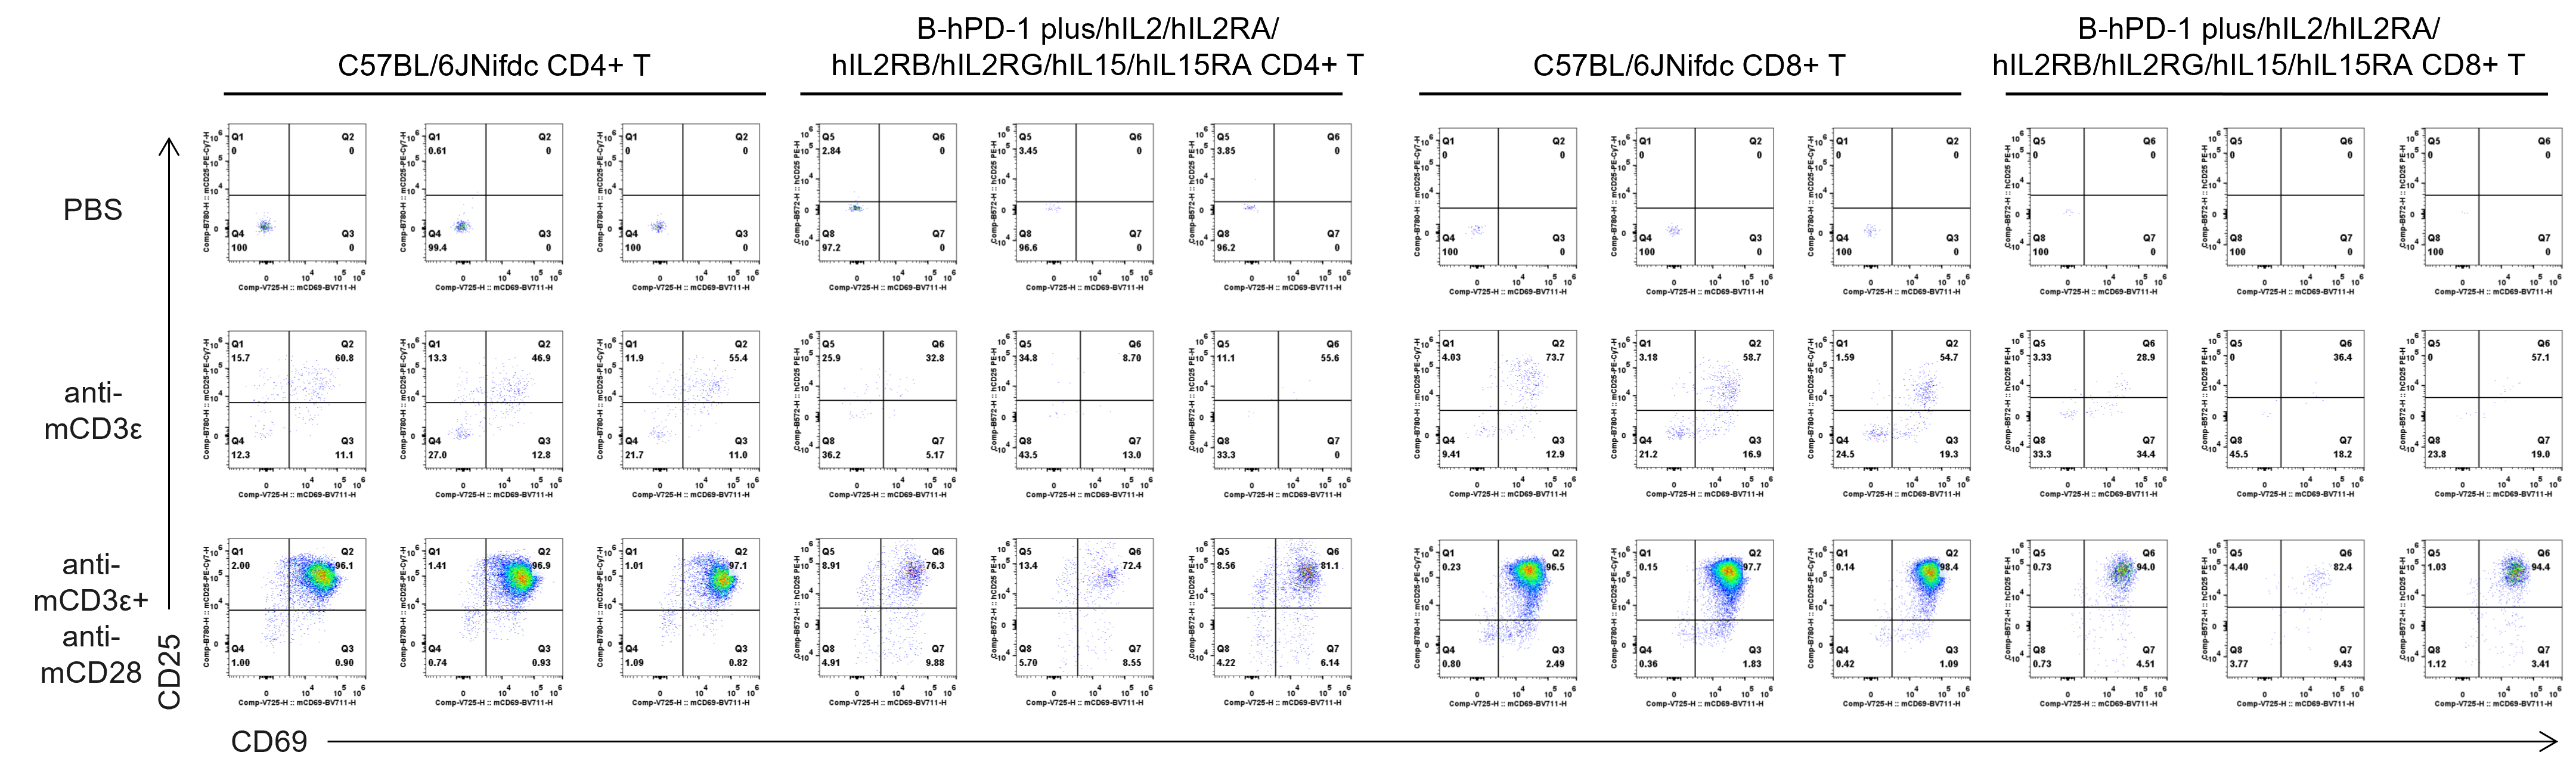
In vitro T cell activation by anti-mCD3ε antibody with or without anti-mCD28 antibody in wild-type C57BL/6JNifdc mice and homozygous B-hPD-1 plus/hIL2/hIL2RA/hIL2RB/hIL2RG/hIL15/hIL15RA mice (72h). T cells were isolated from splenocytes of C57BL/6JNifdc and B-hPD-1 plus/hIL2/hIL2RA/hIL2RB/hIL2RG/hIL15/hIL15RA mice (female, 13-week-old, n=3), and incubated in the presence of anti-mCD3ε antibody (2 ug/ml, BioXcell, BE0001-2), with or witnout anti-mCD28 antibody (5 ug/ml, BioXcell, BE0015-1) for 72h.
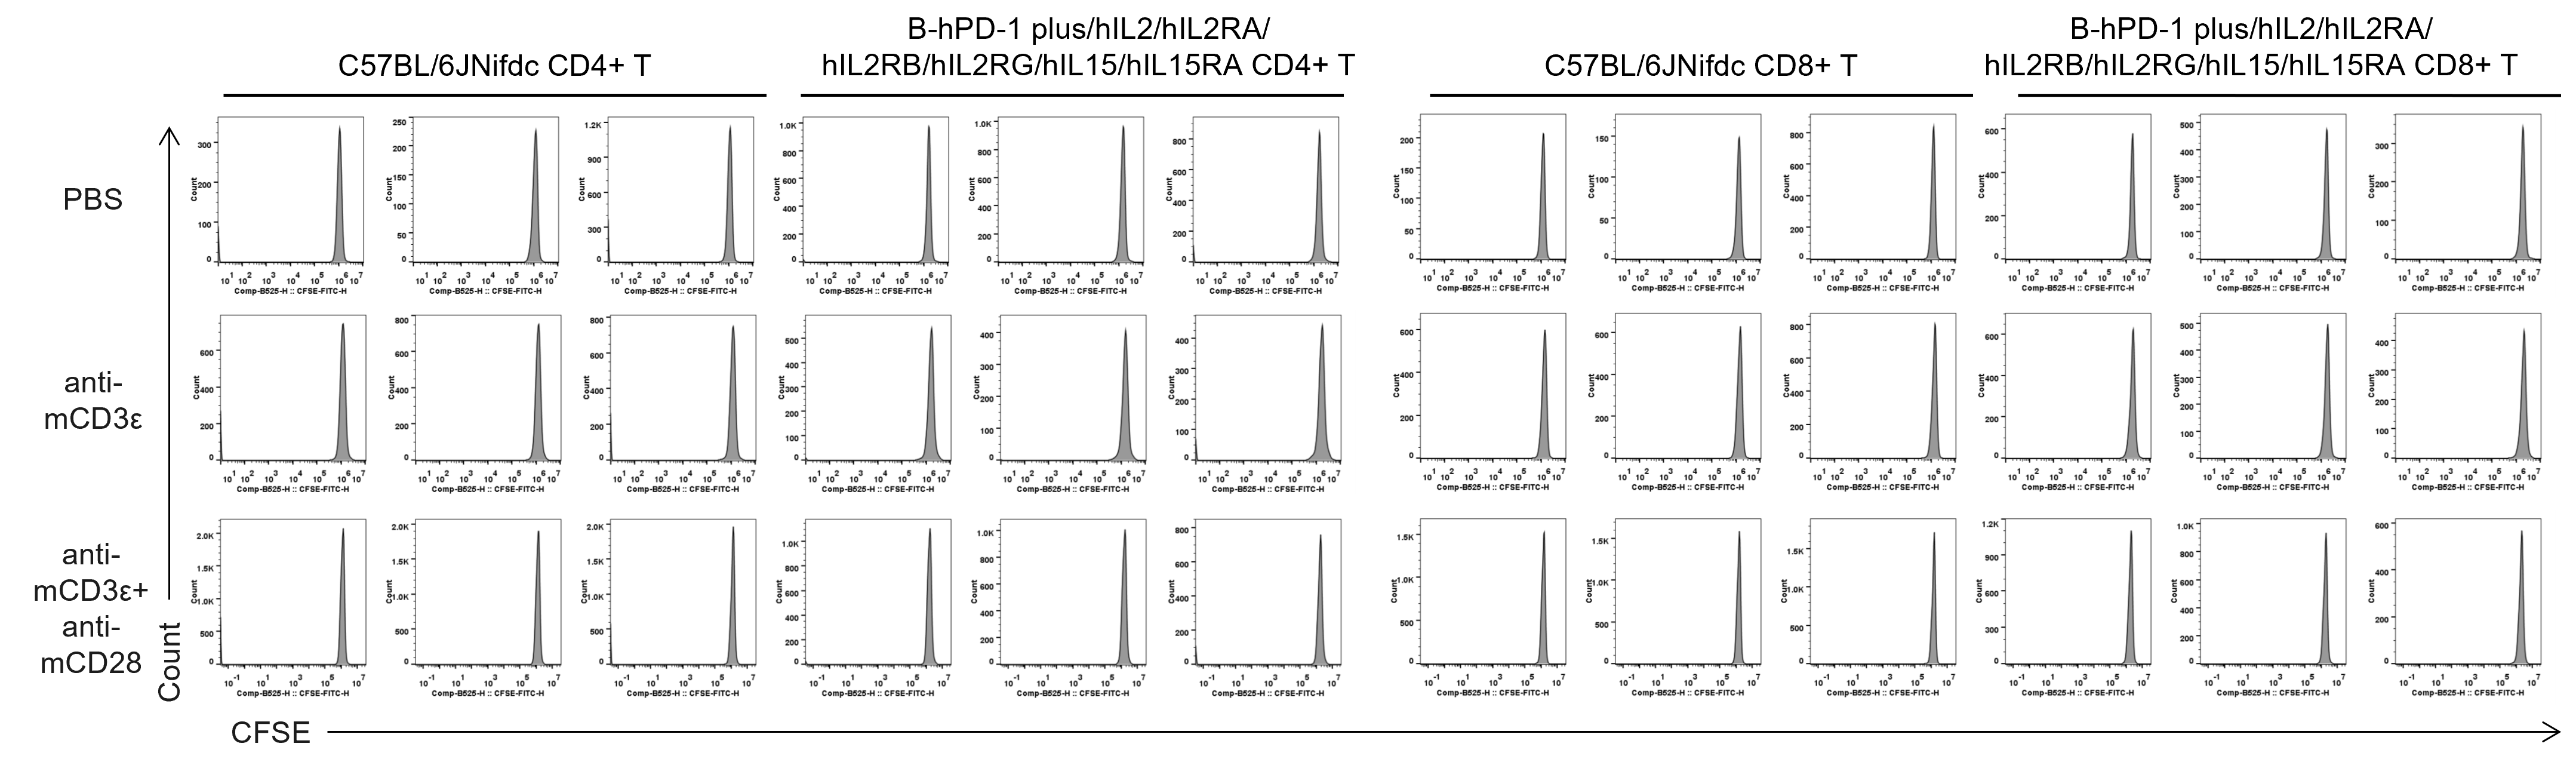
Quantification of T cell proliferation in vitro by anti-CD3ε antibody with or without anti-mCD28 antibody in wild-type C57BL/6JNifdc mice and homozygous B-hPD-1 plus/hIL2/hIL2RA/hIL2RB/hIL2RG/hIL15/hIL15RA mice (24h). T cells were isolated from splenocytes of C57BL/6JNifdc and B-hPD-1 plus/hIL2/hIL2RA/hIL2RB/hIL2RG/hIL15/hIL15RA mice (female, 13-week-old, n=3), and incubated in the presence of anti-mCD3ε antibody (2 ug/ml, BioXcell, BE0001-2), with or witnout anti-mCD28 antibody (5 ug/ml, BioXcell, BE0015-1) for 24h.
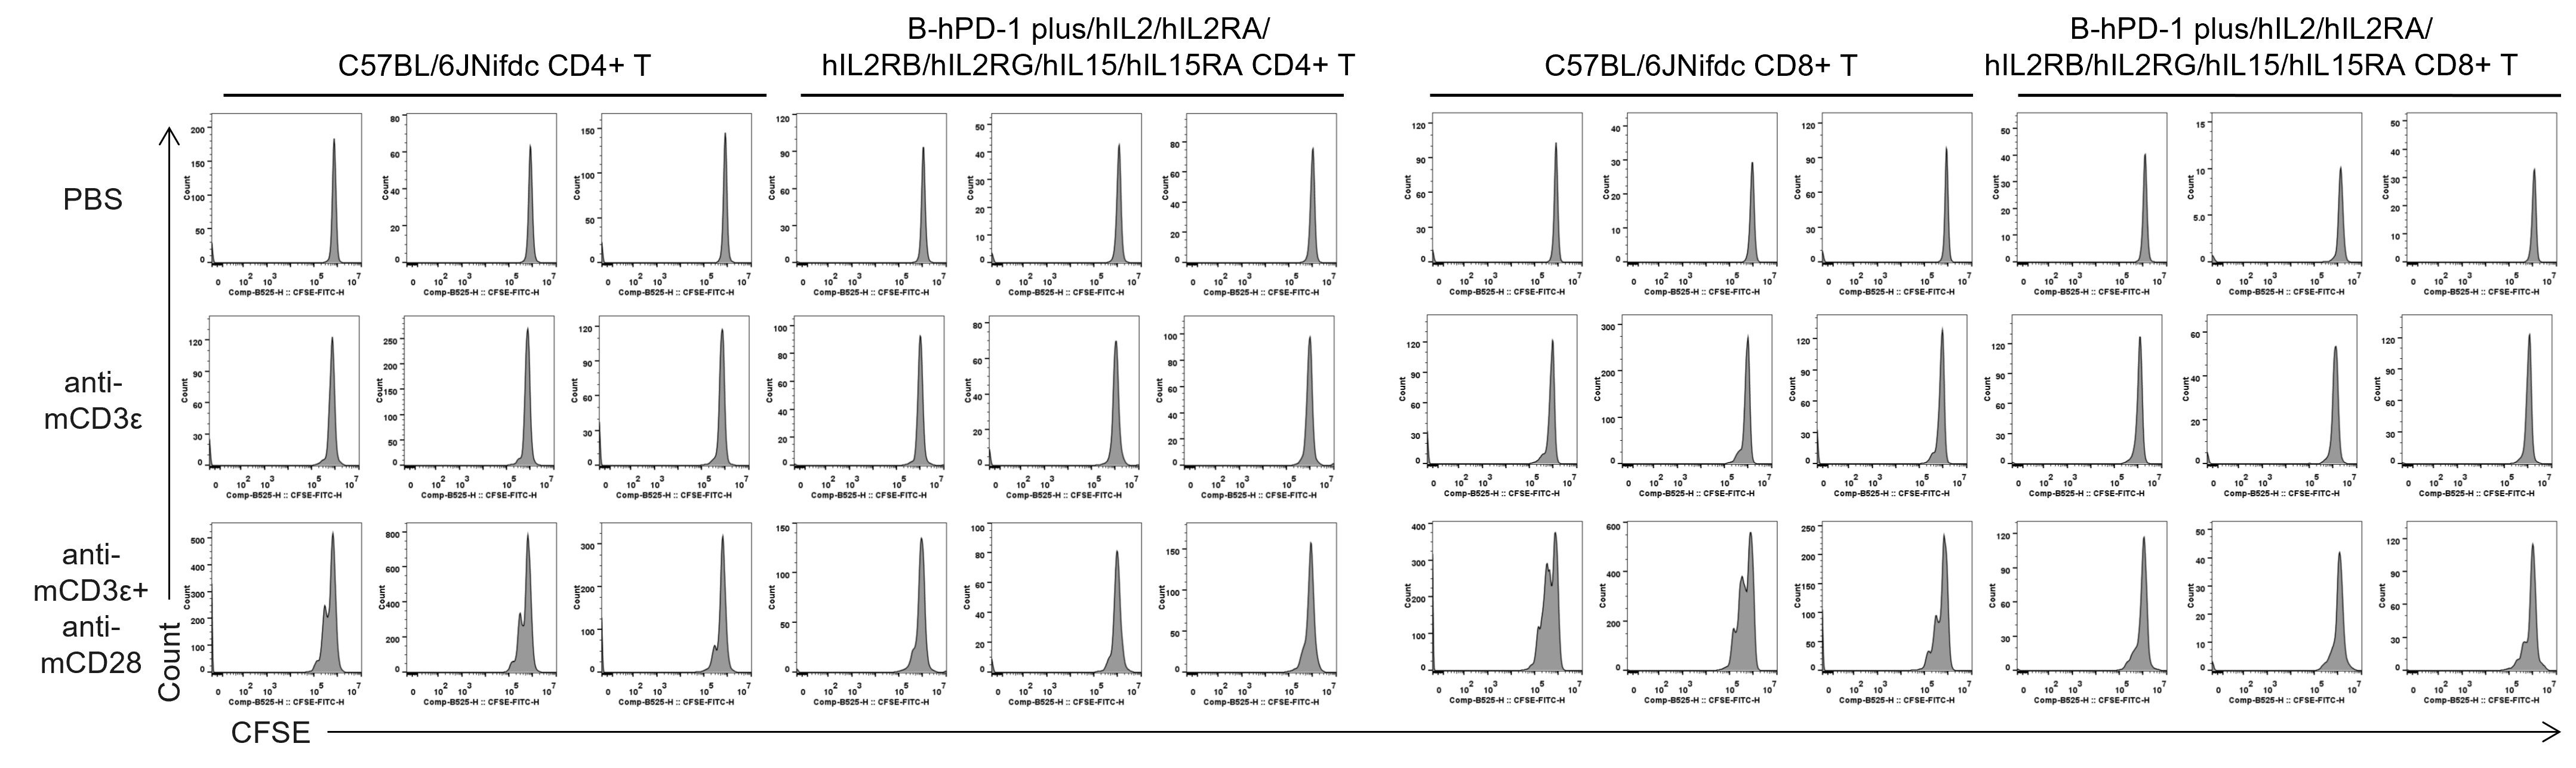
Quantification of T cell proliferation in vitro by anti-CD3ε antibody with or without anti-mCD28 antibody in wild-type C57BL/6JNifdc mice and homozygous B-hPD-1 plus/hIL2/hIL2RA/hIL2RB/hIL2RG/hIL15/hIL15RA mice (48h). T cells were isolated from splenocytes of C57BL/6JNifdc and B-hPD-1 plus/hIL2/hIL2RA/hIL2RB/hIL2RG/hIL15/hIL15RA mice (female, 13-week-old, n=3), and incubated in the presence of anti-mCD3ε antibody (2 ug/ml, BioXcell, BE0001-2), with or witnout anti-mCD28 antibody (5 ug/ml, BioXcell, BE0015-1) for 48h.
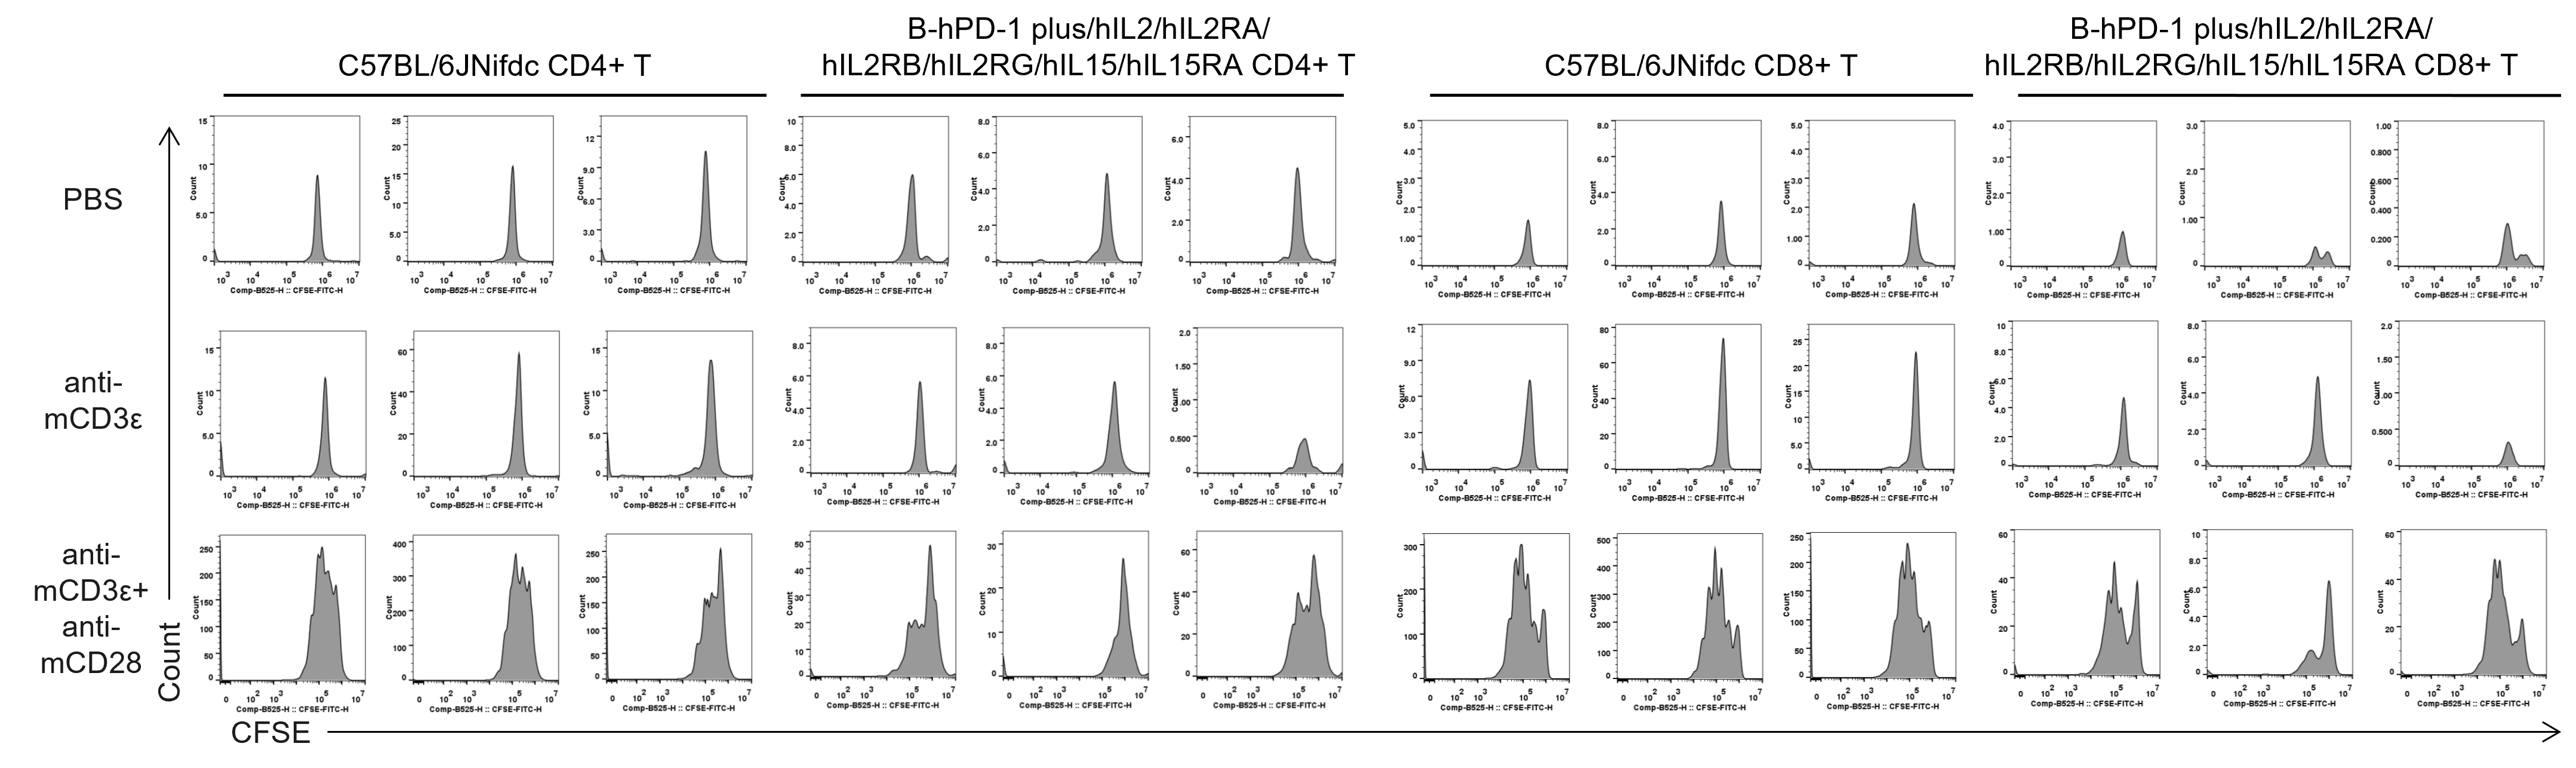
Quantification of T cell proliferation in vitro by anti-CD3ε antibody with or without anti-mCD28 antibody in wild-type C57BL/6JNifdc mice and homozygous B-hPD-1 plus/hIL2/hIL2RA/hIL2RB/hIL2RG/hIL15/hIL15RA mice (72h). T cells were isolated from splenocytes of C57BL/6JNifdc and B-hPD-1 plus/hIL2/hIL2RA/hIL2RB/hIL2RG/hIL15/hIL15RA mice (female, 13-week-old, n=3), and incubated in the presence of anti-mCD3ε antibody (2 ug/ml, BioXcell, BE0001-2), with or witnout anti-mCD28 antibody (5 ug/ml, BioXcell, BE0015-1) for 72h.
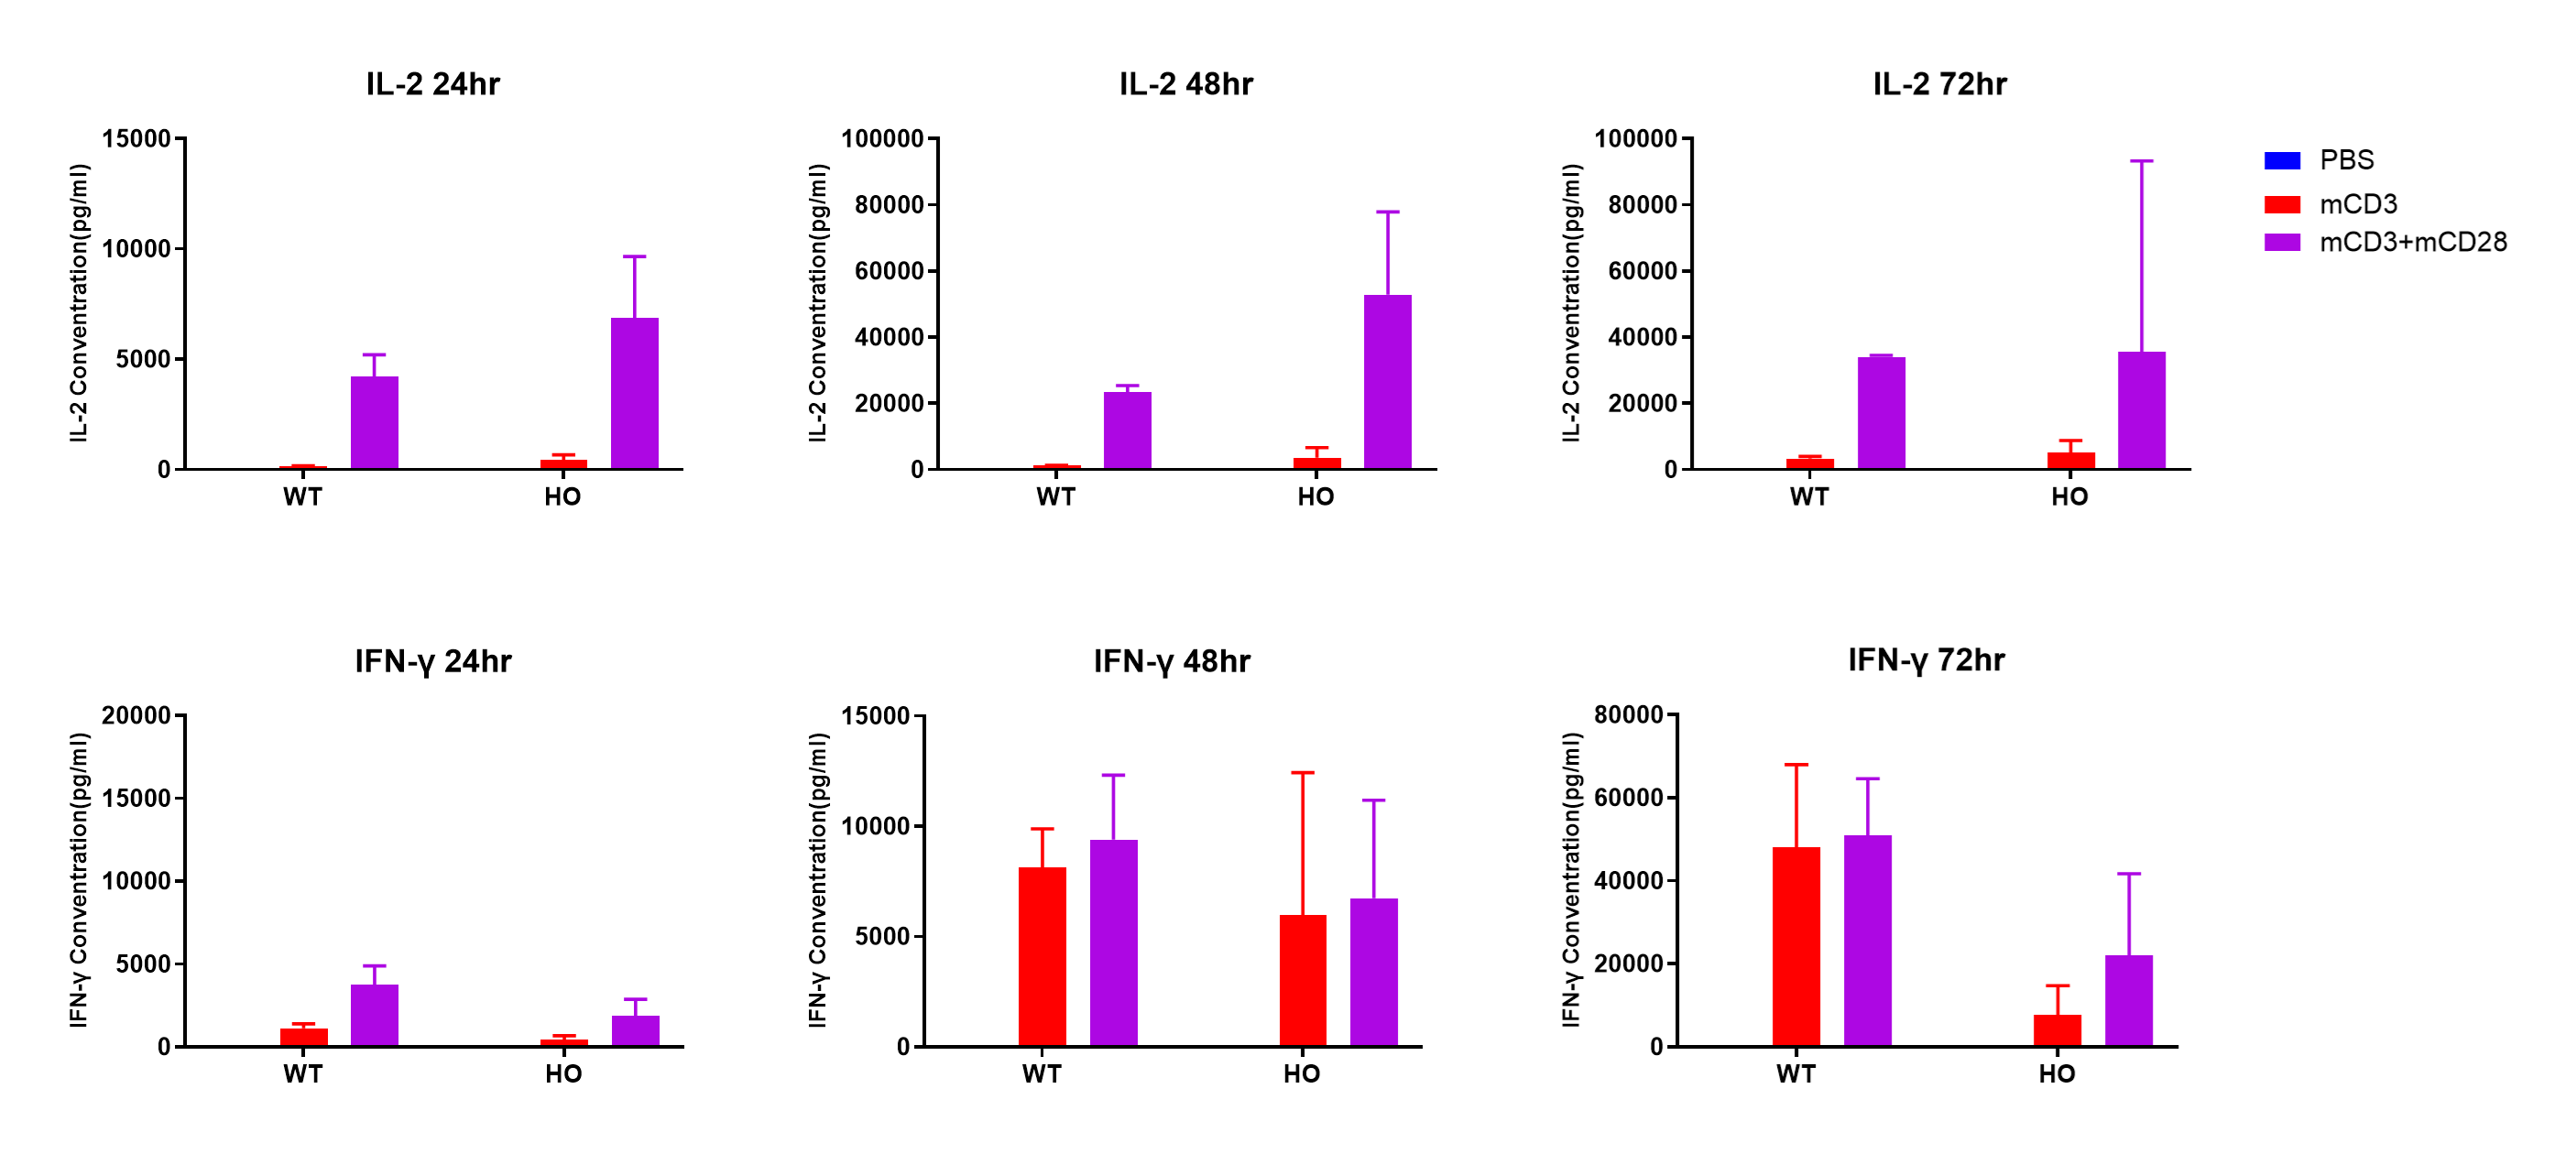
In vitro cytokine production (IFN-γ and IL-2) in B-hPD-1 plus/hIL2/hIL2RA/hIL2RB/hIL2RG/hIL15/hIL15RA mice. T cells (2×10⁵) were isolated from the splenocytes of C57BL/6JNifdc and B-hPD-1 plus/hIL2/hIL2RA/hIL2RB/hIL2RG/hIL15/hIL15RA mice (female, 13-week-old, n = 3), incubated in the presence of anti-mouse CD3ε antibody (BioXCell, BE0001-1, clone 145-2C11, 2 ug/ml) and anti-mCD28 antibody (BioXCell, BE0015-1, clone 37.51, 5 ug/ml) for 24h, 48h and 72h. IFN-γ and IL-2 productions were then tested using ELISA method.
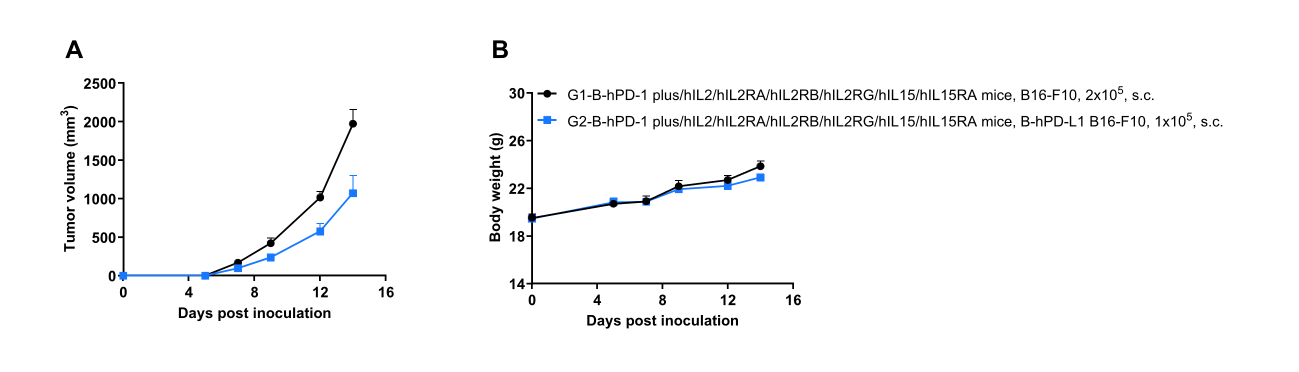
Subcutaneous tumor growth of B-hPD-L1 B16-F10 cells. B-hPD-L1 B16-F10 cells (1×10⁵) and wild-type B16-F10 cells (2×10⁵) were subcutaneously implanted into B-hPD-1 plus/hIL2/hIL2RA/hIL2RB/hIL2RG/hIL15/hIL15RA mice (female, 7-week-old, n=6). Tumor volume and body weight were measured three times a week. (A) Average tumor volume. (B) Body weight. Volume was expressed in mm3 using the formula: V=0.5 × long diameter × short diameter2. Results indicate that B-hPD-L1 B16-F10 cells were able to establish tumors in vivo and can be used for efficacy studies. Values are expressed as mean ± SEM.
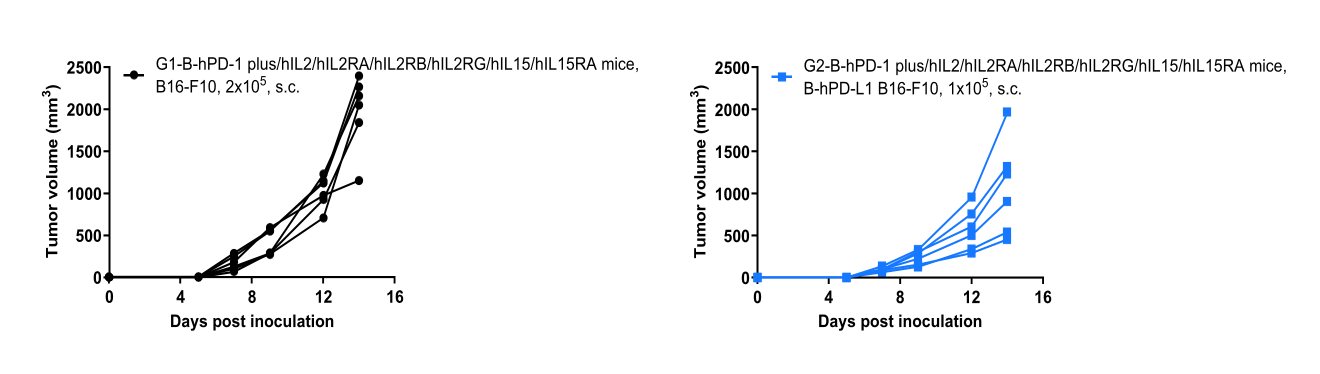
B-hPD-L1 B16-F10 tumor growth curves from individual mice. B-hPD-L1 B16-F10 cells (1×10⁵) and wild-type B16-F10 cells (2×10⁵) were subcutaneously implanted into B-hPD-1 plus/hIL2/hIL2RA/hIL2RB/hIL2RG/hIL15/hIL15RA mice (female, 7-week-old, n=6). Results indicate that B-hPD-L1 B16-F10 cells were able to establish tumors in vivo and can be used for efficacy studies. Values are expressed as mean ± SEM.
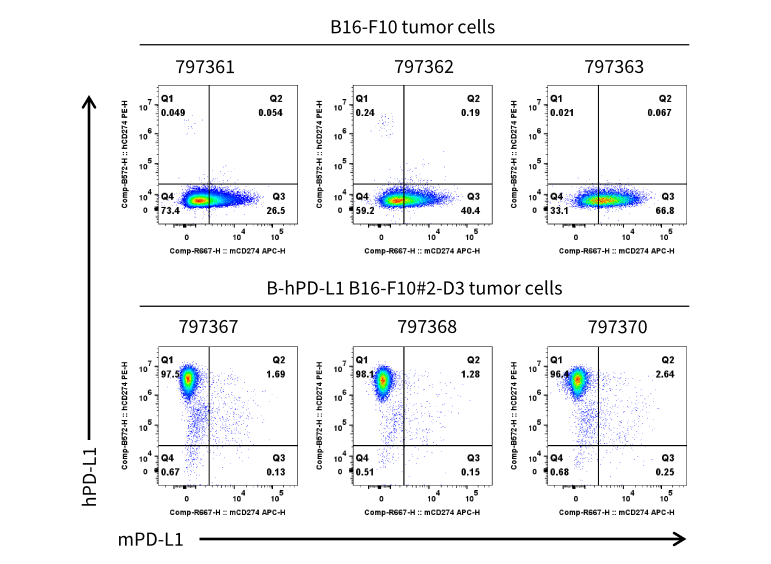
PD-L1 expression evaluated on B-hPD-L1 B16-F10 tumor cells by flow cytometry. B-hPD-L1 B16-F10 cells were subcutaneously transplanted into B-hPD-1 plus/hIL2/hIL2RA/hIL2RB/hIL2RG/hIL15/hIL15RA mice (female, 7-week-old, n=6). At the end of the experiment, tumor cells were harvested and assessed for mouse PD-L1(BioLegend, 124312) and human PD-L1(BioLegend, 329706) expression by flow cytometry. As shown, human PD-L1 was highly expressed on the surface of tumor cells. Therefore, B-hPD-L1 B16-F10 cells can be used for in vivo efficacy studies evaluating novel PD-L1 therapeutics.
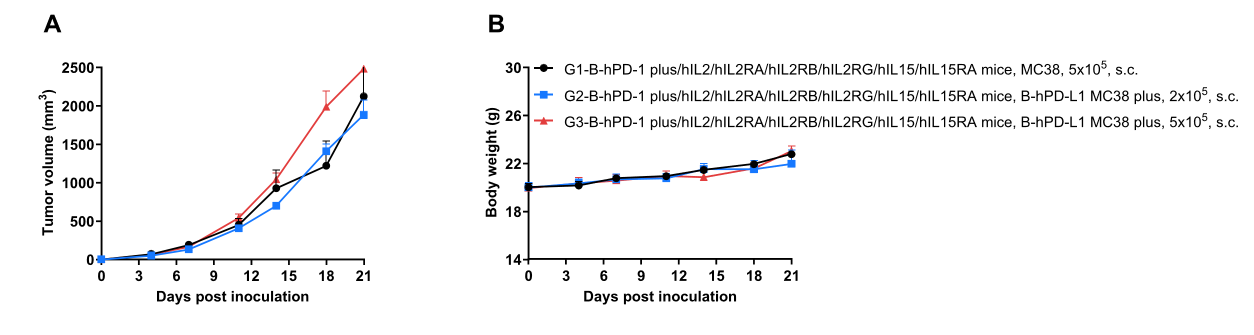
Subcutaneous tumor growth of B-hPD-L1 MC38 plus cells. B-hPD-L1 MC38 cells (2×10⁵ and 5×10⁵) and wild-type MC38 cells (5×10⁵) were subcutaneously implanted into B-hPD-1 plus/hIL2/hIL2RA/hIL2RB/hIL2RG/hIL15/hIL15RA mice (female, 9-week-old, n=6). Tumor volume and body weight were measured three times a week. (A) Average tumor volume. (B) Body weight. Volume was expressed in mm3 using the formula: V=0.5 × long diameter × short diameter2. Results indicate that B-hPD-L1 MC38 plus cells were able to establish tumors in vivo and can be used for efficacy studies. Values are expressed as mean ± SEM.
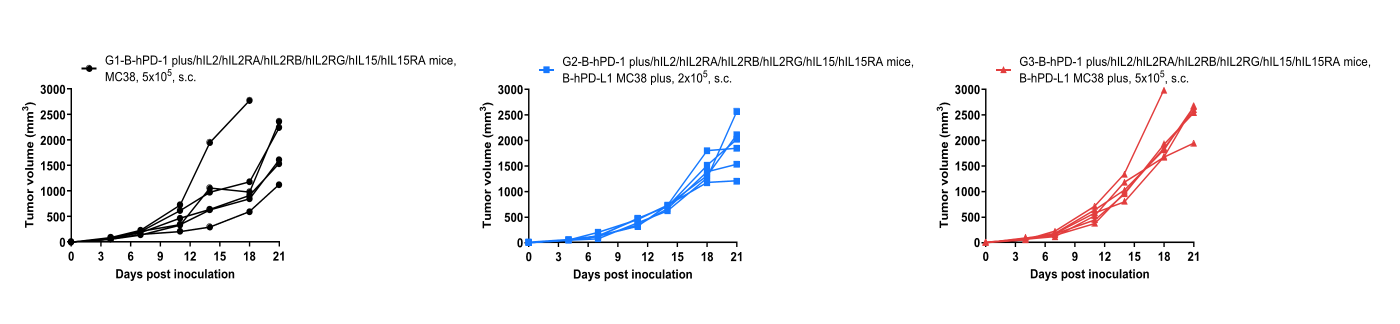
B-hPD-L1 MC38 plus tumor growth curves from individual mice. B-hPD-L1 MC38 cells (2×10⁵ and 5×10⁵) and wild-type MC38 cells (5×10⁵) were subcutaneously implanted into B-hPD-1 plus/hIL2/hIL2RA/hIL2RB/hIL2RG/hIL15/hIL15RA mice (female, 9-week-old, n=6). Results indicate that B-hPD-L1 MC38 plus cells were able to establish tumors in vivo and can be used for efficacy studies. Values are expressed as mean ± SEM.
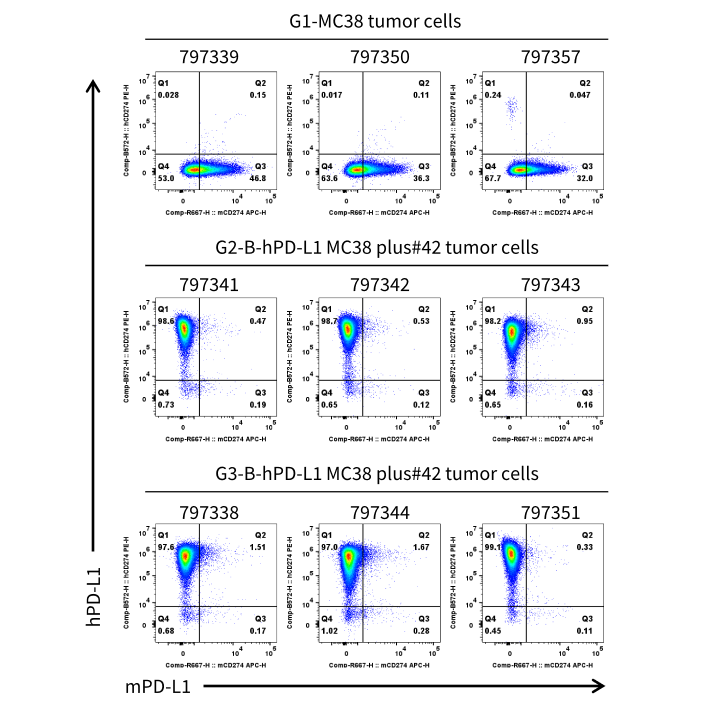
PD-L1 expression evaluated on B-hPD-L1 MC38 plus tumor cells by flow cytometry. B-hPD-L1 MC38 plus cells were subcutaneously transplanted into B-hPD-1 plus/hIL2/hIL2RA/hIL2RB/hIL2RG/hIL15/hIL15RA mice (female, 9-week-old, n=6). At the end of the experiment, tumor cells were harvested and assessed for mouse PD-L1 (BioLegend, 124312) and human PD-L1 (BioLegend, 329706) expression by flow cytometry. As shown, human PD-L1 was highly expressed on the surface of tumor cells. Therefore, B-hPD-L1 MC38 plus cells can be used for in vivo efficacy studies evaluating novel PD-L1 therapeutics.

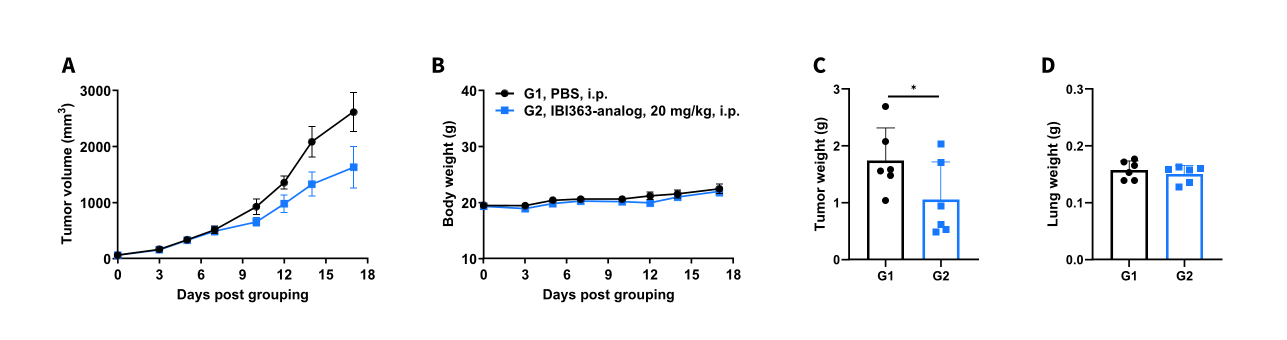
Antitumor activity of IBI363-analog against syngeneic tumors. (A) Tumor growth curves. (B) Body weight changes during treatment. (C) Tumor weight. (D) Lung weight. As shown in panel A, IBI363-analog (provided by the client) was efficacious in controlling tumor growth in B-hPD-1plus/hIL2/hIL2RA/hIL2RB/hIL2RG/hIL15/hIL15RA mice, demonstrating that B-hPD-1plus/hIL2/hIL2RA/hIL2RB/hIL2RG/hIL15/hIL15RA mice provide a powerful preclinical model for in vivo evaluation of PD-1/IL2 bispecific antibodies. The overage of this tumor model is 40%.
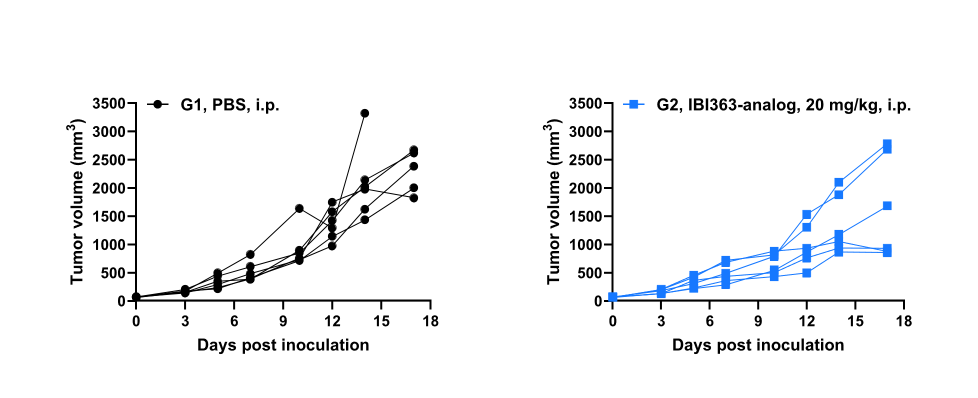
Antitumor activity of IBI363-analog and Keytruda-analog against syngeneic tumors. Tumor cells growth of individual mouse. These results demonstrate that B-hPD-1plus/hIL2/hIL2RA/hIL2RB/hIL2RG/hIL15/hIL15RA mice provide a powerful preclinical model for in vivo evaluation of PD-1/IL2 bispecific antibodies
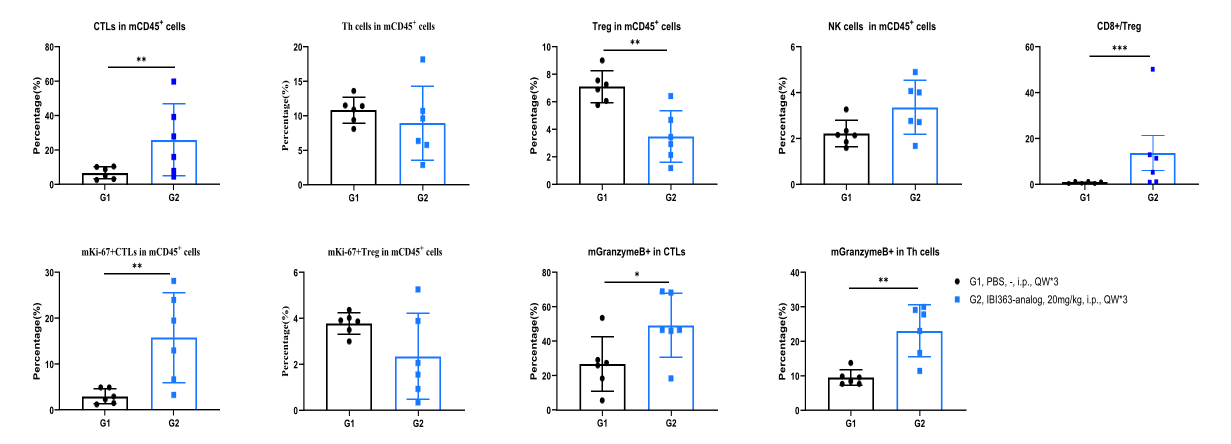
IBI363-analog significantly remodels intratumoral T cell infiltration and effector phenotypes in B-hPD-L1 MC38 plus tumor-bearing B-hPD-1plus/hIL2/hIL2RA/hIL2RB/hIL2RG/hIL15/hIL15RA mice. B-hPD-L1 MC38 plus tumor cells were subcutaneously inoculated into B-hPD-1 plus/hIL2/hIL2RA/hIL2RB/hIL2RG/hIL15/hIL15RA mice. Tumor-infiltrating lymphocytes (TILs) were isolated at the end of the study and analyzed by flow cytometry.
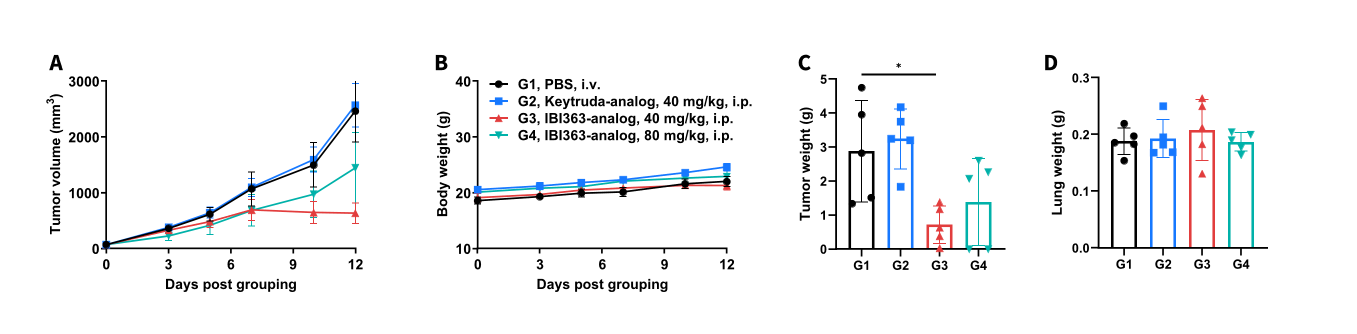
Antitumor activity of IBI363-analog and Keytruda analog against syngeneic tumors. (A) Tumor growth curves. (B) Body weight changes during treatment. As shown in panel A, IBI363-analog (provided by the client) was efficacious in controlling tumor growth in B-hPD-1plus/hIL2/hIL2RA/hIL2RB/hIL2RG/hIL15/hIL15RA mice, demonstrating that B-hPD-1plus/hIL2/hIL2RA/hIL2RB/hIL2RG/hIL15/hIL15RA mice provide a powerful preclinical model for in vivo evaluation of PD-1/IL2 bispecific antibodies. The overage of this tumor model is 40%.
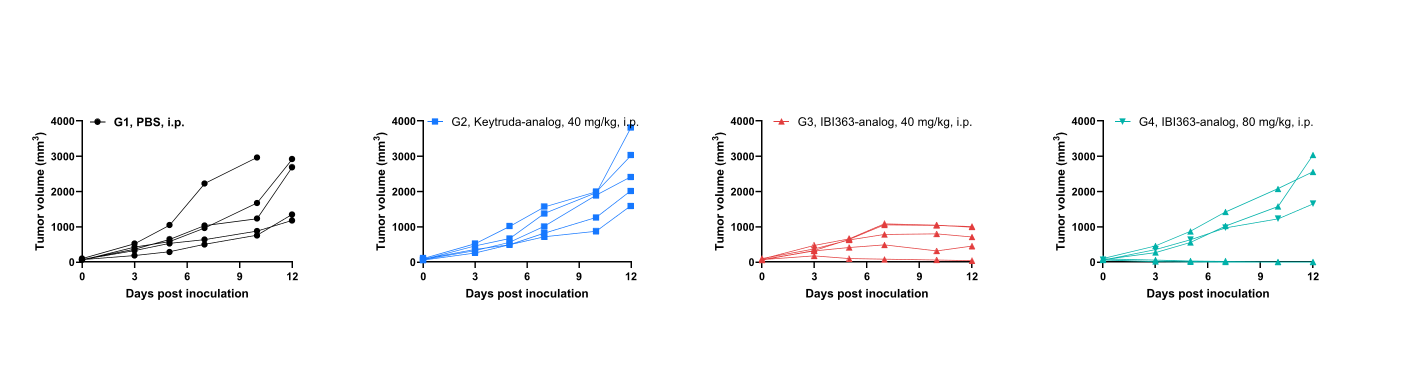
Antitumor activity of IBI363-analog and Keytruda-analog against syngeneic tumors. Tumor cells growth of individual mouse. These results demonstrate that B-hPD-1 plus/hIL2/hIL2RA/hIL2RB/hIL2RG/hIL15/hIL15RA mice provide a powerful preclinical model for in vivo evaluation of PD-1/IL2 bispecific antibodies.
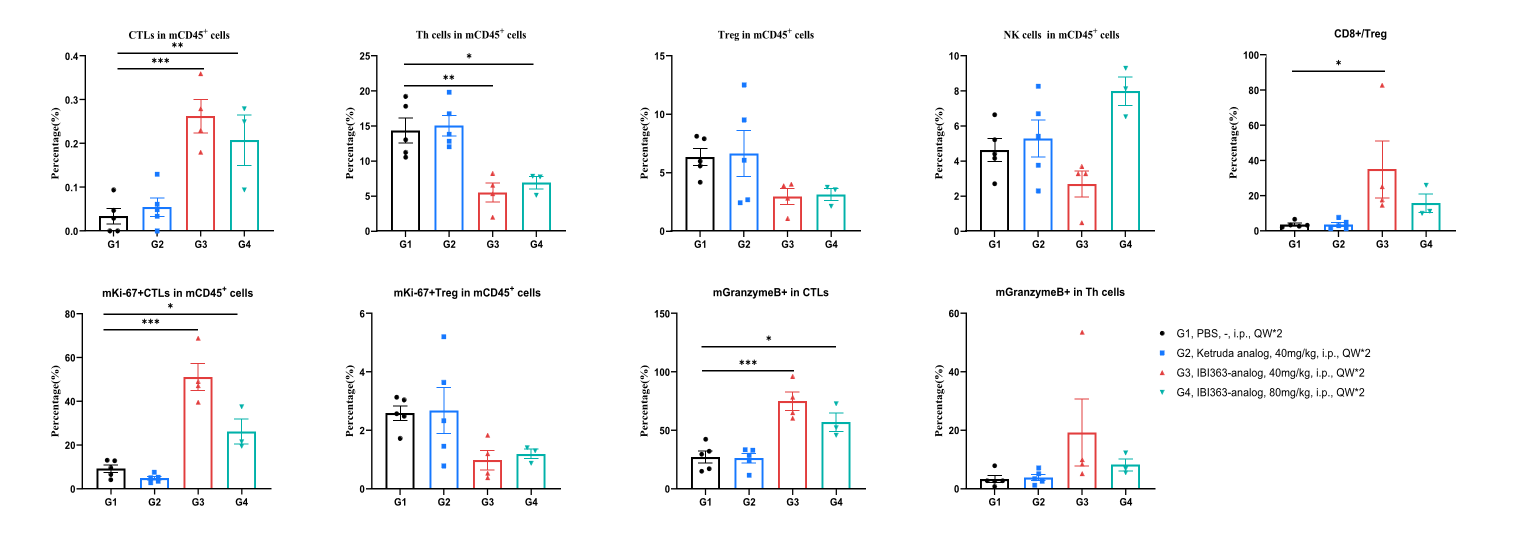
IBI363-analog significantly remodels intratumoral T cell infiltration and effector phenotypes in B-hPD-L1 B16-F10 tumor-bearing B-hPD-1plus/hIL2/hIL2RA/hIL2RB/hIL2RG/hIL15/hIL15RA mice. B-hPD-L1 B16-F10 tumor cells were subcutaneously inoculated into B-hPD-1 plus/hIL2/hIL2RA/hIL2RB/hIL2RG/hIL15/hIL15RA mice. Tumor-infiltrating lymphocytes (TILs) were isolated at the end of the study and analyzed by flow cytometry.