

C57BL/6-Cd3etm1(CD3E)Bcgen Cd3dtm1(CD3D)Bcgen Cd3gtm1(CD3G)Bcgen Cd19tm7(CD19)Bcgen Tnfrsf17tm2(TNFRSF17)Bcgen • 115147

Mechanism and Clinical Applications of CD19- and BCMA-Targeting TCEs
Gene Information:
Protein Expression:
Key Advantages
Key Applications

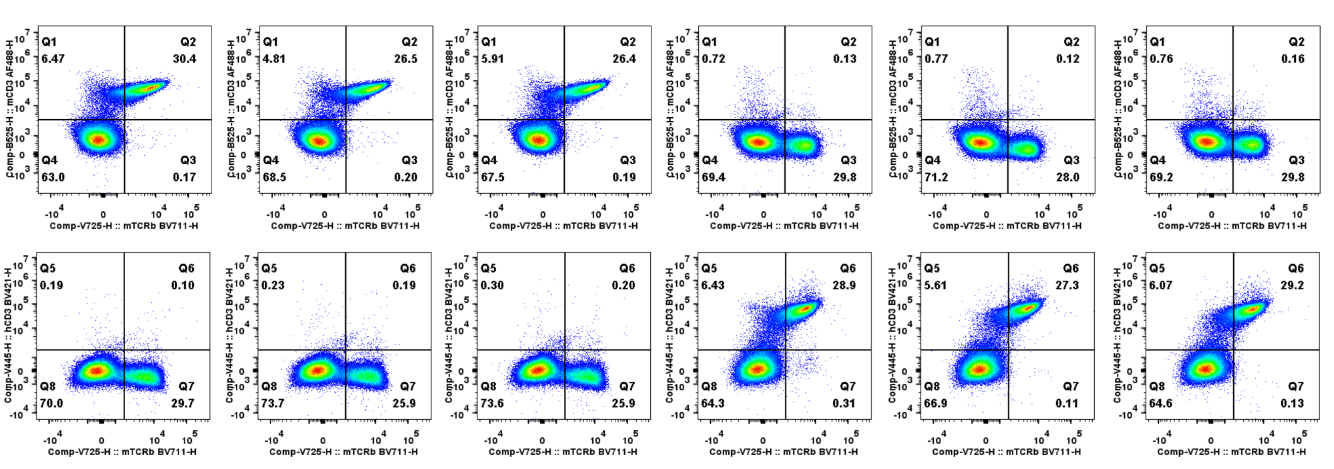
Mouse and human CD3E expression analysis in splenocytes. Splenocytes were collected from wild-type C57BL/6 mice and homozygous B-hCD3EDG/hCD19ad/hBCMA mice (male, 6-week-old, n = 3). CD3E expression on T cells was analyzed by flow cytometry using species-specific anti-CD3E antibodies (anti-human CD3E antibody, Biolegend, 317344; anti-mouse CD3E antibody, Biolegend, 100210).
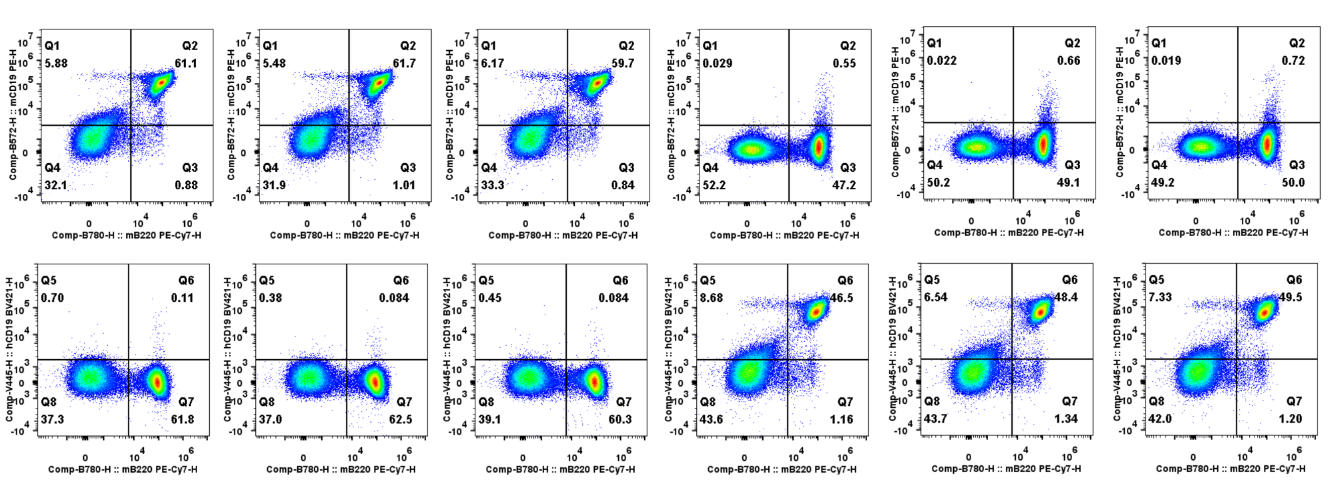
Mouse and human CD19 expression analysis in splenocytes. Splenocytes were collected from wild-type C57BL/6 mice and homozygous B-hCD3EDG/hCD19ad/hBCMA mice (male, 6-week-old, n = 3). CD19 expression on B cells was analyzed by flow cytometry using species-specific anti-CD19 antibodies (anti-human CD19 antibody, Biolegend, 302234; anti-mouse CD19 antibody, Biolegend, 115507).
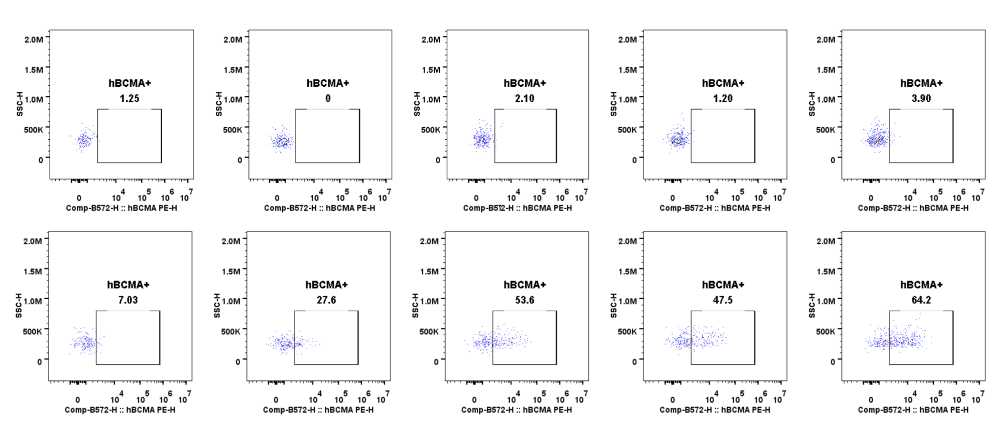
Human BCMA expression analysis in splenocytes. Spleen cells were collected from wild-type C57BL/6 mice (male, 6-week-old) and homozygous B-hCD3EDG/hCD19 ad/hBCMA mice (male, 6-week-old). Human BCMA expression on plasma cells was analyzed by flow cytometry using anti-human BCMA antibody (Biolegend, 357504). Mice were stimulated with LPS and treated with γ-secretase inhibitor to enhance membrane BCMA expression.

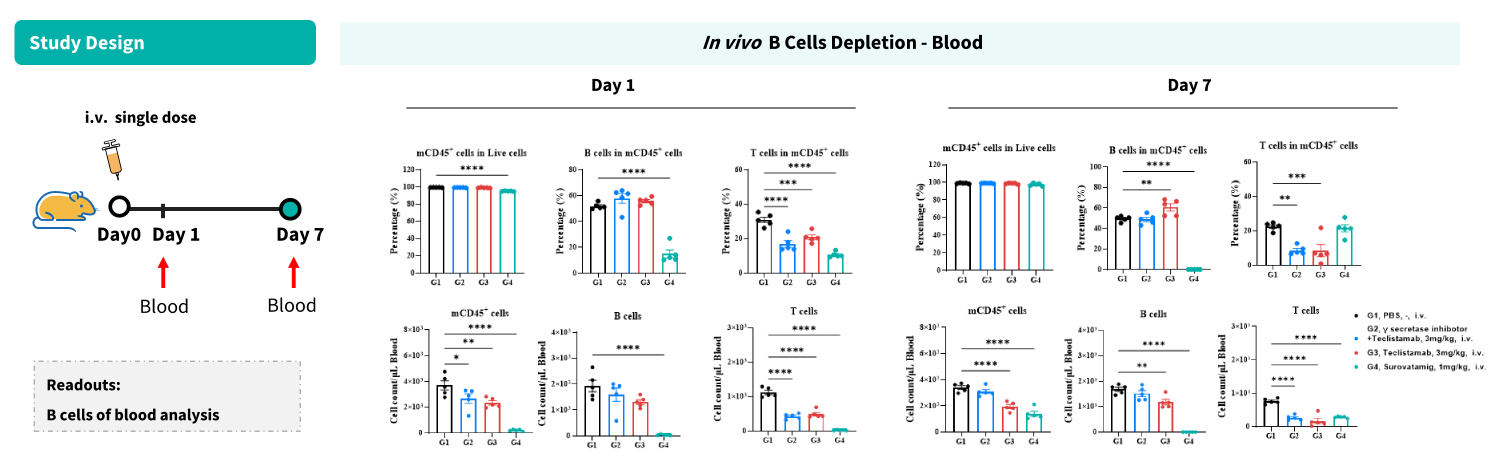
In vivo B-cell depletion by anti-human CD3/BCMA or anti-human CD3/CD19 bispecific antibodies (BsAbs) in B-hCD3EDG/hCD19 ad/hBCMA mice. Bispecific antibodies (Teclistamab: targeting BCMA/CD3; Surovatamig: targeting CD19/CD3) or PBS control were administered as a single dose to B-hCD3EDG/hCD19 ad/hBCMA mice (n=3 per group). Blood cells were harvested on day 1 and day 7 post-treatment. The frequency and absolute numbers of mCD45⁺ cells, B cells, and T cells were quantified by flow cytometry. Data was shown as Mean ± SEM, and analyzed using One way ANOVA followed Dunnett's multiple comparisons test compared with G1(Control group). (*p<0.05, ***p<0.001, ****p<0.0001)
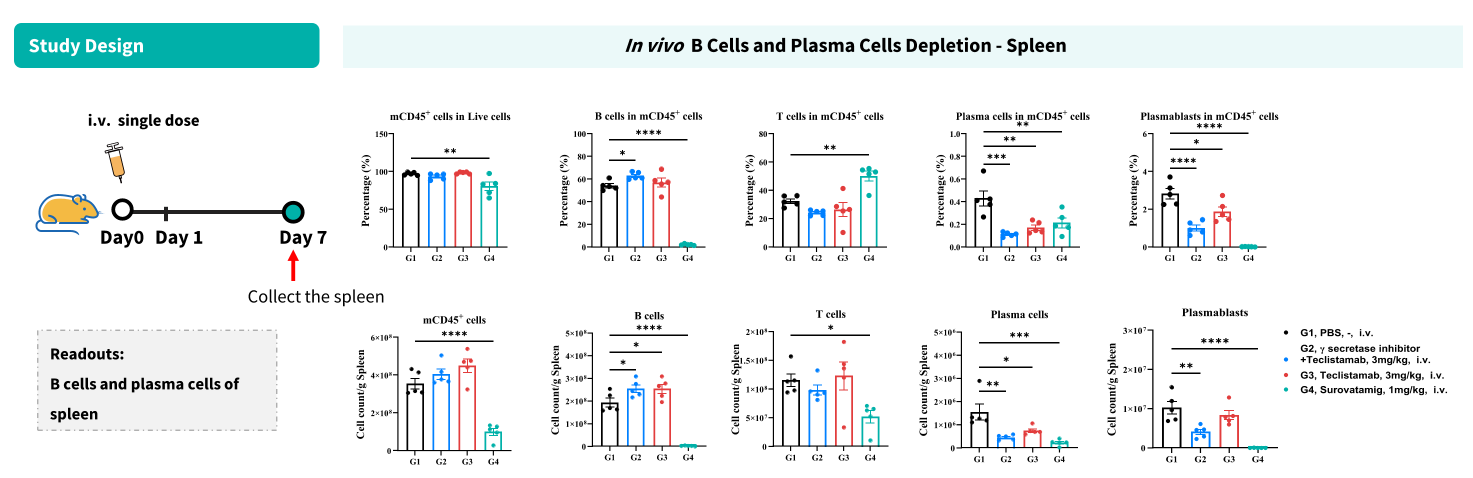
In vivo depletion of B cells and plasma cells by anti-CD19/CD3 and anti-BCMA/CD3 bispecific antibodies (BsAbs) in B-hCD3EDG/hCD19 ad/hBCMA mice. Bispecific antibodies (Teclistamab: targeting BCMA/CD3; Surovatamig: targeting CD19/CD3) or PBS control were administered as a single dose to B-hCD3EDG/hCD19 ad/hBCMA mice (n=3 per group). Spleen cells were harvested on day 7 post-treatment. The frequency and absolute numbers of mCD45⁺ cells, B cells, T cells, plasma cells, and plasmablasts were quantified by flow cytometry. Data was shown as Mean ± SEM, and analyzed using One way ANOVA followed Dunnett's multiple comparisons test compared with G1 (Control group). (*p<0.05, ***p<0.001, ****p<0.0001)
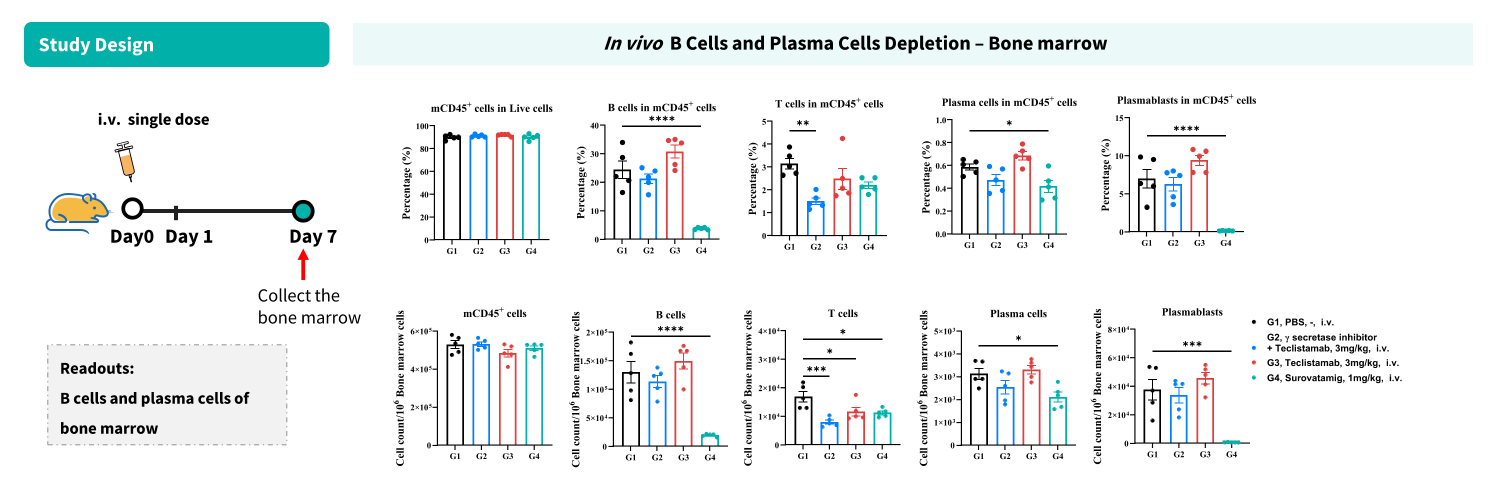
In vivo depletion of B cells and plasma cells by anti-CD19/CD3 and anti-BCMA/CD3 bispecific antibodies (BsAbs) in B-hCD3EDG/hCD19 ad/hBCMA mice. Bispecific antibodies (Teclistamab: targeting BCMA/CD3; Surovatamig: targeting CD19/CD3) or PBS control were administered as a single dose to B-hCD3EDG/hCD19 ad/hBCMA mice (n=3 per group). Bone marrow were harvested on day 7 post-treatment. The frequency and absolute numbers of mCD45⁺ cells, B cells, T cells, plasma cells, and plasmablasts were quantified by flow cytometry. Data was shown as Mean ± SEM, and analyzed using One way ANOVA followed Dunnett's multiple comparisons test compared with G1 (Control group). (*p<0.05, ***p<0.001, ****p<0.0001)