on this page
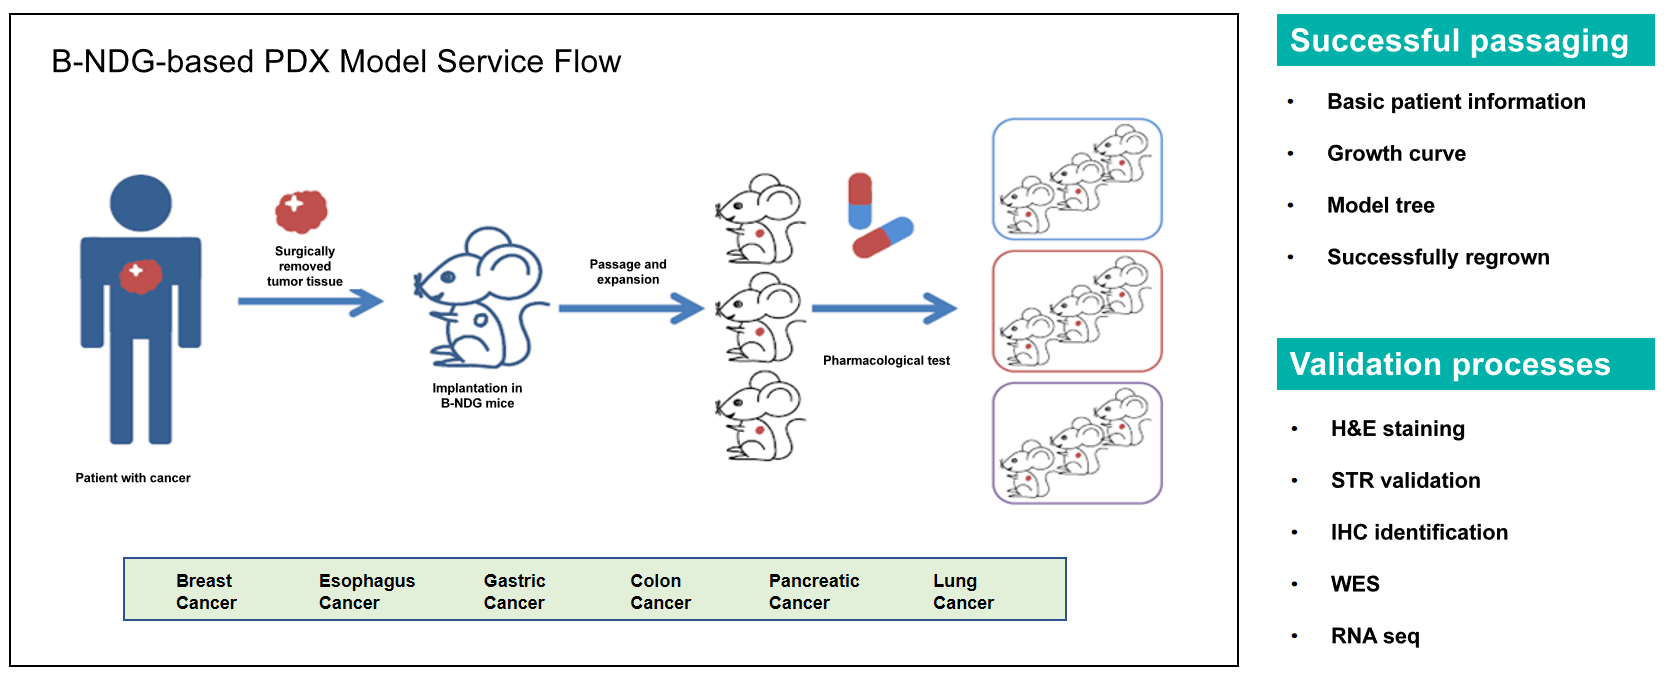
Patient-derived xenograft (PDX) models, in which patient tumor samples are implanted into immunodeficient mice, effectively recapitulate the characteristics of human cancers. Leveraging optimized PDX engraftment procedures and advanced technologies, Biocytogen provides highly reliable xenograft mouse models for in vivo oncology research. These PDX models serve as a powerful platform for preclinical evaluation of novel cancer drugs, validation of combination therapies, identification of drug-sensitive patient populations, and investigation of mechanisms of drug resistance.
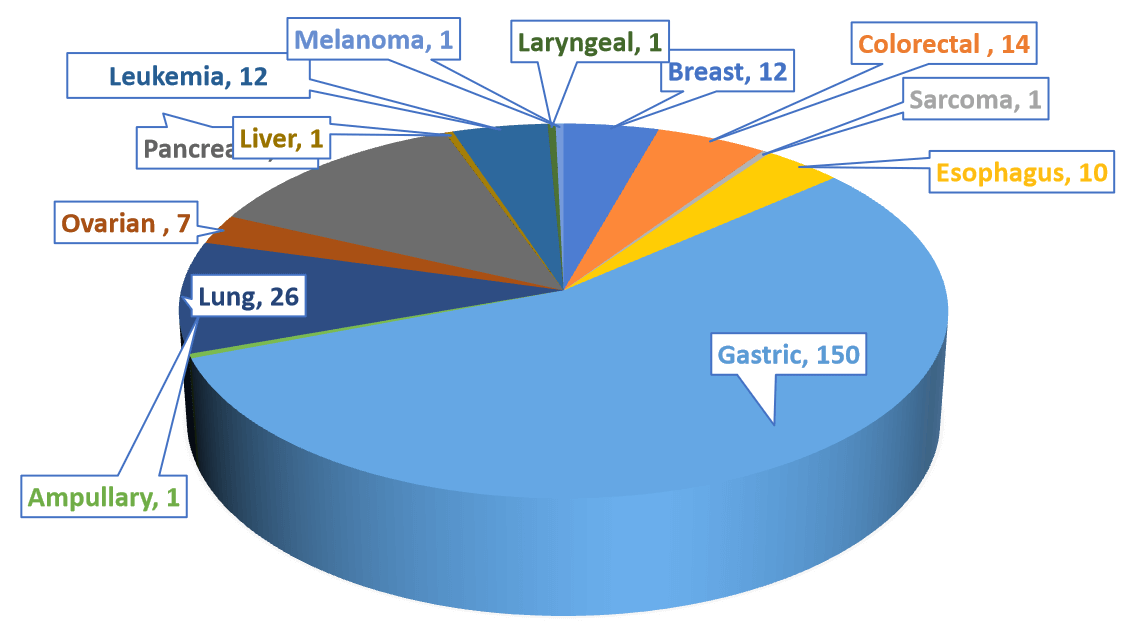
270 PDX Models have been successfully established on B-NDG mice in Biocytogen, of which is 13 types of Cancer.
| Experienced in ADC evaluation | Immune reconstitution | High quality PDX from vendors | Gene expression database | Live PDX animal |
|
|
|
|
|
| Types of cancer | Model quantity | TMA quantity |
| Breast | 12 | 1 |
| Colorectal | 13 | 2 |
| Esophagus | 10 | 1 |
| Gastric | 144 | 13 |
| Lung | 22 | 3 |
| Pancreatic | 34 | 4 |
| Ampullary | 1 | 1 |
| Targets tested by IHC | |||||
| HER2 | CDCP1 | 5T4 | EPHA2 | CLDN18.2 | LYPD3 |
| MSLN | HER3 | PTK7 | ADAM9 | TIM1 | PSCA |
| MUC16 | EGFR | ITGB6 | B7-H3 | SLC34A2 | KREMEN2 |
| TPBG | MET | MUC1 | B7-H4 | CD71 | CD228 |
| FOLR1 | EPCAM | TROP2 | GPC1 | CDH3 | MUC18 |
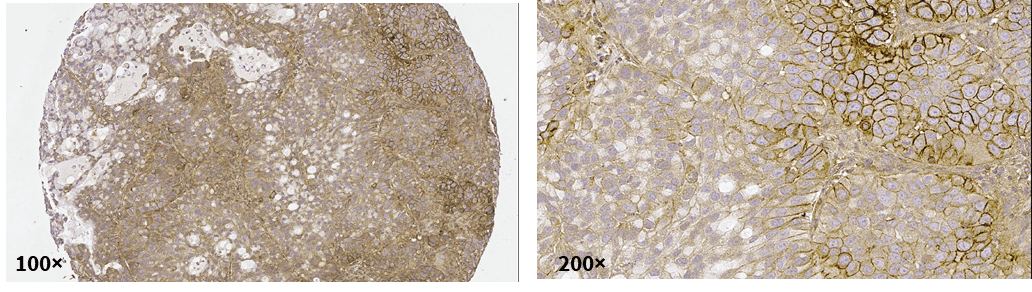
| Model ID | BP0508 |
| Cancer type | Lung cancer |
| Rating scale | 3+ |
| Generation | R5P4 |
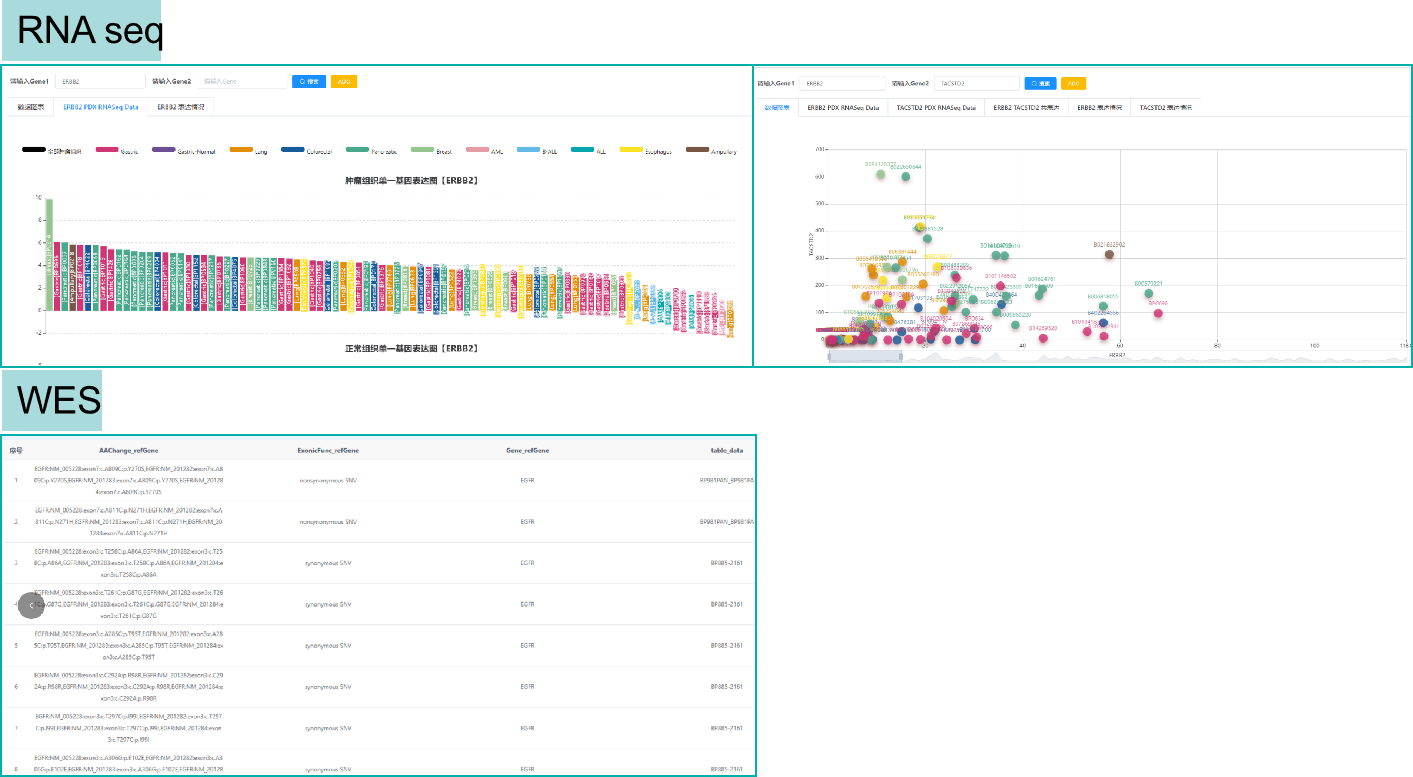
Biocytogen's PDX Seq Database
| Model ID | Subtype analysis | Gender/Age | Sample Location | Type of deregulations | TNM | CLDN18.2/EGFR | Sequencing |
| BP0062 | Ductal Adenocarcinoma | F/61 | Pancreaticoduodenal | Moderately differentiated | IV | positive | WES |
| HLA-A | HLA-B | HLA-C | HLA-DPA1 | HLA-DPB1 | HLA-DQA1 | HLA-DQB1 | HLA-DRA | HLA-DRB1 | HLA-DRB3 | HLA-DRB4 | |
| BP0062-P0 | 02:242 | 40:06 | 08:01 | 02:02 | 05:01 | 01:02 | 06:02 | 01:01 | 15:01 | 01:01 | 01:01 |
| 01:215 | 37:01 | 06:138 | 01:03 | 22:01 | 04:01 | 03:01 | 07:01 | 02:02 |
STR confirmation
| Genetic Site | BP0062-P1 | BP0062-P5 | ||
| Amelogenin | X | X | X | X |
| CSF1PO | 10 | 12 | 10 | 12 |
| D13S317 | 10 | 10 | ||
| D16S539 | 9 | 12 | 9 | 12 |
| D5S818 | 11 | 11 | ||
| D7S820 | 9 | 12 | 9 | 12 |
| TH01 | 9 | 9 | ||
| TPOX | 8 | 11 | 8 | 11 |
| vWA | 12 | 17 | 12 | 17 |
| D21S11 | 30 | 32.2 | 30 | 32.2 |
According to the international standard established by ANSI, when the matching degree of cell lines is ≥ 80%, they are considered to be correlated. The result shows that these samples are with 100% matching degree and come from the same patient.
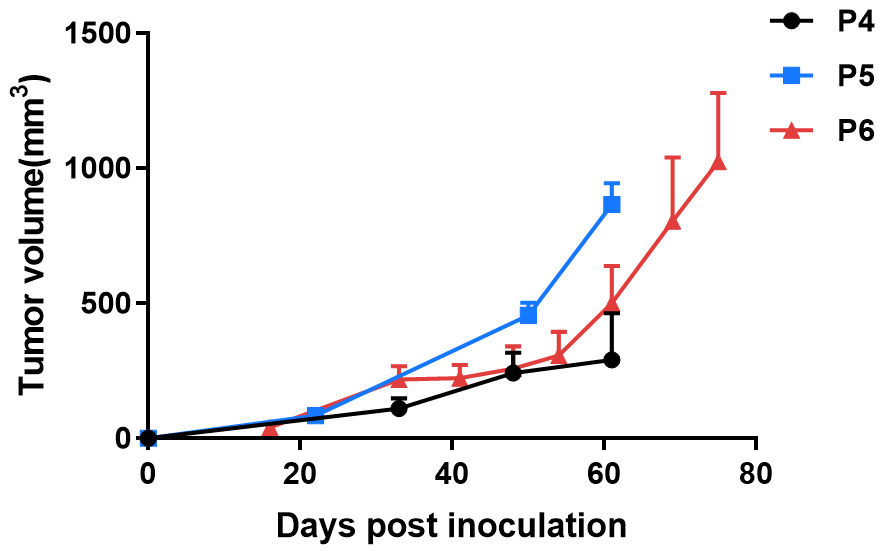
BP0062 was subcutaneously implanted into the B-NDG mice. Tumor volume was calculated using the formula: V=0.5a X b2, where a and b were the long and short diameters of the tumor, respectively. Data were shown as Mean± SEM.
Results: The PDX model from Pancreatic cancer BP0062 is well established in B-NDG mice. The tumor volume can be effectively tracked.
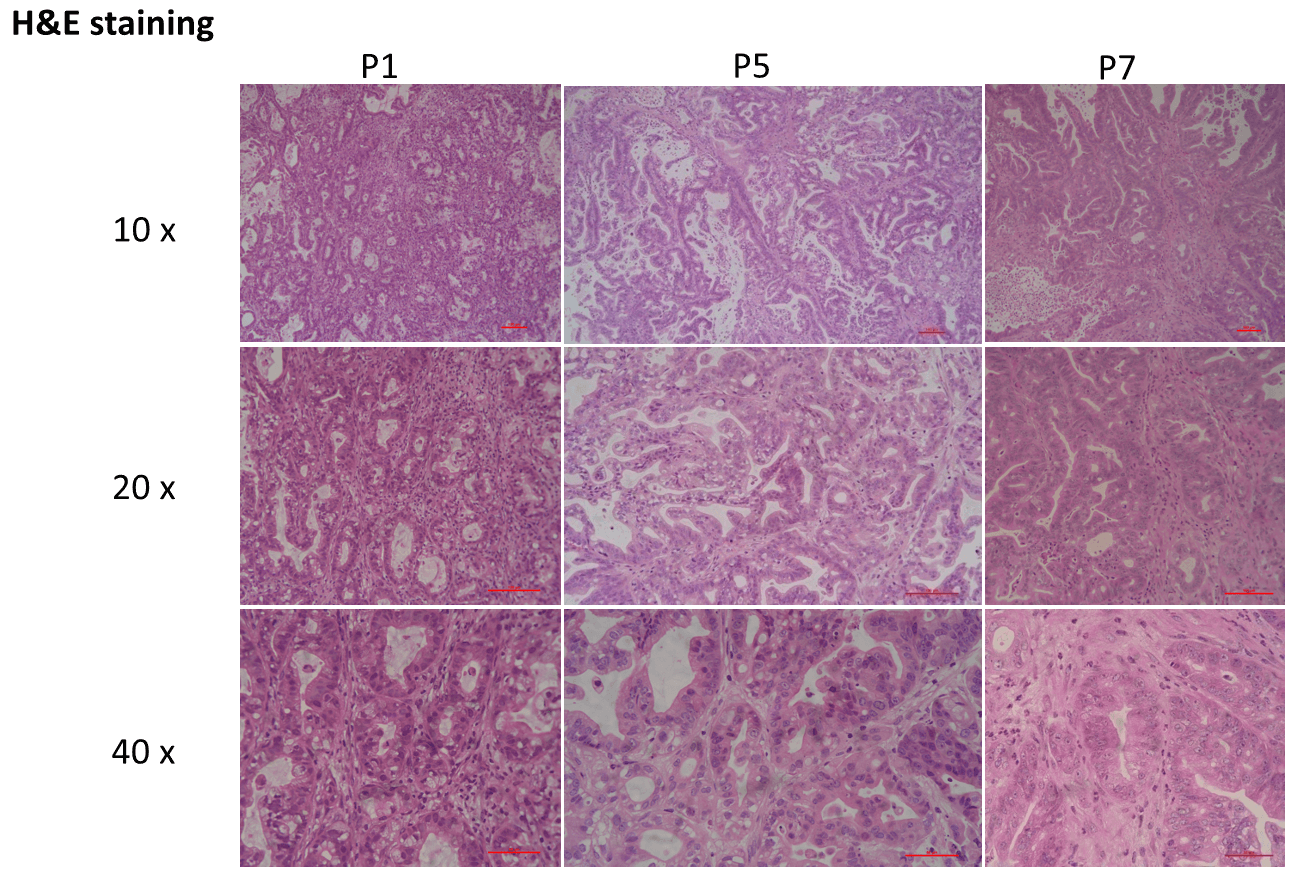
Patient-derived xenograft was found to recapitulate the structures in original patient samples and maintain similar heterogeneity in different generations.
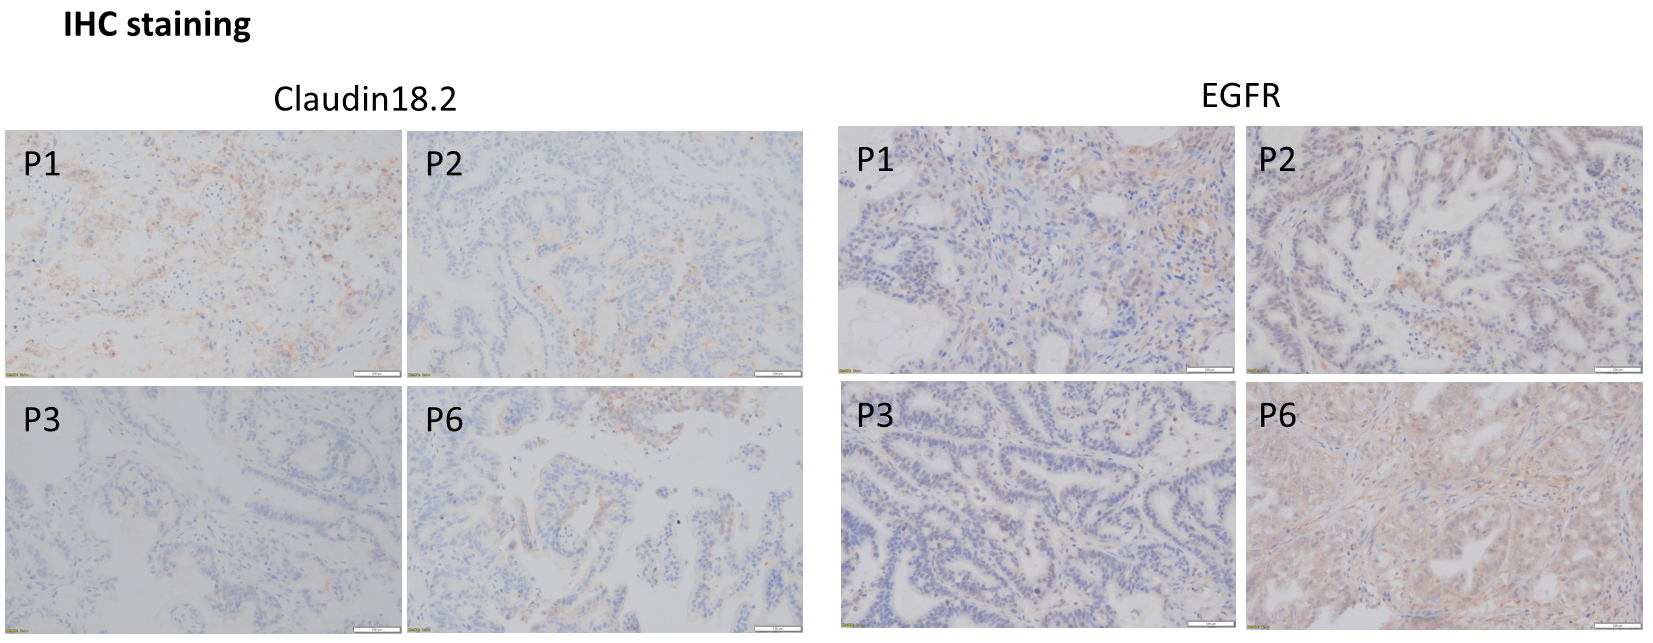
A thorough IHC assessment of CLDN18.2 and EGFR revealed no observable heterogeneity among individual tumors in different generations.
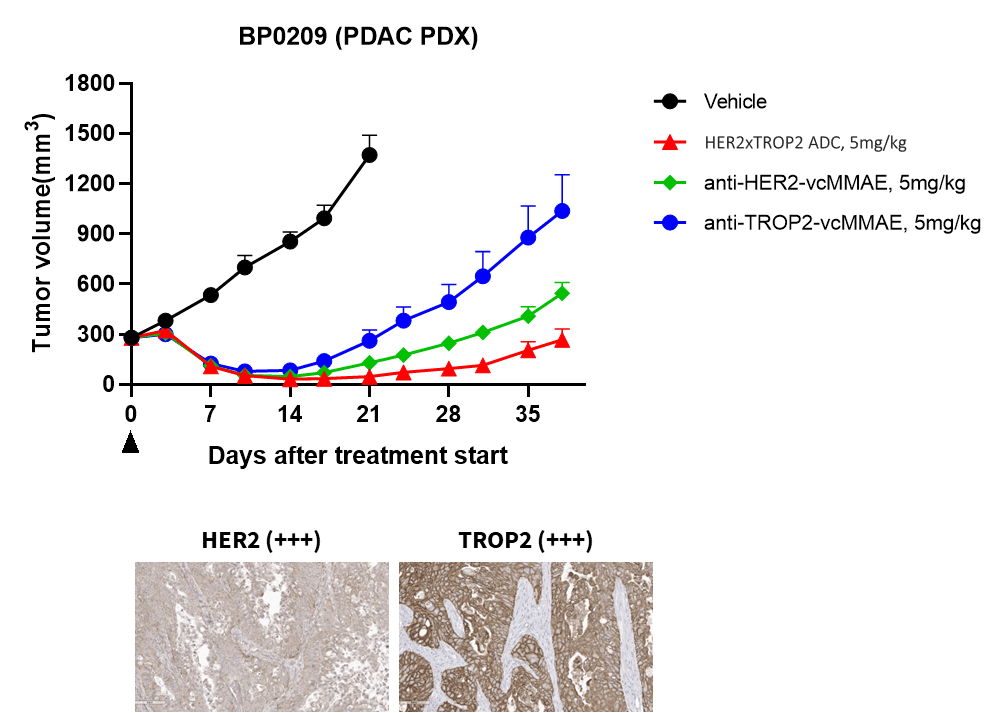
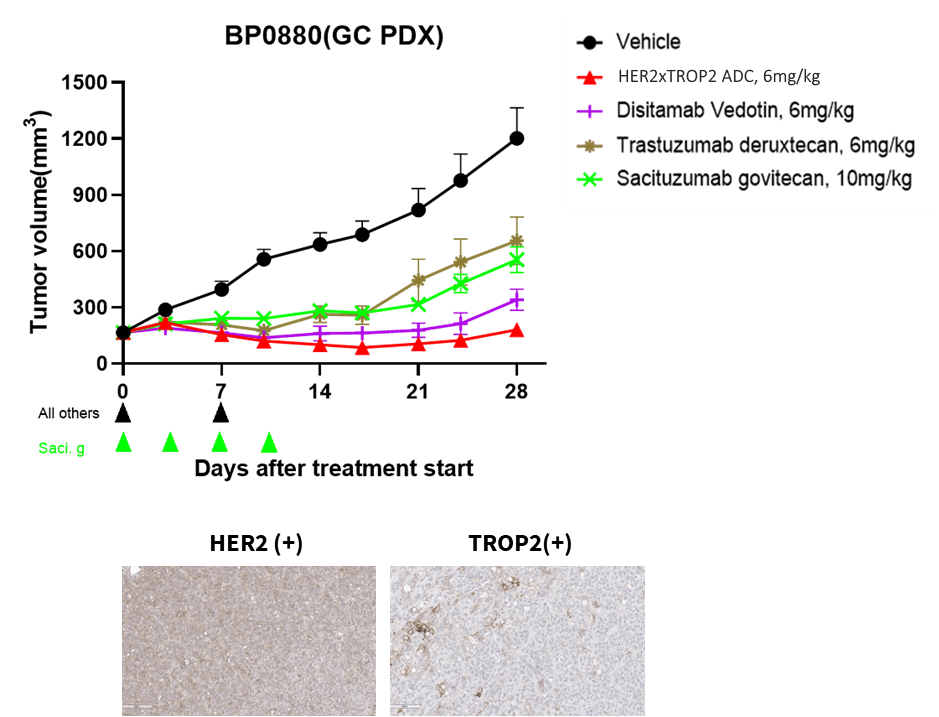
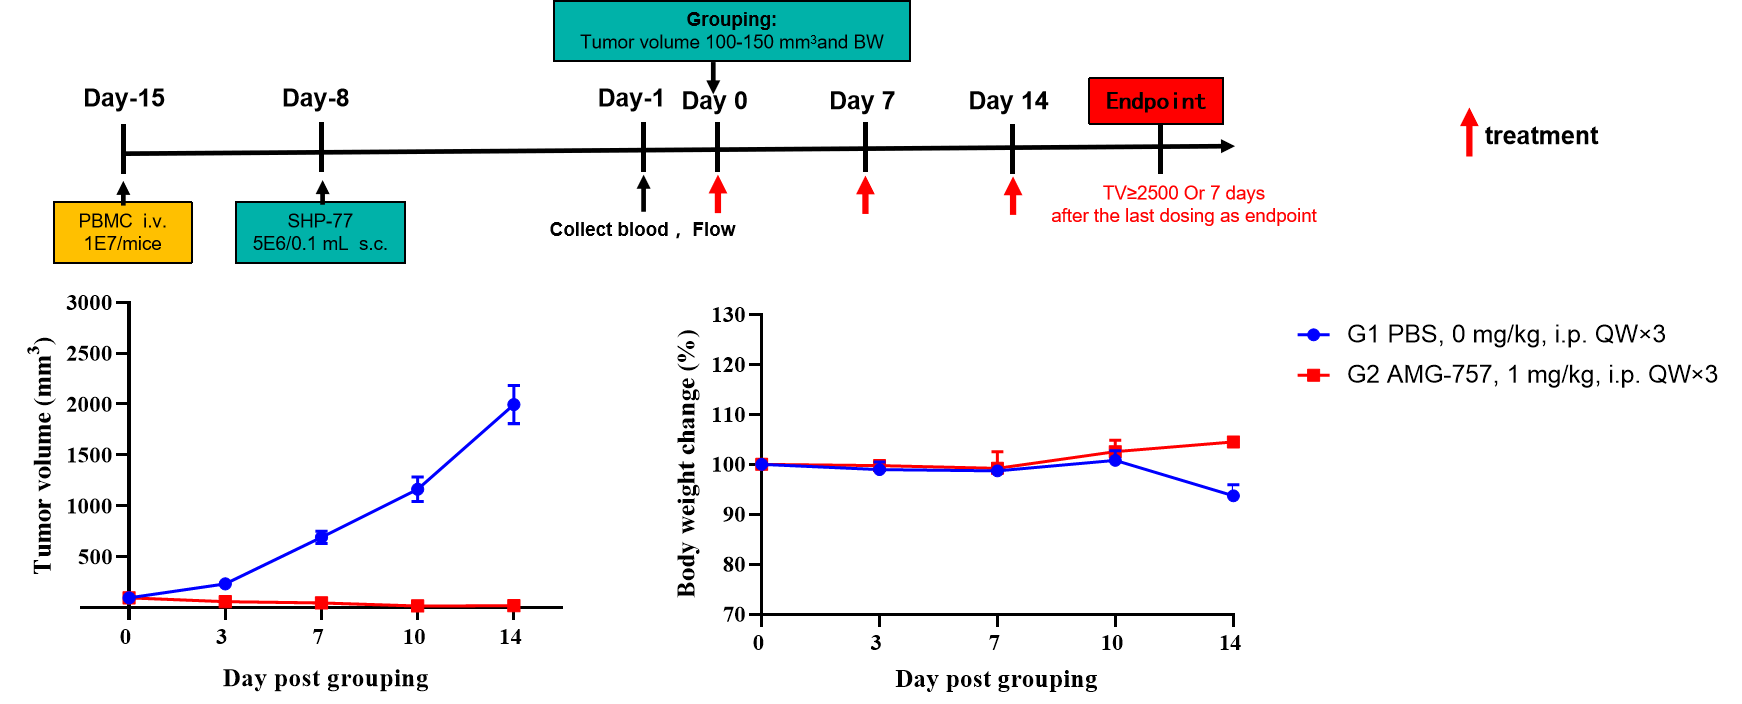
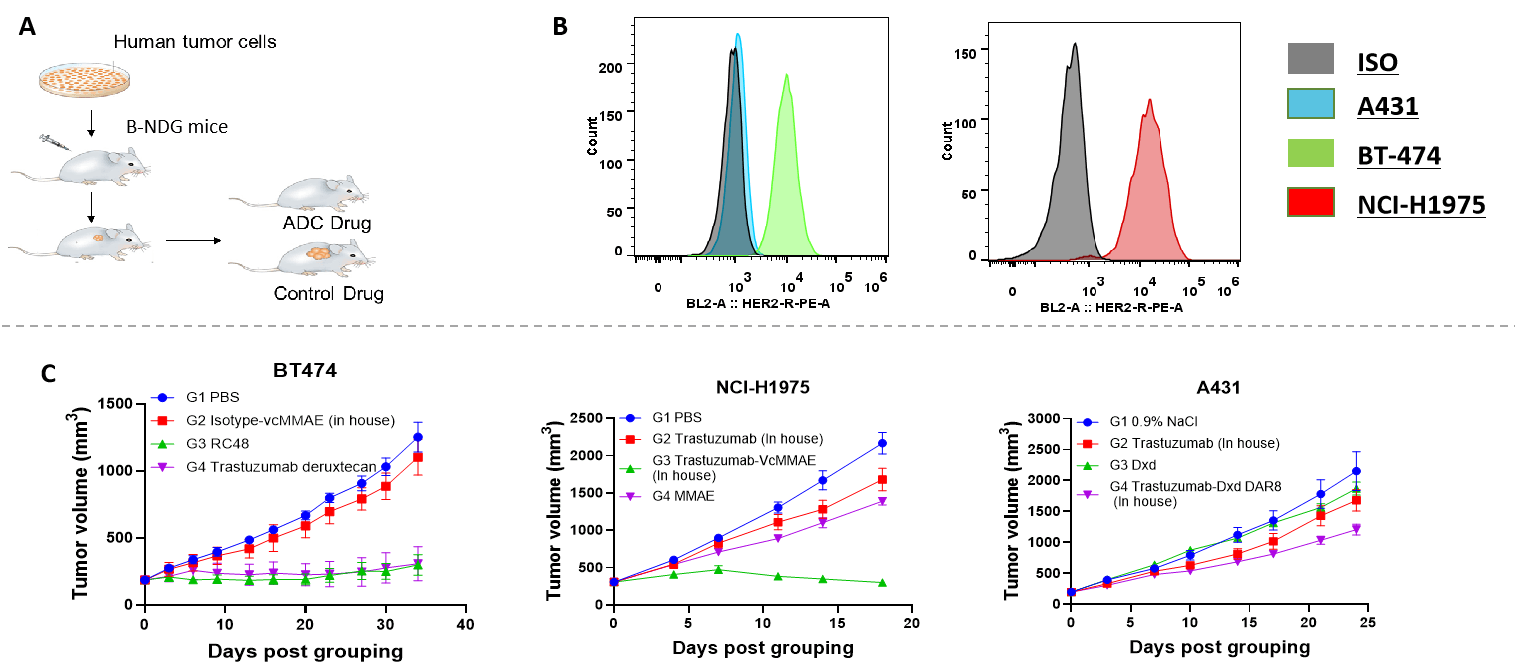
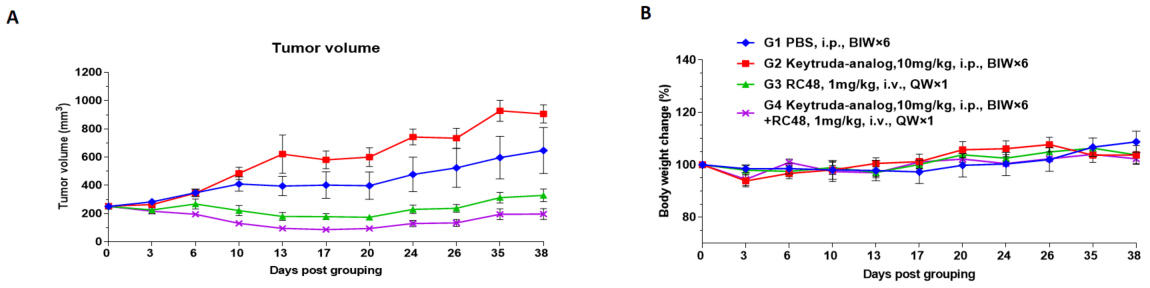
Her2 x Trop2 ADC exhibit dramatic tumor growth inhibition on both Her2/Trop2 high expression and low expression PDX models.
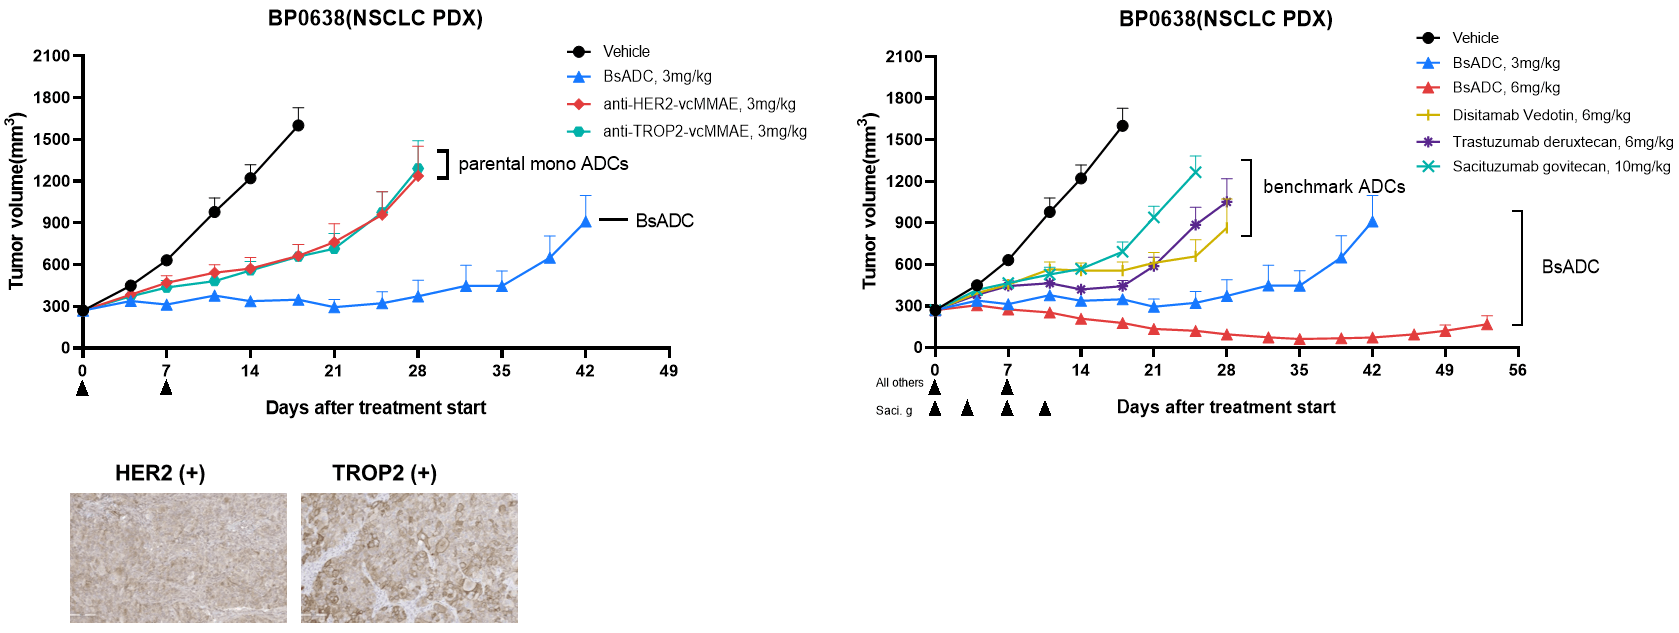
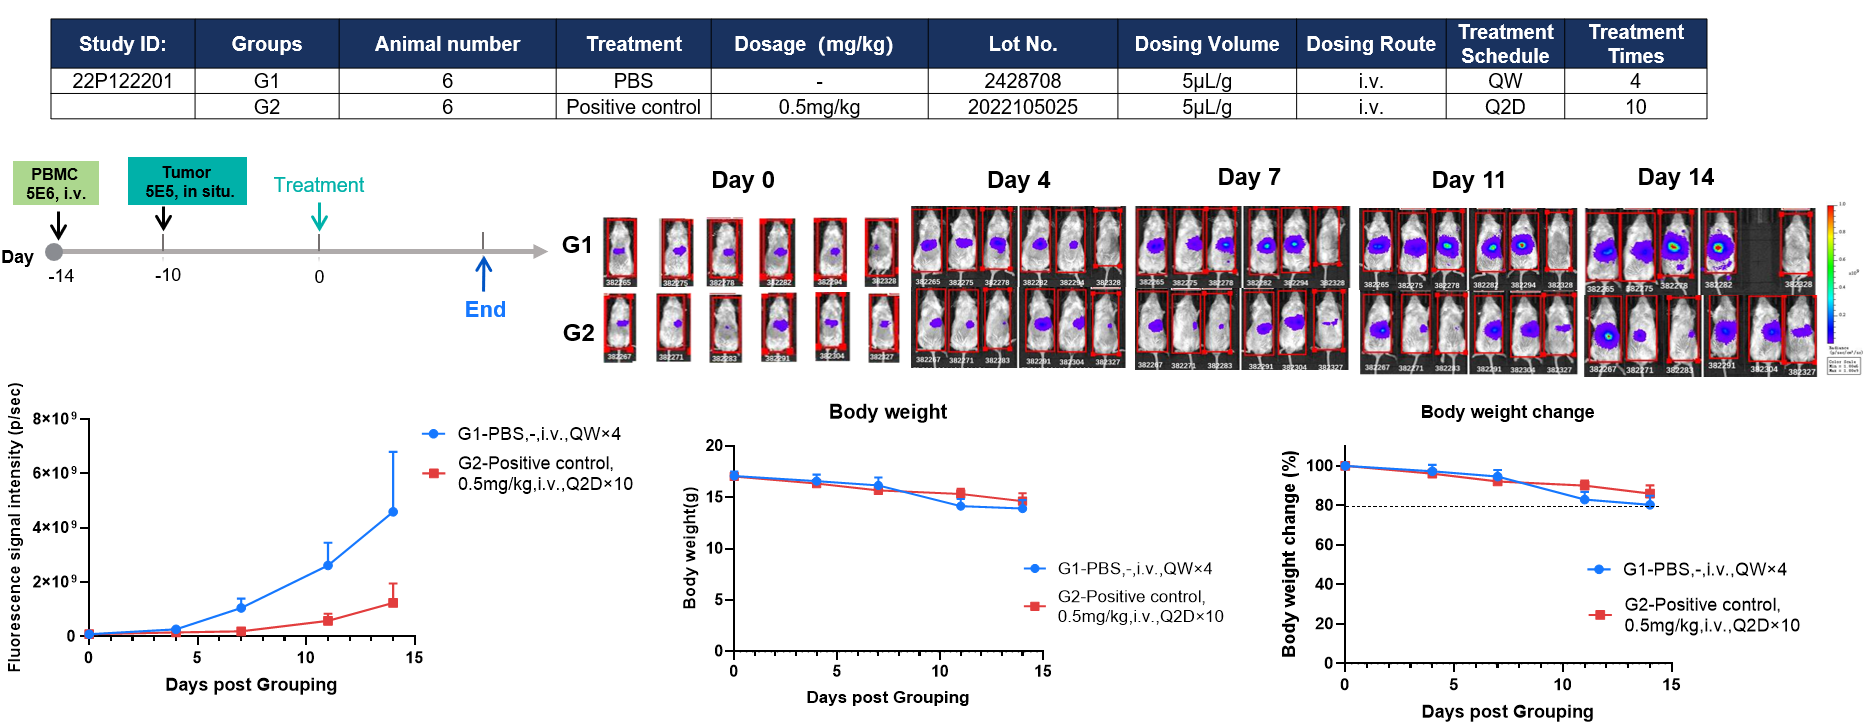
Strong and durable antitumor activity in HER2-low PDX model. BsADC showed strong and durable anti-tumor activity in HER2-low NSCLC PDX model compared with parental monospecific and benchmark ADCs, indicating that BsADC has strong therapeutic potential to overcome the drug resistance of single target-ADCs caused by tumor heterogeneity.
| Model ID | Subtype | Information about patient | Growth curve | Pn≥3 | STR analysis | HLA | WES | RNA-Seq | In vivo study |
| BP2010 | AML-M5 | √ | √ | √ | √ | √ | √ | √ | √ |
| BP2035 | AML-M2 | √ | √ | √ | √ | √ | |||
| BP2053 | B-ALL | √ | √ | √ | √ | √ | √ | √ | |
| BP2055 | B-ALL | √ | √ | √ | √ | √ | √ | √ | √ |
| BP2075 | B-ALL | √ | √ | √ | √ | √ | |||
| BP2084 | T-ALL | √ | √ | √ | √ | √ | √ | √ | √ |
| BP2088 | B-ALL | √ | √ | √ | √ | √ | √ | ||
| BP2094 | B-ALL | √ | √ | √ | √ | √ | √ | √ | |
| BP2097 | B-ALL | √ | √ | √ | √ | √ | √ | √ | |
| BP2101 | B-ALL | √ | √ | √ | √ | √ | √ | √ | √ |
| BP2103 | AML-M4 | √ | √ | √ | √ | √ | √ | √ | √ |
| BP2117 | AML FLT3+ | √ | √ | √ | √ | √ |
| Model ID | Subtype analysis | Gender/Age | Source type | Immunophenotyping | Fusion gene | SNV |
| BP2010 | Relapse refractory AML-M5 | F/60 | Peripheral Blood | Express: HLA-DR (85.6%), CD34 (85.8%), CD13 (72.3%), CD33 (87.5%), CD117 (88.4%), CD64 (56%), CD38 (99.5%); Not express: CD10, CD19, CD20, CD22, CD2, CD3, CD4, CD5, CD7, CD8, CD14, CD15, CD11b, CD56, MPO, cCD79a,cCD3 |
MLL-AF6 positive | NRAS Q61R Mutation positive |
| HLA-A | HLA-B | HLA-C | HLA-DPA1 | HLA-DPB1 | HLA-DQA1 | HLA-DQB1 | HLA-DRA | HLA-DRB1 | HLA-DRB4 | |
| BP2010 | 29: 01 | 07: 05 | 15: 05 | 01: 03 | 03: 01 | 01: 02 | 06: 02 | 01: 01 | 15: 01 | 01: 01 |
| 26: 01 | 48: 05 | 02: 140 | 03: 01 | 02: 02 | 03: 01 | 03: 01 | 04: 07 |
STR confirmation
| Genetic Site | BP2010-PA | BP2010-P9 | ||
| Amelogenin | X | X | X | X |
| CSF1PO | 12 | 12 | 12 | 12 |
| D13S317 | 8 | 11 | 8 | 11 |
| D16S539 | 10 | 11 | 10 | 11 |
| D5S818 | 9 | 11 | 9 | 11 |
| D7S820 | 10 | 13 | 10 | 13 |
| TH01 | 9 | 9 | 9 | 9 |
| TPOX | 8 | 11 | 8 | 11 |
| vWA | 14.2 | 15.2 | 15 | 16 |
| D21S11 | 29 | 29 | 29 | 29 |
According to the international standard established by ANSI, when the matching degree of cell lines is ≥ 80%, they are considered to be correlated. The result shows that these samples are with 100% matching degree and come from the same patient.
Cell Phenotype Confirmation
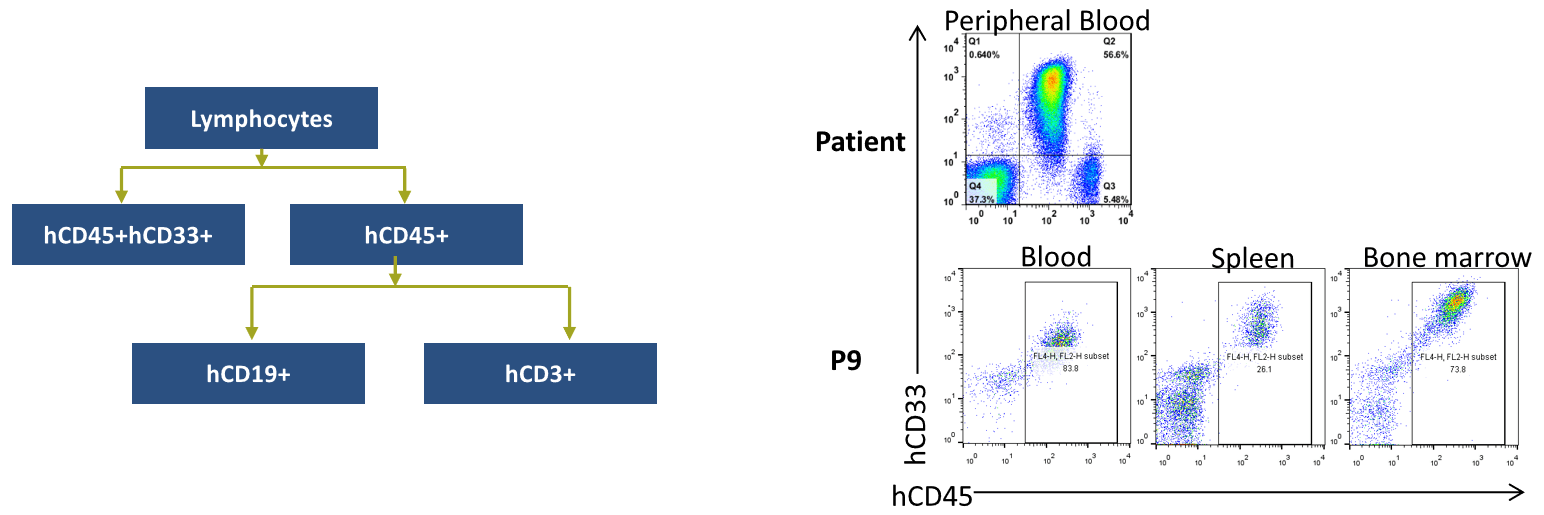
Patient-derived xenografts were found to recapitulate the immunophenotyping in different generations.
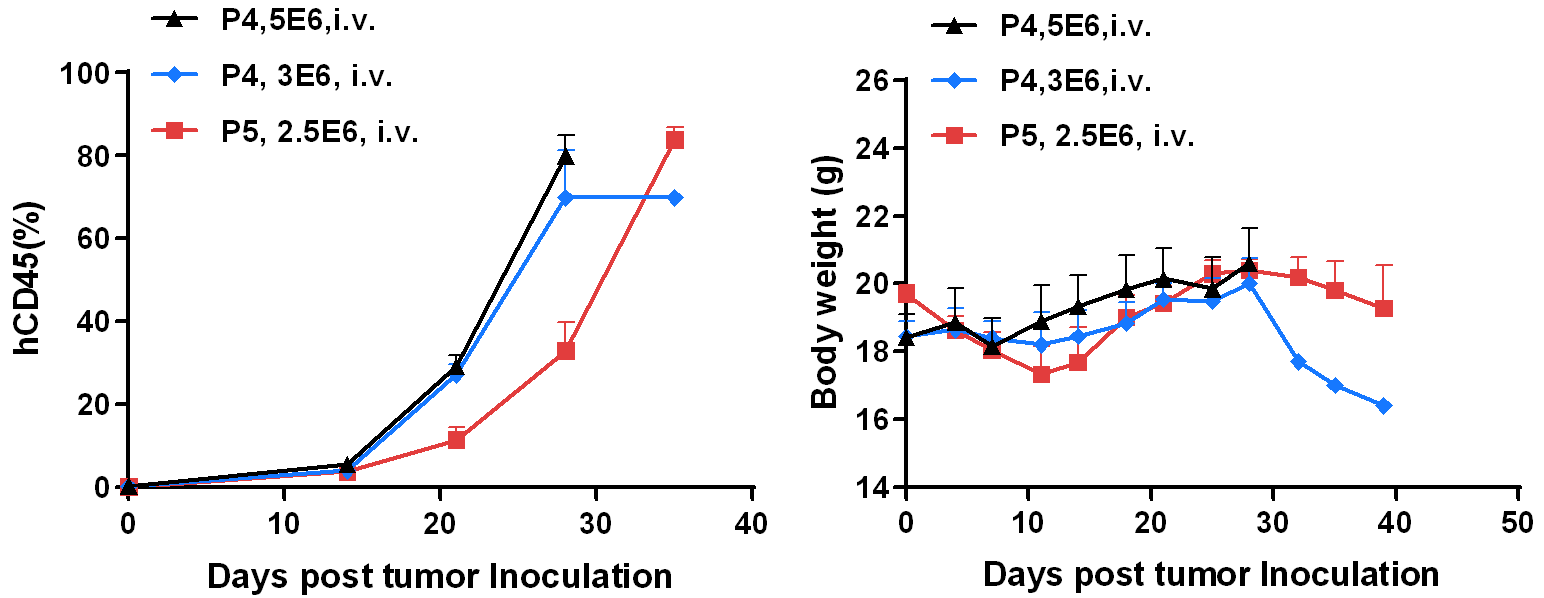
BP2010 was i.v. injected into B-NDG mice. The hCD45 percentage in blood sample was analyzed by flow cytometry. The body weight was measured twice a week. Data were shown as Mean ± SEM.
Results: The PDX model from leukemia PDX BP2010 is well established in B-NDG mice. The hCD45 percentages can be effectively tracked.
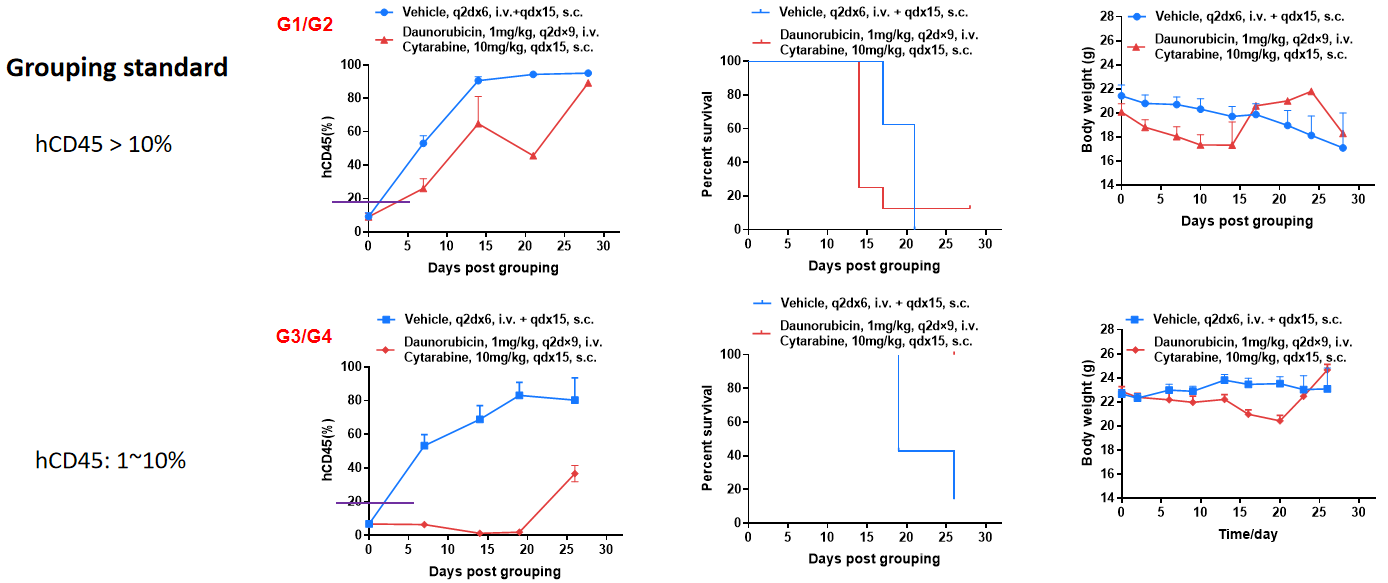
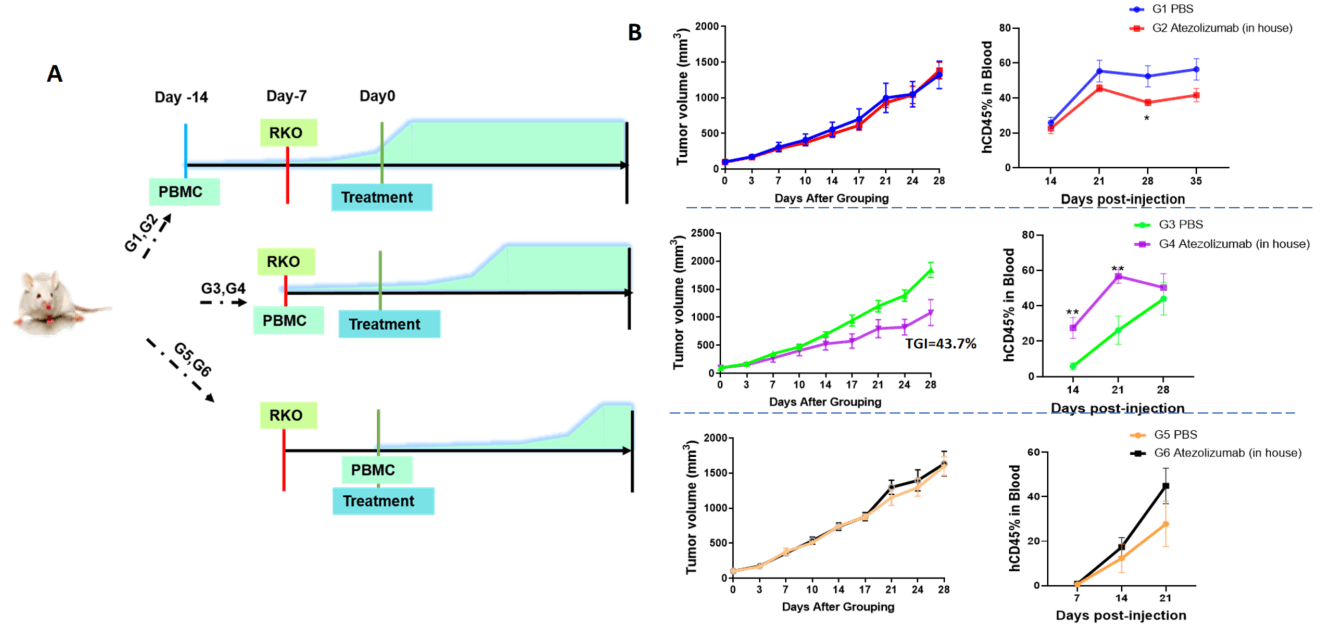
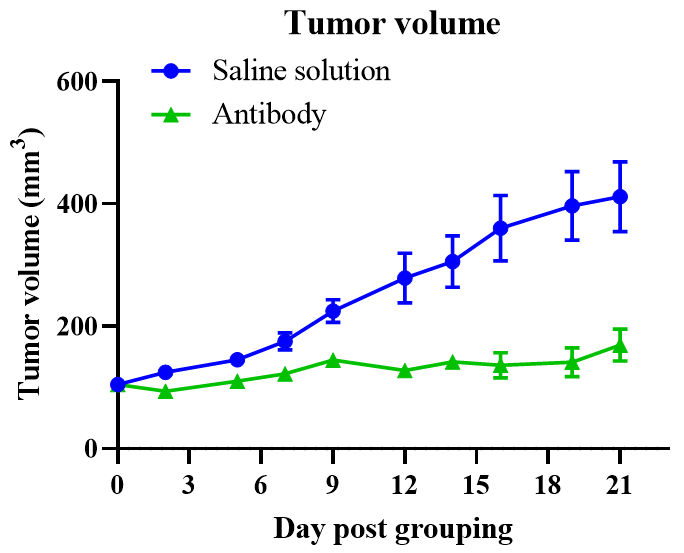
When hCD45 > 10%, the group was administered, and the treatment had no significant effect; when 10% > hCD45 > 1%, the group was administered, and the tumor inhibition effect was significant.
Conclusion: The degree of modeling during administration has a greater impact on the efficacy of small molecule drugs.
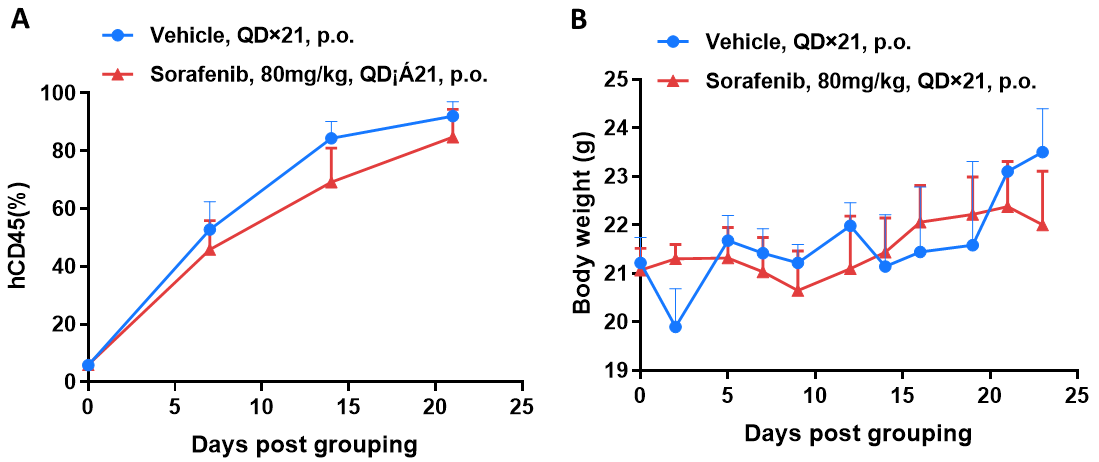
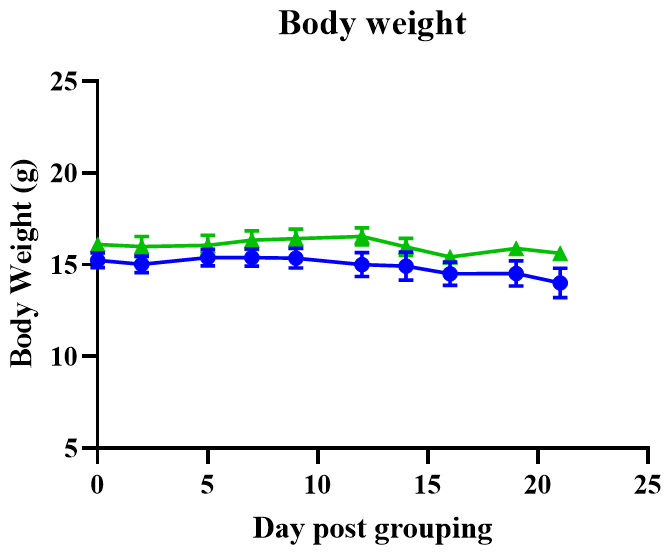
Antitumor activity of drugs target FLT3 in B-NDG mice. (A) Molecular targeted small-molecule anti-cancer drugs slightly inhibited tumor growth of BP2010 in B-NDG mice. PDX model of BP2010 was inoculated into B-NDG mice via caudal vein (female, n=6). Mice were grouped when hCD45 positive cells of PB reached approximately 10%, at which time they were treated with drug and schedules indicated in panel (B) Body weight changes during treatment. Values are expressed as mean ± SEM.
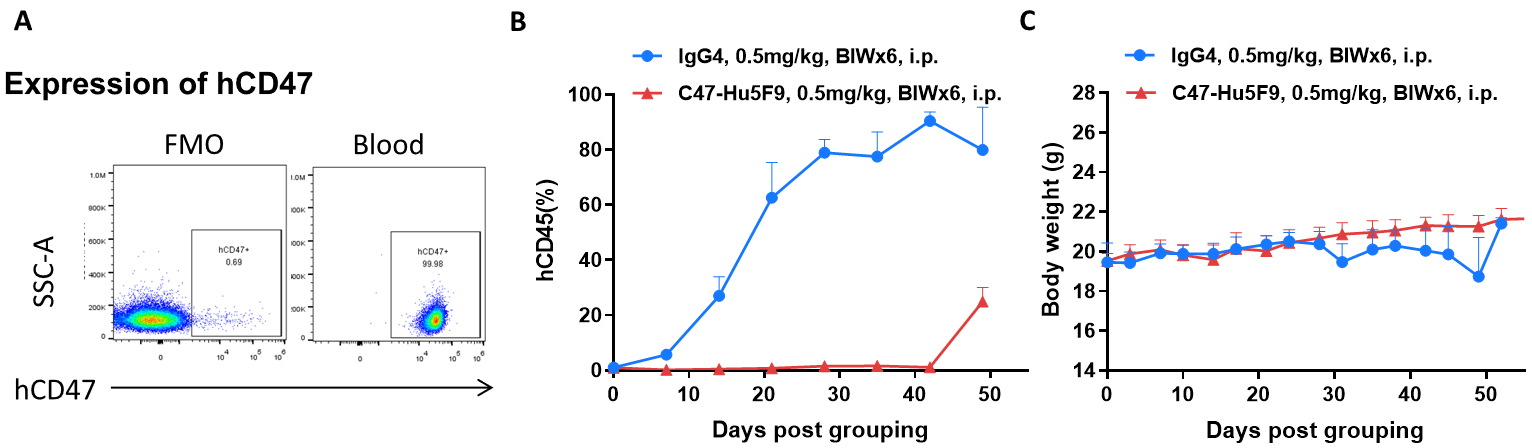
Antitumor activity of antibody in B-NDG mice. (A) Human CD47 was highly expressed on the surface of tumor cells of BP2010.(B) Antibody CD47-Hu5F9 could inhibit tumor growth of BP2010 in B-NDG mice. PDX model of BP2010 was inoculated into B-NDG mice via caudal vein (female, n=7). Mice were grouped when hCD45 positive cells of PB reached approximately 1%, at which time they were treated with antibody drug and schedules indicated in panel (C) Body weight changes during treatment. Values are expressed as mean ± SEM.