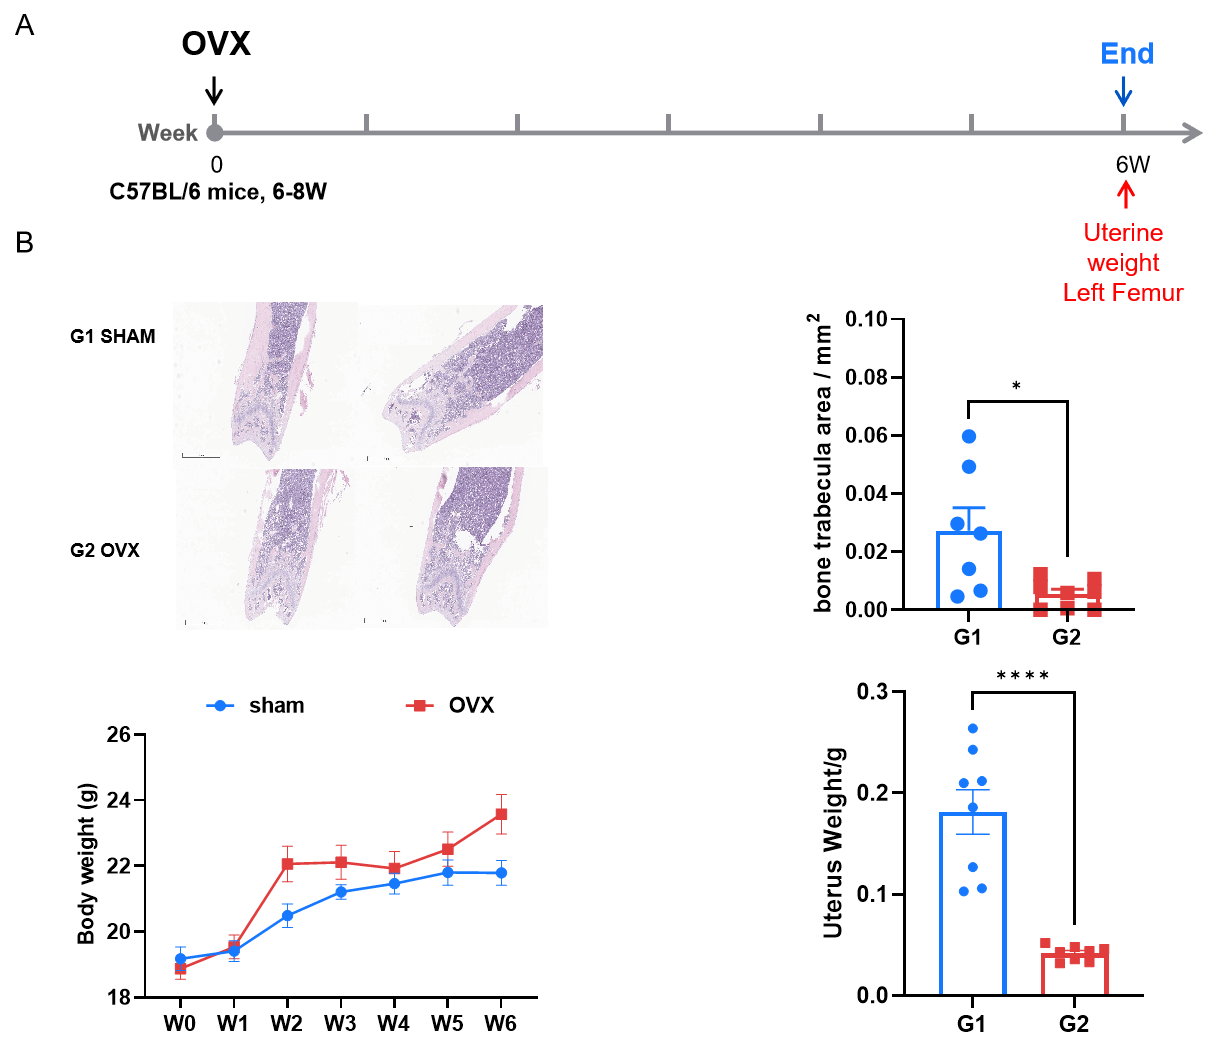
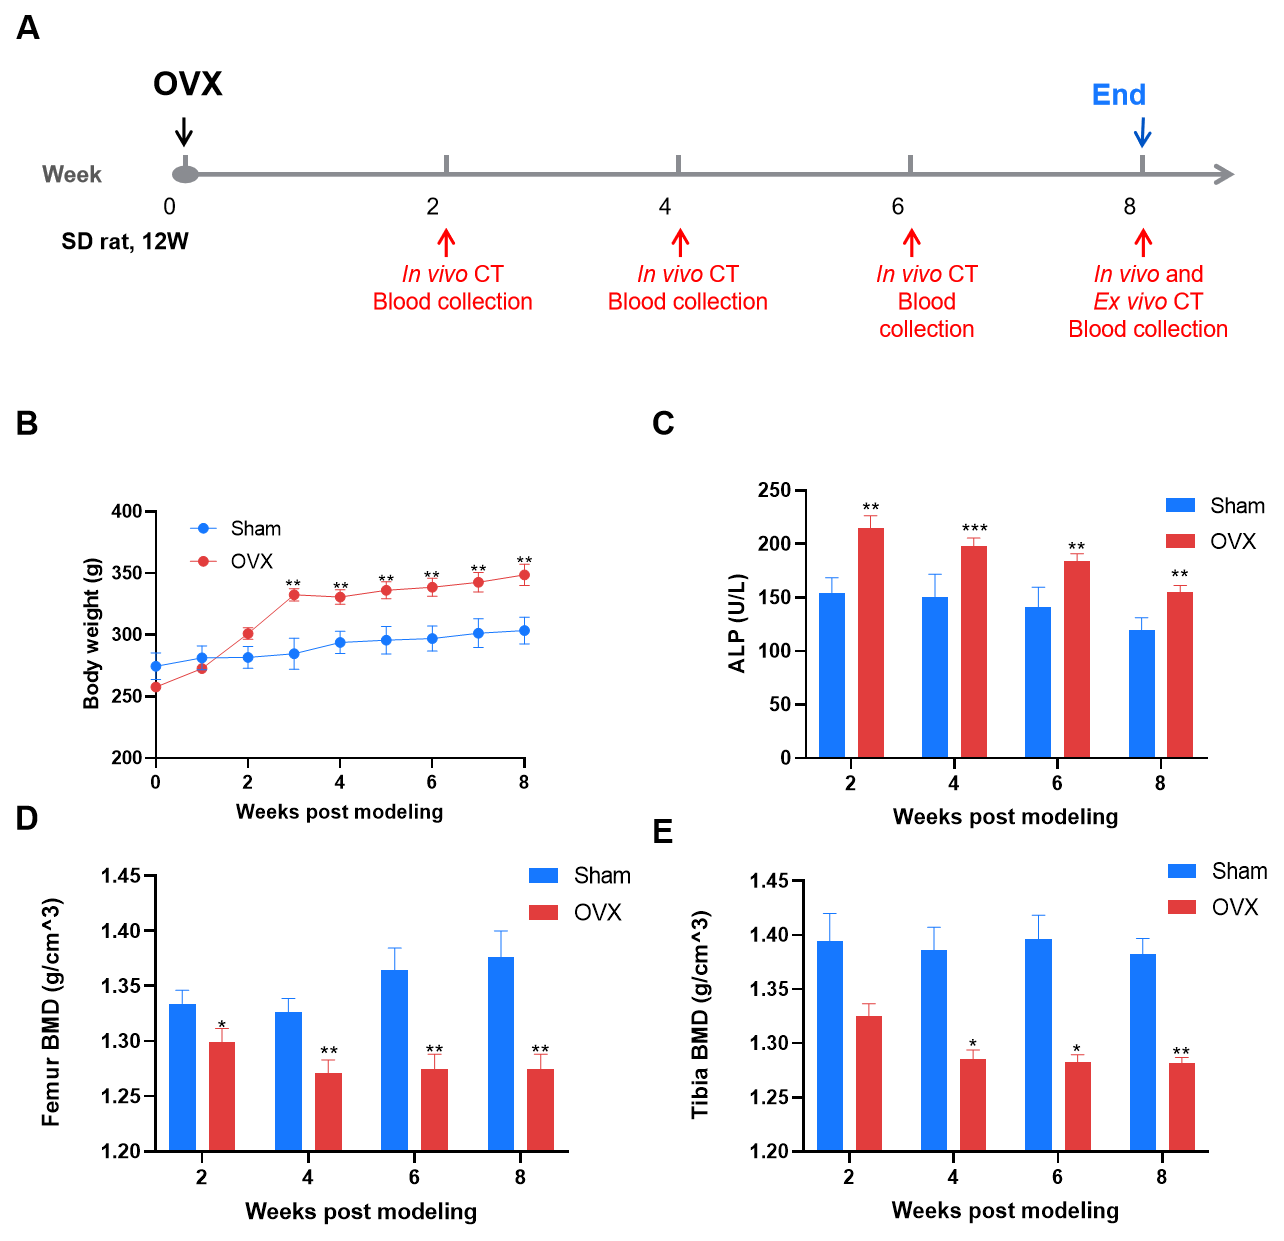
Establishment of Ovariectomy-Induced Osteoporosis Mouse Model in C57BL/6 Mice
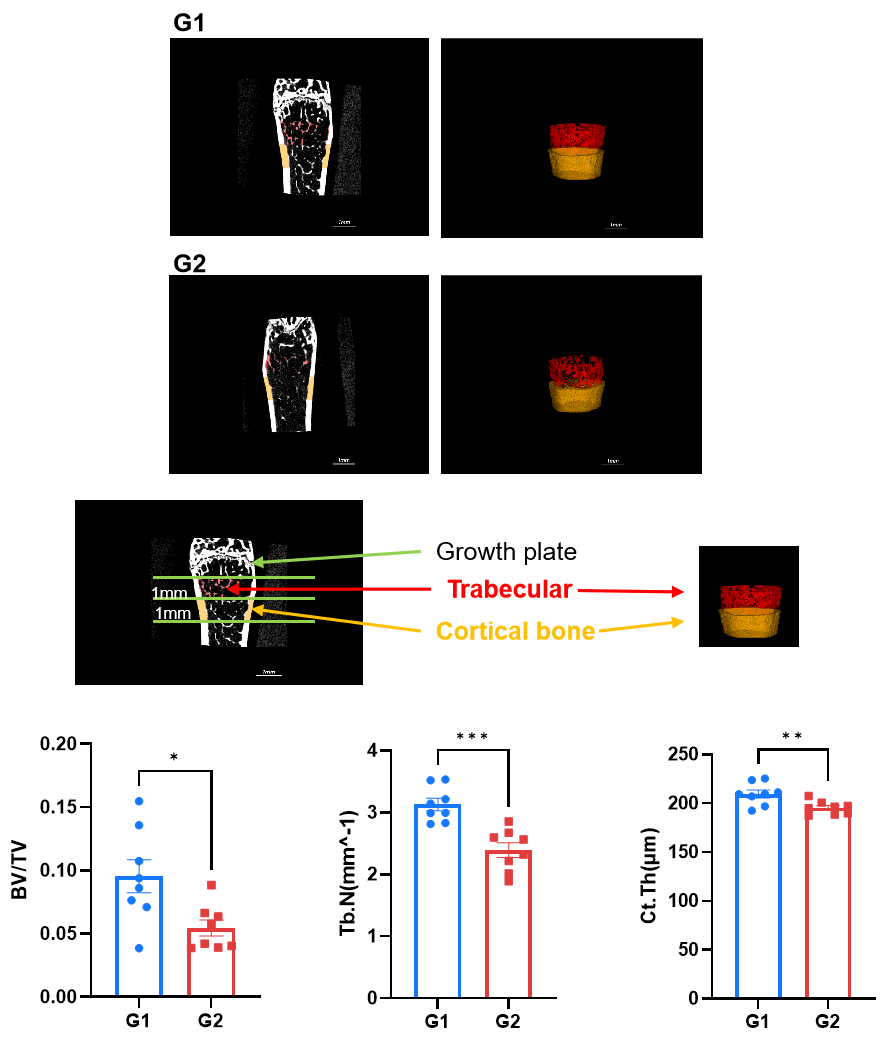
| Detection indicators |
| Micro-CT |
Ex Vivo Left Femur |
| HE |
Bone Trabecula Area |
Establishment of ovariectomy-induced osteoporosis mouse model in C57BL/6 mice. A. C57BL/6 mice were received ovariectomy on day 0. Body weight were recorded every week. Six weeks after operation, uterus and bones were harvested and tested. B. Ovariectomy produced a loss in bone trabecula and uterus weight while an increase in body weight. Values were expressed as mean ± SEM. N = 8, T-test, * p<0.05, ****p<0.0001.
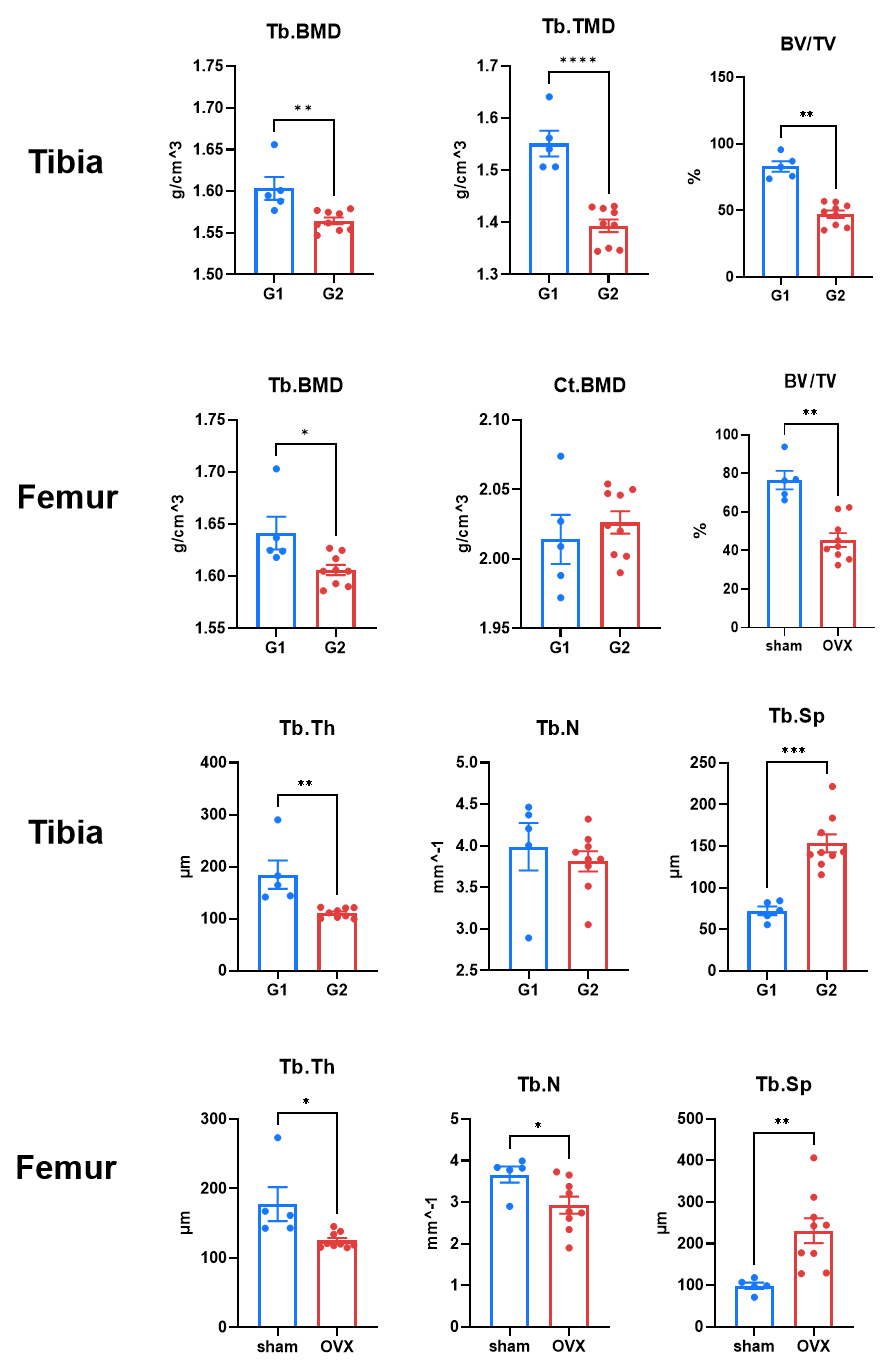
Ovariectomy induced osteoporosis in C57BL/6 mice. C57BL/6 mice were received ovariectomy on day 0. Six weeks after operation, bones were harvested and imaged with Micro-CT. Ovariectomy produced a bone loss. Values are expressed as mean ± SEM. N = 8, T-test, * p<0.05, **p<0.01, ***p<0.001.
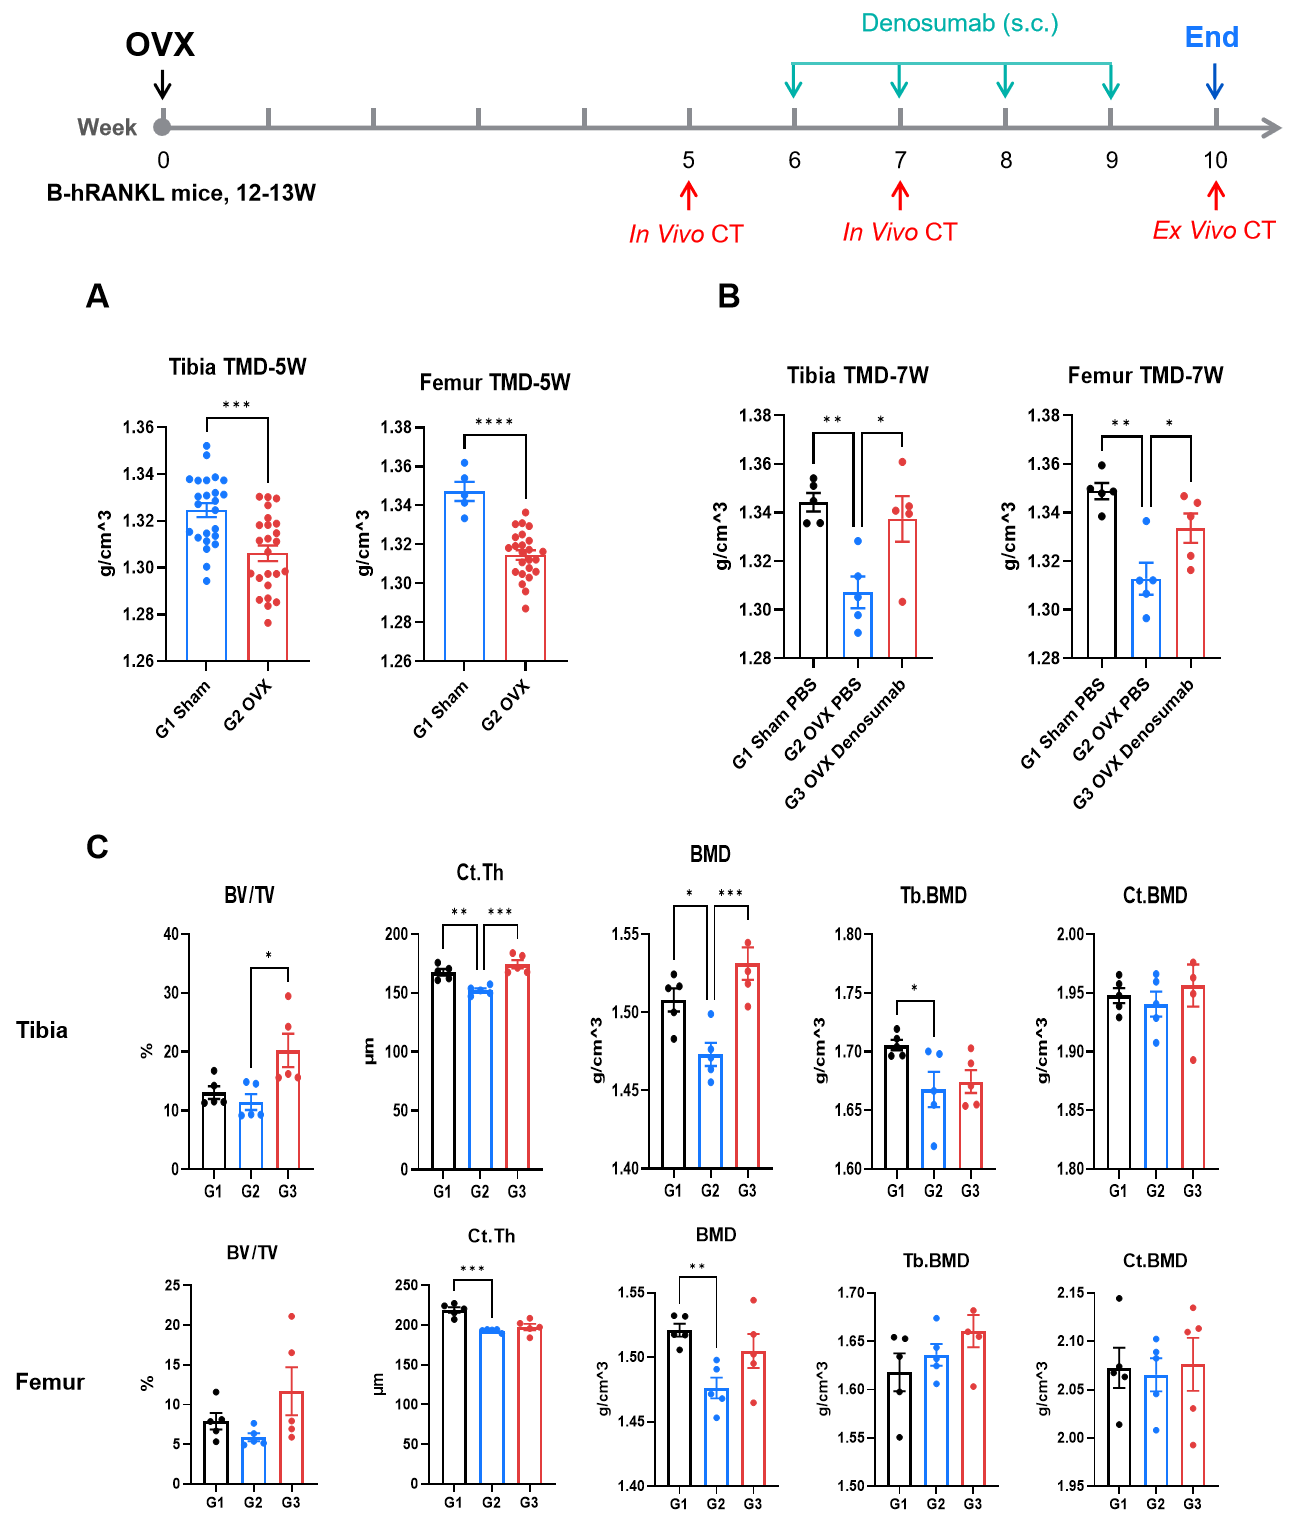
| Detection indicators |
| Micro-CT |
Left Femur and Tibia |
Efficacy evaluation of denosumab in ovariectomy-induced osteoporosis mouse model using B-hRANKL mice. A. In vivo CT were performed in B-hRANKL mice 5 weeks after OVX. The results showed that the bone density of mouse tissues decreased after OVX. B. In vivo CT were performed in B-hRANKL mice 7 weeks after OVX. The results showed that Denosumab increased the tissue bone density of OVX mice. C. Ex vivo CT were performed in B-hRANKL mice 10 weeks after OVX. The results showed that Denosumab increased tibial bone density in OVX mice. Values were expressed as mean ± SEM. Two group were analyzed with T-test, three group were analyzed with one way ANOVA. * p<0.05, **p<0.01, ***p<0.001, ****p<0.0001.