The high-fat methionine-choline-deficient diet (HFMCD) is a classic model for NASH induction, which consists of a 60 kcal% fat, methionine and choline-deficient diet. Both methionine and choline can promote the delivery of fat from the liver through the blood in the form of phospholipids, improve the utilization of fatty acids in the liver, and prevent the abnormal accumulation of liver fat. HFMCD-induced NASH mice display increased liver injury, hepatic steatosis, and fibrosis accompanied by increased NAS scores.
-
High-Fat Methionine-Choline-Deficient Diet (HFMCD)-Induction of NASH
-
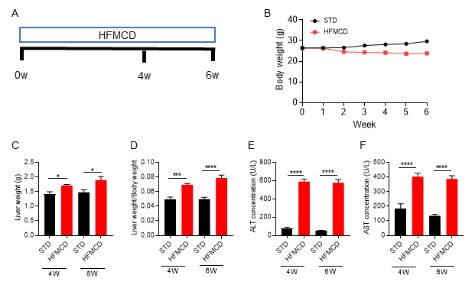
A model of NASH induced by a high-fat methionine-choline-deficient diet (HFMCD). Wild-type C57BL/6J mice were randomly divided into four groups and given a standard diet (STD) and a high-fat methionine-choline-deficient (HFMCD) diet and fed for 4 weeks and 6 weeks to detect various parameters. (A) HFMCD-induced NASH model protocol diagram. (B) Mouse body weight, (C) liver weight, (D) ratio of liver weight to body weight, (E-F) serum ALT and AST concentrations. Values are expressed as mean ± SEM. *p<0.05, ***p<0.001, ****p<0.0001.
-
Pathological Changes Associated with HFMCD-Induced NASH
-
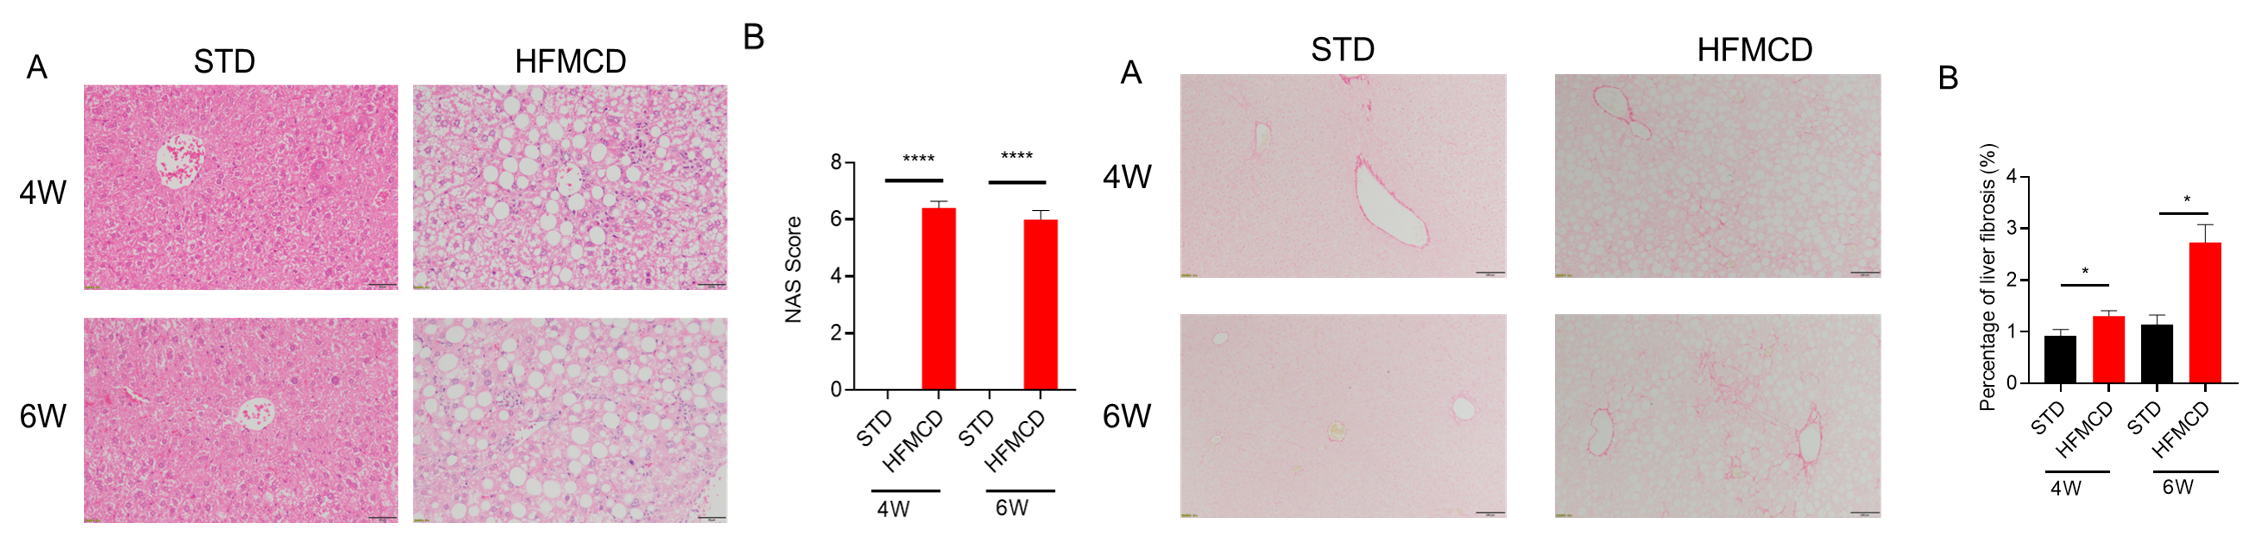
Analysis of H&E and Sirius red staining in the HFMCD-induced NASH mouse model. (A) Representative pictures of H&E staining showing increased hepatic steatosis and inflammation of HFMCD group . (B) The NAFLD activity score (NAS) was assessed by an external expert pathologist, revealing significantly increased NAS after HFMCD induction. Scale bar: 50 um. Values are expressed as mean ± SEM. *p<0.05, ****p<0.0001.
-
Celastrol Efficacy Evaluation in HFMCD-Induced NASH Mice
-
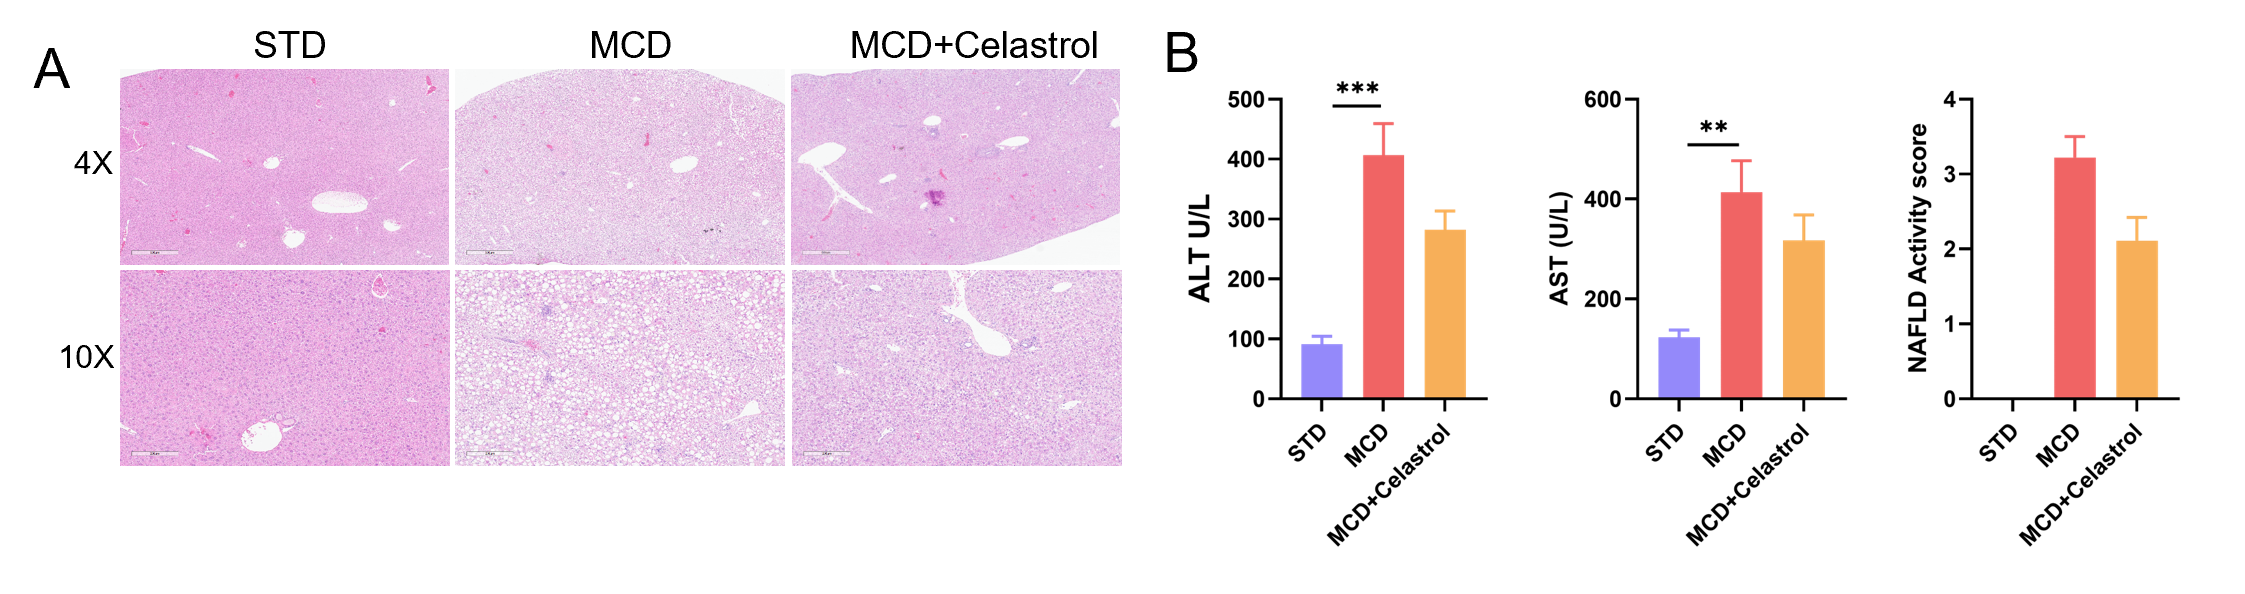
Analysis of H&E staining, index of liver function and NAFLD activity score the HFMCD-induced NASH mouse model. (A) Representative pictures of H&E staining showing reduced hepatic steatosis and inflammation after celastrol treatment. (B) ALT/AST change after MCD induction. Statistic data of NAFLD activity score (NAS). Values are expressed as mean ± SEM. **p<0.01, ***p<0.001.
Our Pharmacology Service Guarantee