Establishment of Papain-Induced Acute Lung Injury Mouse Model
- Experimental animals: B-hTSLP/TSLPR, C57BL/6N, 8-10 weeks old, female
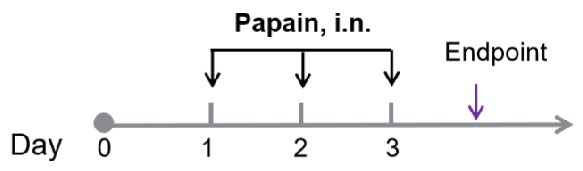
- Modeling reagent: Papain (intranasally, i.n.)
- Modeling paradigm:
| Readout |
| Included tests |
Bronchoalveolar Lavage Fluid (BALF) |
Cell numbers of Neutrophils, eosinophils, and macrophages |
| Histopathology |
Bronchial mucus |
| Optional tests |
BALF |
IL-4, IL-5, IL-13, TARC… |
| Lung tissue homogenate |
IL-4, IL-5, IL-13, TARC… |
Establishment of Papain-Induced Acute Lung Injury Mouse Model in C57BL/6 Mice
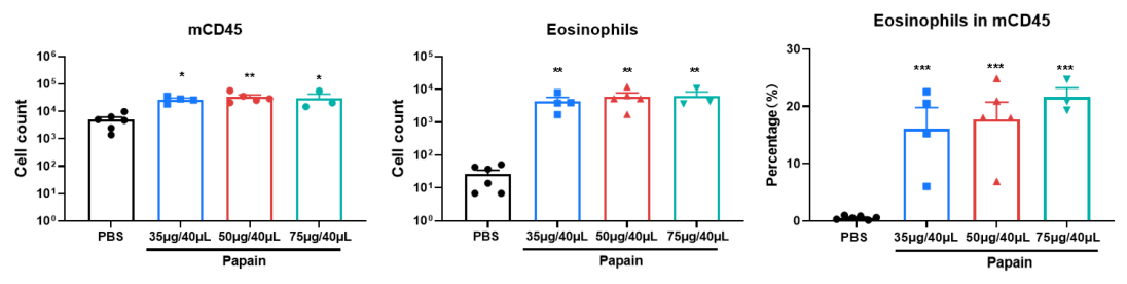
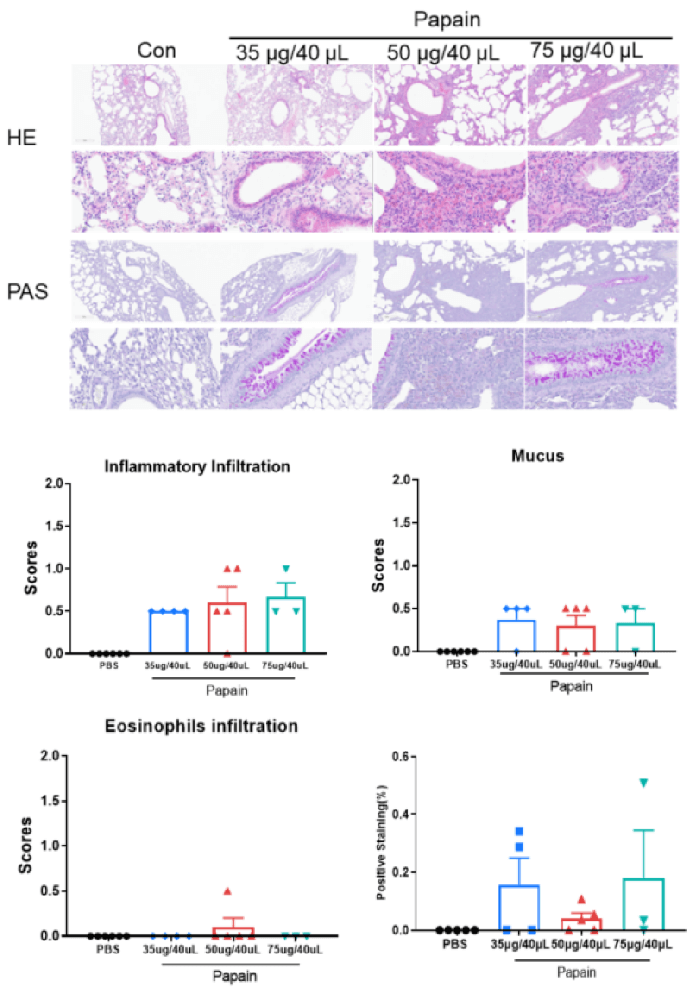
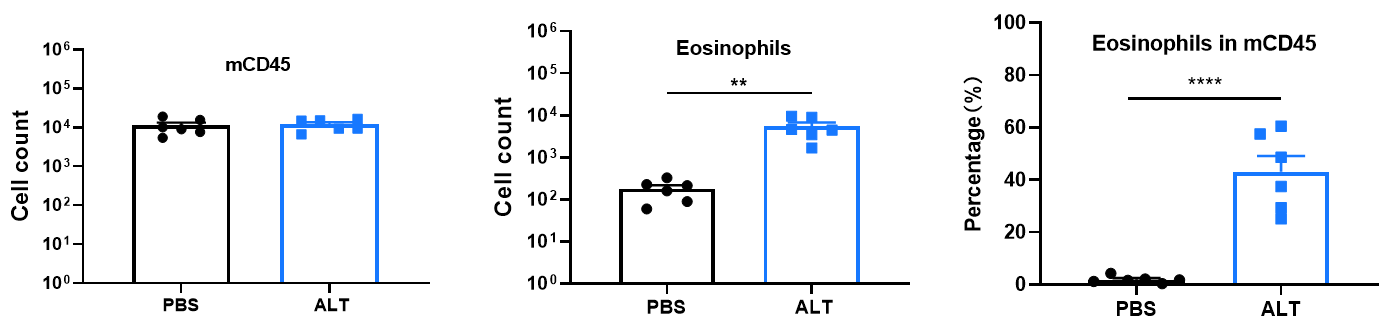
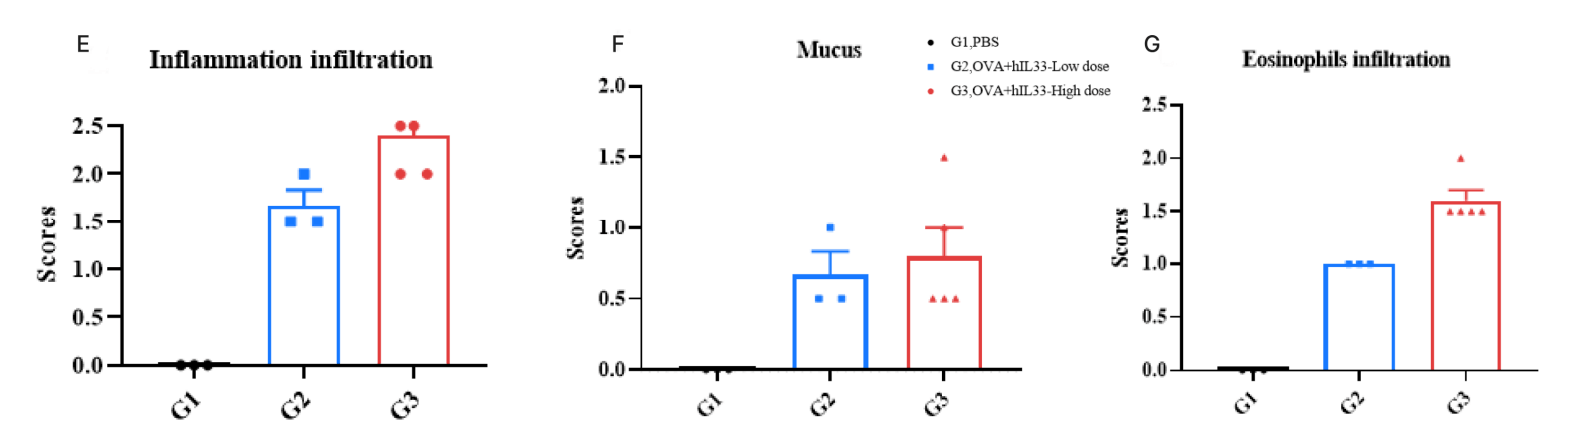
The count of mCD45 and eosinophils as well as percentage of eosinophils in mCD45. The score of inflammatory cell infiltration and bronchial mucus around blood vessels and bronchi of papain-induced acute lung injury mouse model based on C57BL/6 mice. Values are expressed as mean ± SEM. *** p<0.001, **p<0.01, *p<0.05.
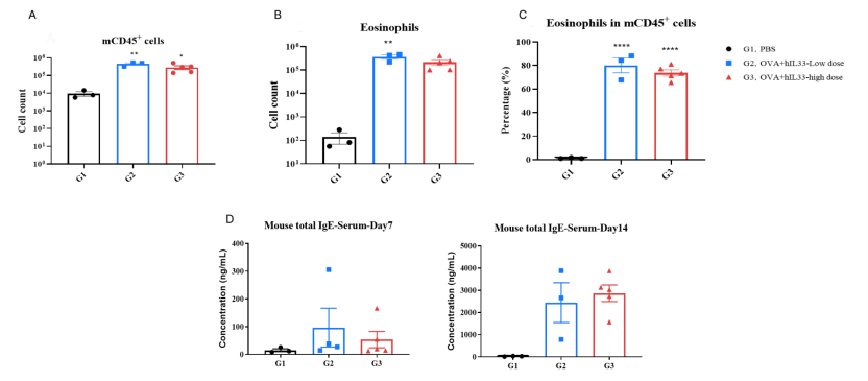
Degree of modeling in different dosage group. In C57BL/6N mice, the PBS control group (G1) showed no significant abnormalities under the microscope. Compared to the control group (G1), the three dosage groups of the papain model (G2-35ug/40uL, G3-50ug/40uL, and G4-75ug/40uL) exhibited varying degrees of vascular and peribronchial inflammatory cell infiltration, mucus in the lung bronchi, and eosinophil infiltration around the lung blood vessels and bronchi, indicating successful modeling. There was no significant difference in the degree of modeling among the three dosage groups.