
Basic Information
Description
The recombinant-activating gene 2 (Rag2) plays an important role in the rearrangement and recombination of the genes of immunoglobulin and T cell receptor molecules during the initiation of V(D)J recombination. Loss of Rag2 protein leads to no mature T and B cells, the critical components of the adaptive immune system.
Il2rg is known as the interleukin receptor common gamma chain, which is an important signaling component of many interleukin receptors, including those of interleukin -2, interleukin -4, interleukin -7 and interleukin -21. Mutations in this gene cause X-linked severe combined immunodeficiency.
This rat can be used to support research in many areas including immune system defections, virology research, inflammation research, cancer research, xenograft/transplant host etc.
-
Targeting strategy

-
Gene targeting strategy for B-SDG rats. Part of the sequences of exon 3 in rat Rag2 gene and part of the sequences of exon 2 in rat Il2rg gene were deleted in B-SDG rats. The background strain is SD rats.
-
B-SDG rats exhibit the smallest thymus size
-
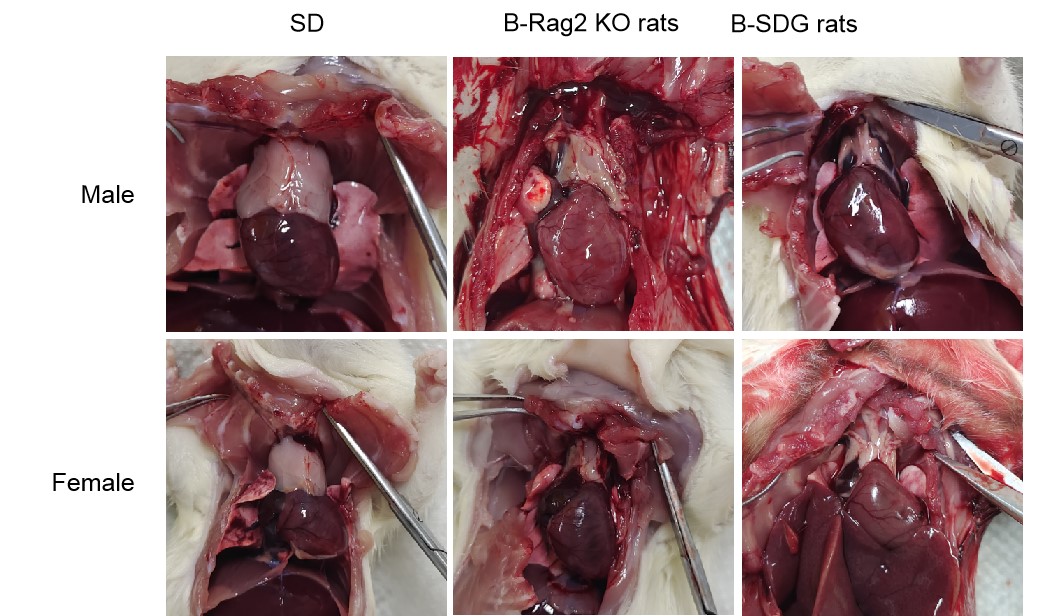
The thymus size of B-SDG rats was the smallest compared to that of wild-type SD rats and B-Rag2 KO rats. Gross anatomy of thymuses in male and female wild-type SD rats, B-Rag2 KO rats and B-SDG rats were showed (n=3, 7-week-old). Thymus size of B-Rag2 KO rats were significantly reduced compared to that of wild-type SD rats. But the thymus size of B-SDG rats were further reduced compared to B-Rag2 KO rats.
-
B-SDG rats exhibit the significantly reduced thymus and spleen weight
-
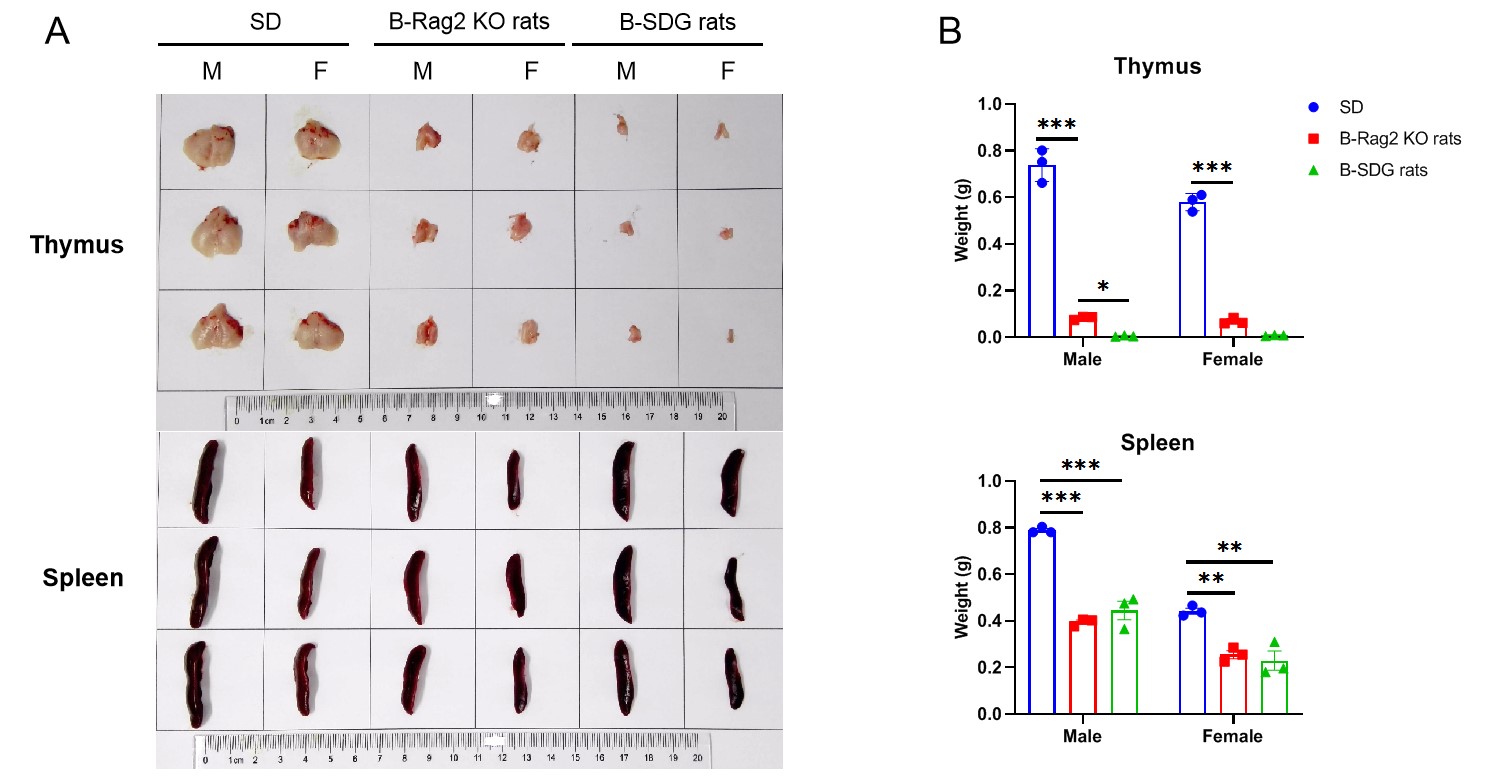
The size and weight of thymus and spleen of B-SDG rats were significantly reduced compared to that of wild-type SD rats. Thymus and spleen were isolated from male and female wild-type SD rats, B-Rag2 KO rats and B-SDG rats and weighed (n=3, 7-week-old). Thymus size and weight of B-Rag2 KO rats were significantly reduced compared to that of wild-type SD rats. But the thymus size and weight of B-SDG rats were further reduced compared to B-Rag2 KO rats. Spleen size and weight of B-Rag2 KO rats and B-SDG rats were significantly reduced compared to that of wild-type SD rats.
-
Analysis of leukocyte subpopulation in thymus
-
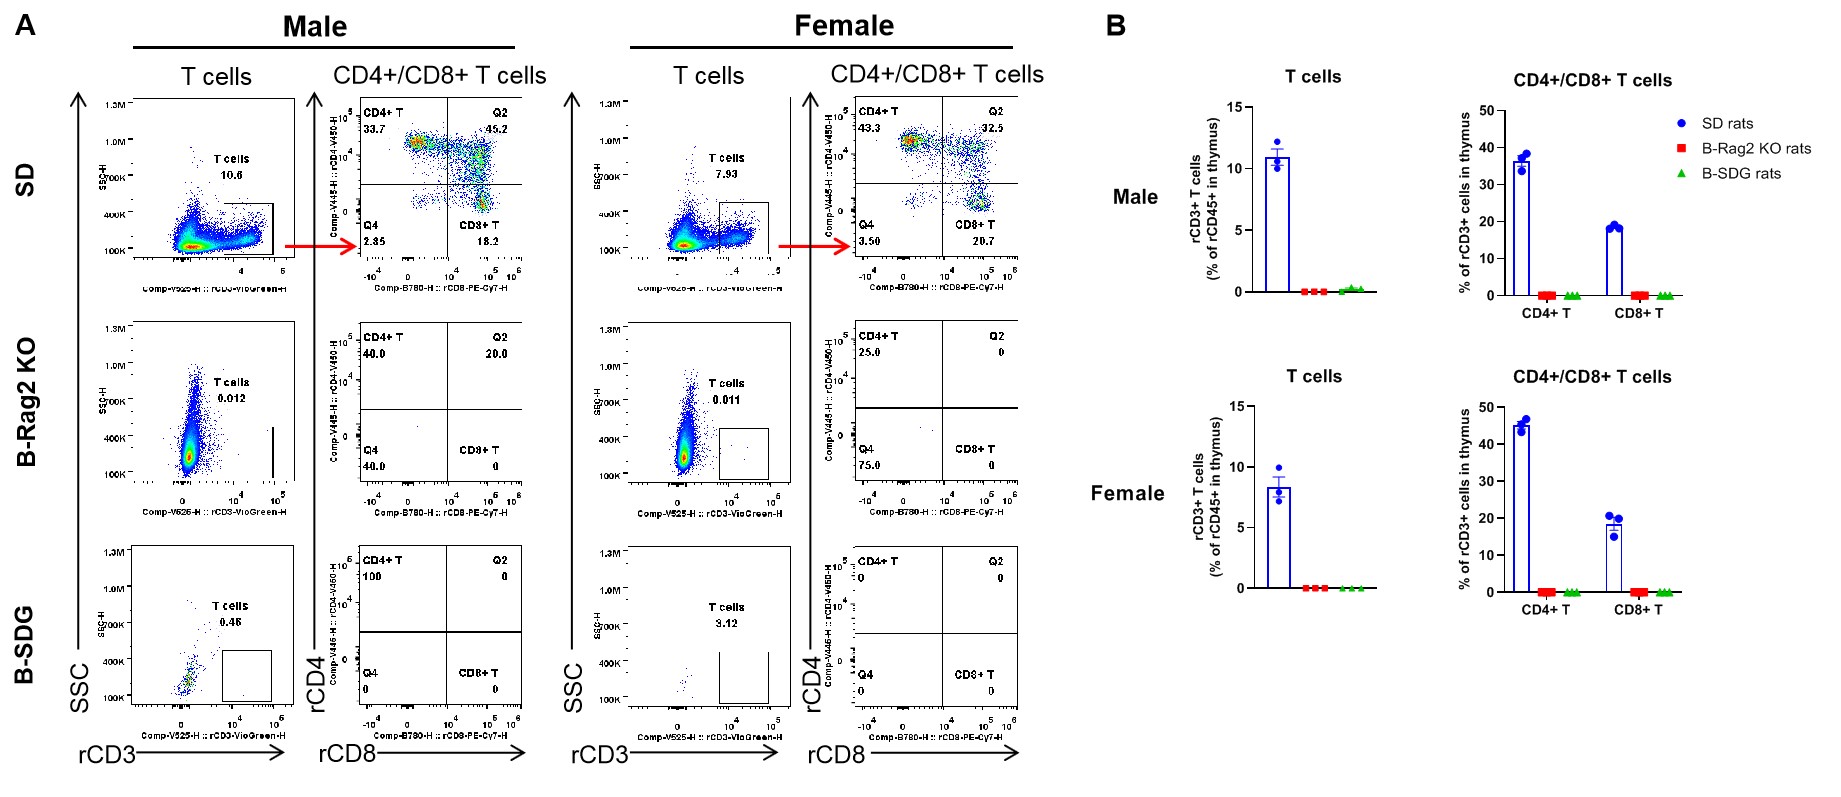
Complete loss of T cells in thymus of homozygous B-Rag2 KO rats and B-SDG rats. Thymuses were collected from male and female wild-type SD rats, B-Rag2 KO rats and B-SDG rats (n=3, 7-week-old). Leukocyte subpopulations were analyzed by flow cytometry analysis. A. Representative FACS plots. B. Statistical analysis of FACS. Results showed that total T cells, CD4+ T cells and CD8+ T cells were only detectable in thymuses of wild-type SD rats. But none of the T cells were detectable in thymuses of B-Rag2 KO rats or B-SDG rats. Values are expressed as mean ± SEM.
-
Analysis of leukocyte subpopulation in spleen of male rats
-
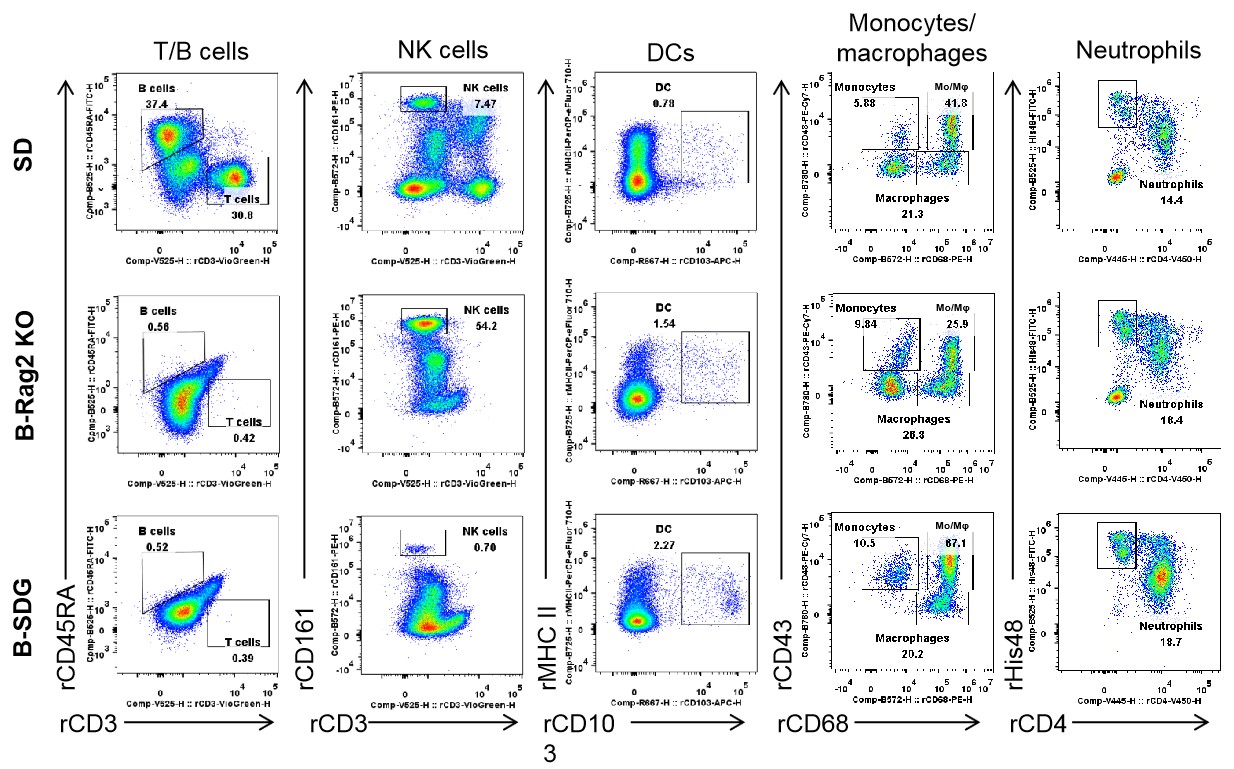
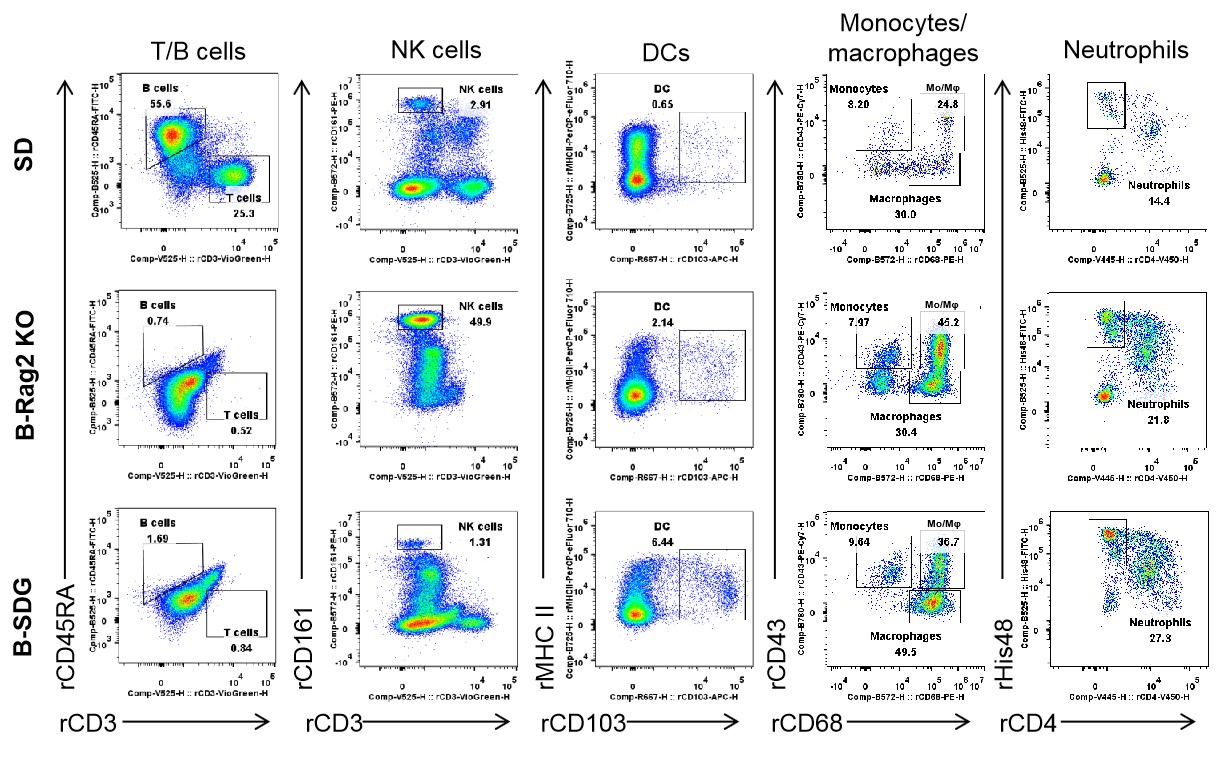
Complete loss of T cells, B cells and NK cells in spleen of homozygous male B-SDG rats. Spleens were collected from male wild-type SD rats, B-Rag2 KO rats and B-SDG rats (n=3, 7-week-old). Leukocyte subpopulations were analyzed by flow cytometry analysis. Results showed that T cells and B cells were not detectable in spleen of B-Rag2 KO rats and B-SDG rats. NK cells were also not detectable in B-SDG rats. But the percentage of NK cells in B-Rag2 KO rats were relatively higher than that in wild-type SD rats. The percentages of DCs, CD11b+CD43+ monocytes, CD11b+CD68+ macrophages, CD11b+CD43+CD68+ monocytes/macrophages (Mo/Mφ) and neutrophils in B-Rag2 KO rats and B-SDG rats were relatively higher than that in wild-type SD rats. Values are expressed as mean ± SEM.
-
Analysis of leukocyte subpopulation in spleen of female rats
-
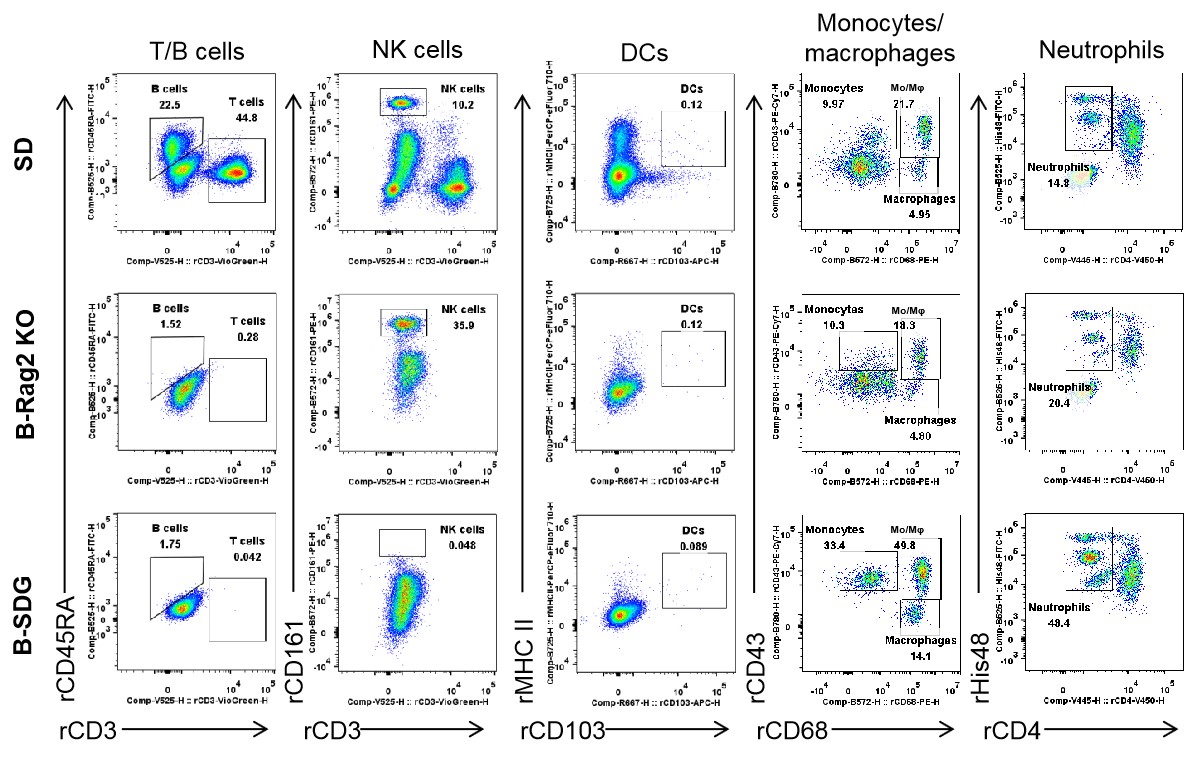
Complete loss of T cells, B cells and NK cells in spleen of homozygous female B-SDG rats. Spleens were collected from female wild-type SD rats, B-Rag2 KO rats and B-SDG rats (n=3, 7-week-old). Leukocyte subpopulations were analyzed by flow cytometry analysis. Results showed that T cells and B cells were not detectable in spleen of B-Rag2 KO rats and B-SDG rats. NK cells were also not detectable in B-SDG rats. But the percentage of NK cells in B-Rag2 KO rats were relatively higher than that in wild-type SD rats. The percentages of DCs, CD11b+CD43+ monocytes, CD11b+CD68+ macrophages, CD11b+CD43+CD68+ monocytes/macrophages (Mo/Mφ) and neutrophils in B-Rag2 KO rats and B-SDG rats were relatively higher than that in wild-type SD rats. Values are expressed as mean ± SEM.
-
Analysis of leukocyte subpopulation in spleen
-
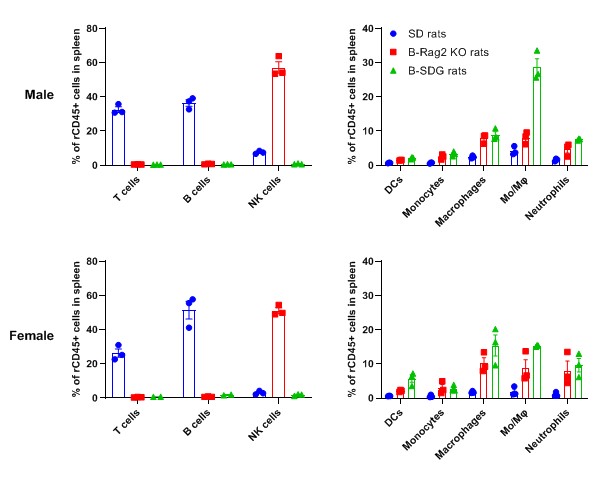
Complete loss of T cells, B cells and NK cells in spleen of homozygous male and female B-SDG rats. Spleens were collected from male and female wild-type SD rats, B-Rag2 KO rats and B-SDG rats (n=3, 7-week-old). Leukocyte subpopulations were analyzed by flow cytometry analysis. Results showed that T cells and B cells were not detectable in spleen of B-Rag2 KO rats and B-SDG rats. NK cells were also not detectable in B-SDG rats. But the percentage of NK cells in B-Rag2 KO rats were relatively higher than that in wild-type SD rats. The percentages of DCs, CD11b+CD43+ monocytes, CD11b+CD68+ macrophages, CD11b+CD43+CD68+ monocytes/macrophages (Mo/Mφ) and neutrophils in B-Rag2 KO rats and B-SDG rats were relatively higher than that in wild-type SD rats. Values are expressed as mean ± SEM.
-
Analysis of leukocyte subpopulation in blood of male rats
-
Complete loss of T cells, B cells and NK cells in blood of homozygous male B-SDG rats. Blood cells were collected from male wild-type SD rats, B-Rag2 KO rats and B-SDG rats (n=3, 7-week-old). Leukocyte subpopulations were analyzed by flow cytometry analysis. Results showed that T cells and B cells were not detectable in blood of B-Rag2 KO rats and B-SDG rats. NK cells were also not detectable in B-SDG rats. But the percentage of NK cells in B-Rag2 KO rats were relatively higher than that in wild-type SD rats. The percentages of DCs, CD11b+CD43+ monocytes, CD11b+CD68+ macrophages, CD11b+CD43+CD68+ monocytes/macrophages (Mo/Mφ) and neutrophils in B-Rag2 KO rats and B-SDG rats were relatively higher than that in wild-type SD rats. Values are expressed as mean ± SEM.
-
Analysis of leukocyte subpopulation in blood of female rats
-
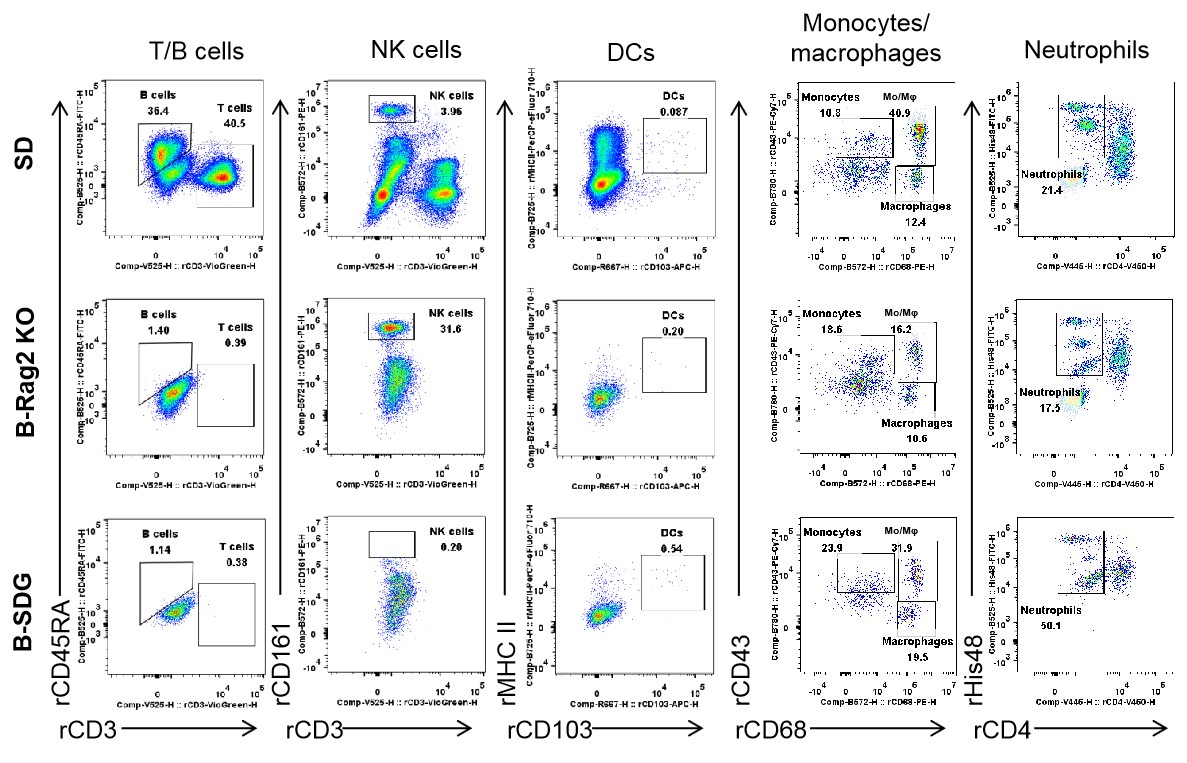
Complete loss of T cells, B cells and NK cells in blood of homozygous female B-SDG rats. Blood cells were collected from female wild-type SD rats, B-Rag2 KO rats and B-SDG rats (n=3, 7-week-old). Leukocyte subpopulations were analyzed by flow cytometry analysis. Results showed that T cells and B cells were not detectable in blood of B-Rag2 KO rats and B-SDG rats. NK cells were also not detectable in B-SDG rats. But the percentage of NK cells in B-Rag2 KO rats were relatively higher than that in wild-type SD rats. The percentages of DCs, CD11b+CD43+ monocytes, CD11b+CD68+ macrophages, CD11b+CD43+CD68+ monocytes/macrophages (Mo/Mφ) and neutrophils in B-Rag2 KO rats and B-SDG rats were relatively higher than that in wild-type SD rats. Values are expressed as mean ± SEM.
-
Analysis of leukocyte subpopulation in blood
-
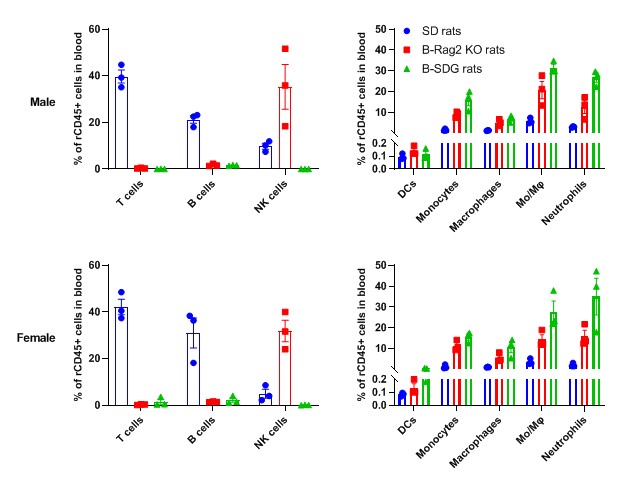
Complete loss of T cells, B cells and NK cells in blood of homozygous male and female B-SDG rats. Blood cells were collected from male and female wild-type SD rats, B-Rag2 KO rats and B-SDG rats (n=3, 7-week-old). Leukocyte subpopulations were analyzed by flow cytometry analysis. A. Representative FACS plots. B. Statistical analysis of FACS. Results showed that T cells and B cells were not detectable in blood of B-Rag2 KO rats and B-SDG rats. NK cells were also not detectable in B-SDG rats. But the percentage of NK cells in B-Rag2 KO rats were relatively higher than that in wild-type SD rats. The percentages of DCs, CD11b+CD43+ monocytes, CD11b+CD68+ macrophages, CD11b+CD43+CD68+ monocytes/macrophages (Mo/Mφ) and neutrophils in B-Rag2 KO rats and B-SDG rats were relatively higher than that in wild-type SD rats. Values are expressed as mean ± SEM.
-
MV-4-11 human leukemia xenograft model in B-SDG rats and B-Rag2 KO rats
-
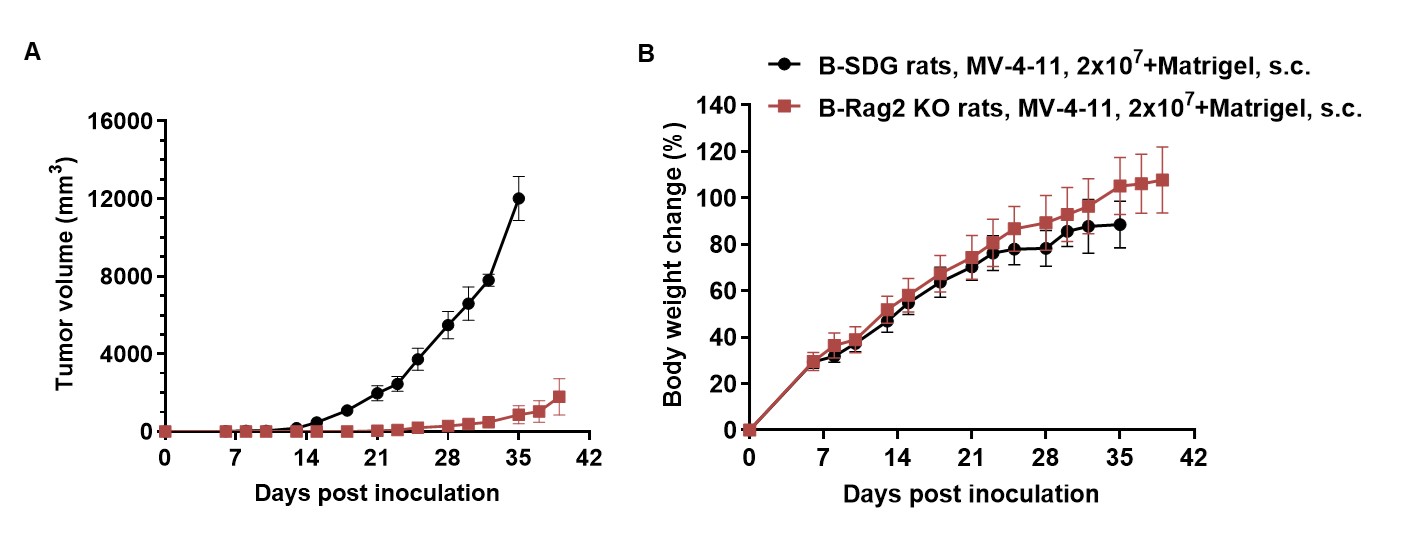
Subcutaneous homograft tumor growth of MV-4-11 cells in B-SDG rats and B-Rag2 KO rats. Human biphenotypic B myelomonocytic leukemia cell line MV-4-11 (2×10⁷) were mixed with Matrigel and inoculated subcutaneously into B-SDG rats and B-Rag2 KO rats (n=5). (A)Tumor volume. (B) Body weight change. As shown in panel A, MV-4-11 cells were able to establish tumors in B-SDG rats and B-Rag2 KO rats. B-SDG rats can be used for efficacy studies.
-
HCC1954 human breast cancer xenograft model in B-SDG rats and B-Rag2 KO rats
-
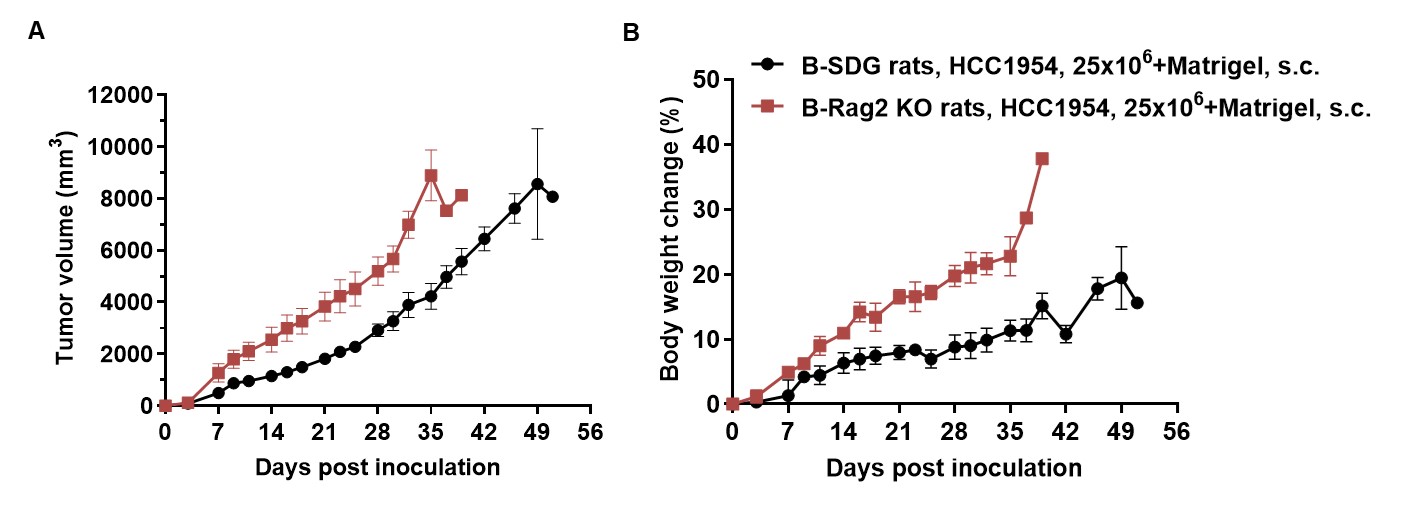
Subcutaneous homograft tumor growth of HCC1954 cells in B-SDG rats and B-Rag2 KO rats. Human breast cancer cell line HCC1954 (25×106) were mixed with Matrigel and inoculated subcutaneously into B-SDG rats and B-Rag2 KO rats (n=5). (A)Tumor volume. (B) Body weight change. As shown in panel A, HCC1954 cells were able to establish tumors in B-SDG rats and B-Rag2 KO rats, and the two strains of rats can be used for efficacy studies.
-
NCI-H460 human large cell lung cancer xenograft model in B-SDG rats
-
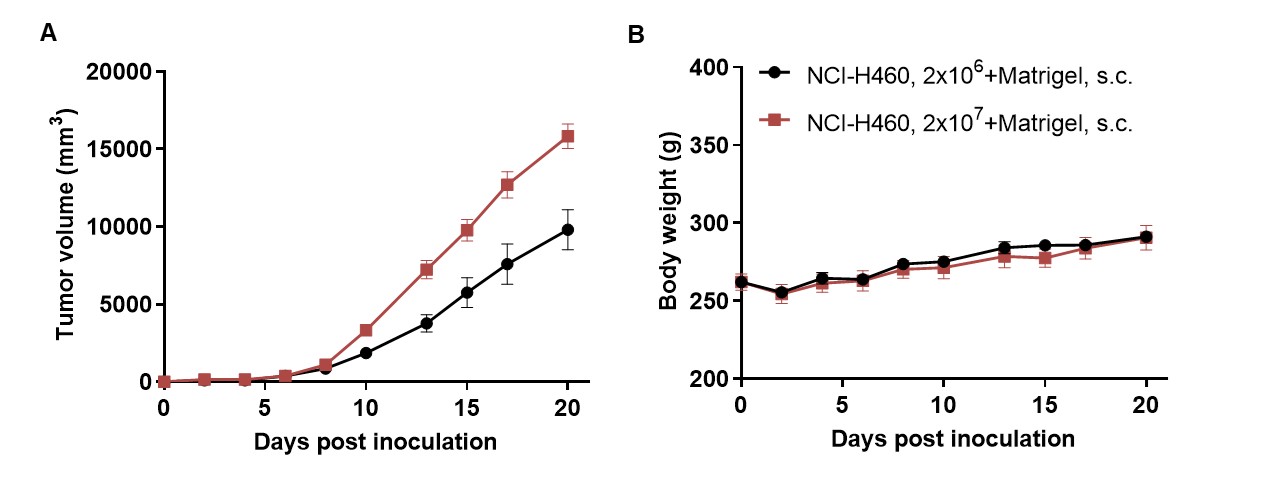
Subcutaneous homograft tumor growth of NCI-H460 cells in B-SDG rats. Human large cell lung cancer cell line NCI-H460 were mixed with Matrigel and inoculated subcutaneously into B-SDG rats (n=6). (A)Tumor volume. (B) Body weight change. As shown in panel A, NCI-H460 cells were able to establish tumors in B-SDG rats, and this strain of rat can be used for efficacy studies.
-
MIA PaCa-2 human pancreas cancer xenograft model in B-SDG rats
-
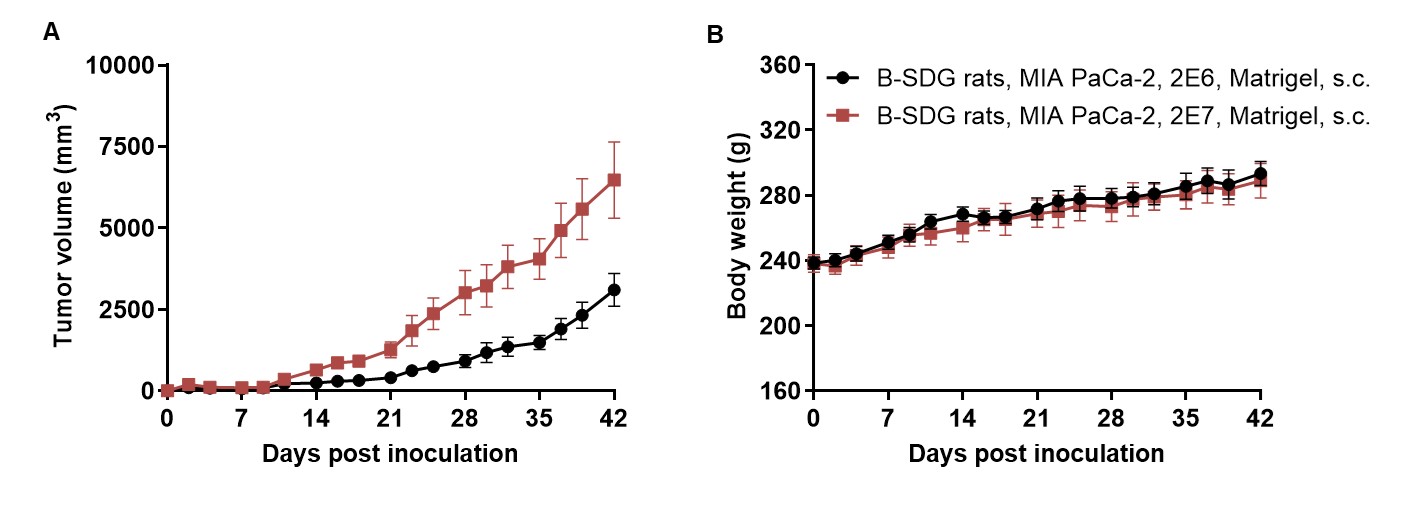
Subcutaneous homograft tumor growth of MIA PaCa-2 cells in B-SDG rats. Human pancreas cancer cell line MIA PaCa-2 (2×10⁷) were mixed with Matrigel and inoculated subcutaneously into B-SDG rats (n=6). (A)Tumor volume. (B) Body weight. As shown in panel A, MIA PaCa-2 cells were able to establish tumors in B-SDG rats and B-Rag2 KO rats, and the two strains of rats can be used for efficacy studies.
-
In vivo efficacy of cisplatin evaluated with B-SDG rats
-
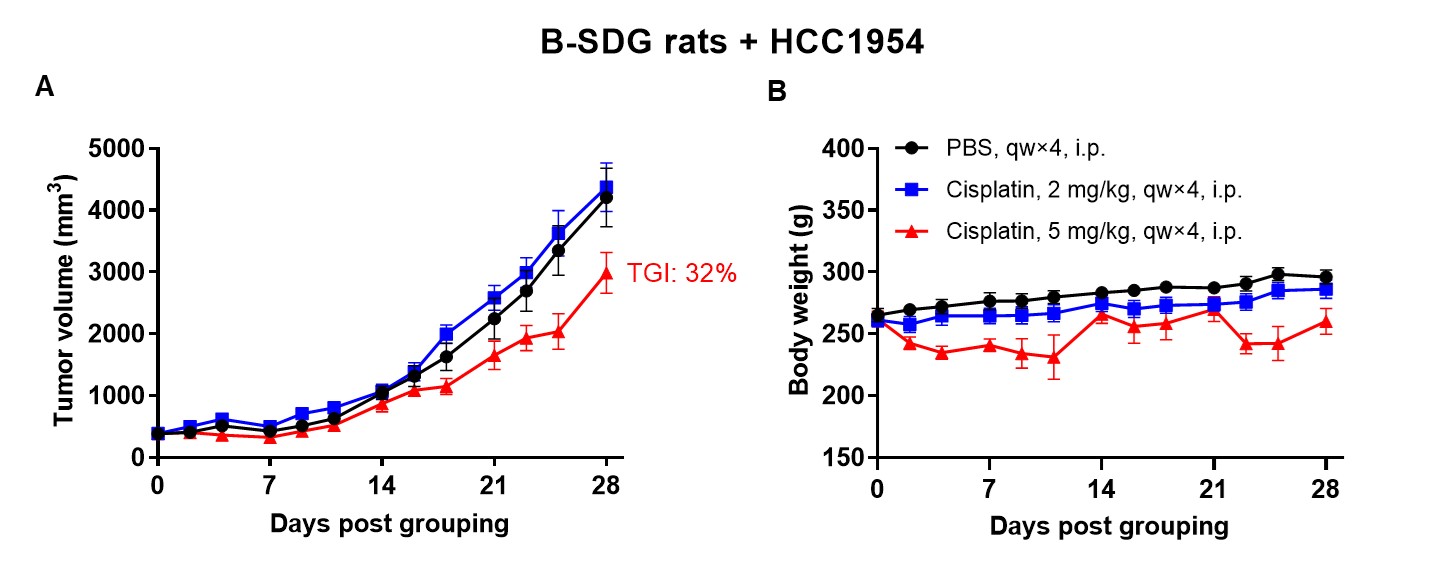
Antitumor activity of cisplatin in B-SDG rats. (A) Cisplatin inhibited HCC1954 tumor growth in B-SDG rats. Human breast invasive ductal carcinoma cell line HCC1954 (2E7) were subcutaneously implanted into B-SDG rats (female, 9-week-old, n=6). The rats were grouped when tumor volume reached approximately 300-400 mm3, at which time they were treated with cisplatin with doses indicated in panel. (B) Body weight changes during treatment. As shown in panel A, cisplatin was efficacious in controlling tumor growth in B-SDG rats, demonstrating that B-SDG rats provide a powerful preclinical model for in vivo evaluation of chemotherapies. Values are expressed as mean ± SEM.
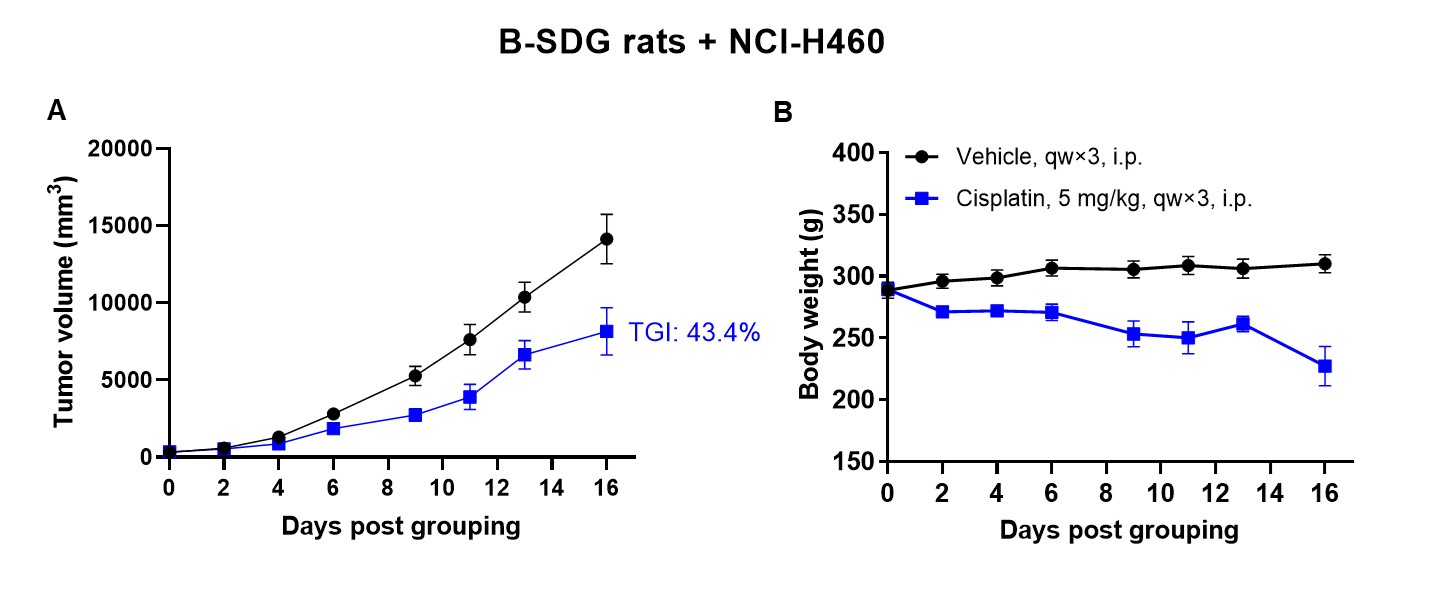
Antitumor activity of cisplatin in B-SDG rats. (A) Cisplatin inhibited NCI-H460 tumor growth in B-SDG rats. Human large cell lung cancer cell line NCI-H460 (2E6) were subcutaneously implanted into B-SDG rats (female, 9-week-old, n=6). The rats were grouped when tumor volume reached approximately 300-400 mm3, at which time they were treated with cisplatin with the dose indicated in panel. (B) Body weight changes during treatment. As shown in panel A, cisplatin was efficacious in controlling tumor growth in B-SDG rats, demonstrating that B-SDG rats provide a powerful preclinical model for in vivo evaluation of chemotherapies. Values are expressed as mean ± SEM.
-
In vivo efficacy of Her2-targeting ADC drug evaluated with B-SDG rats
-
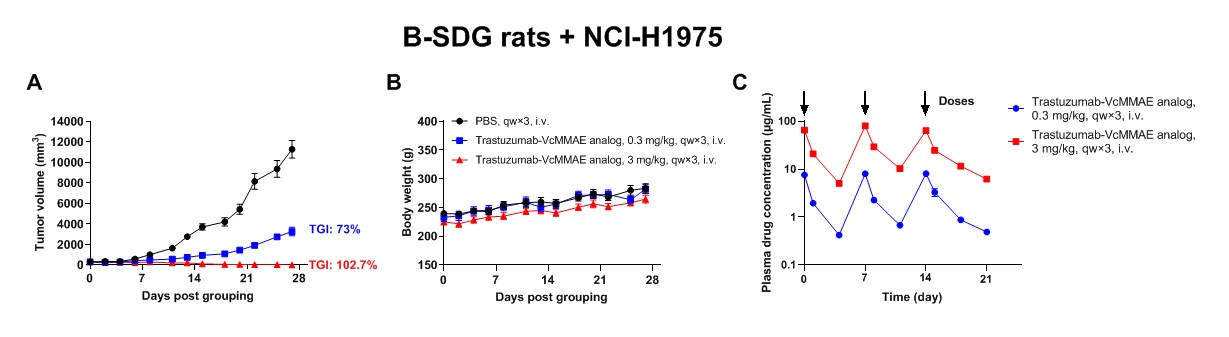
Antitumor activity of Her2-targeting ADC drug in B-SDG rats. Human non-small cell lung cancer cell line NCI-H1975 (5×10⁶) were subcutaneously implanted into B-SDG rats (female, 8-week-old, n=6). The rats were grouped when tumor volume reached approximately 300-400 mm3, at which time they were treated with trastuzumab-VcMMAE analog (in house). Blood was collected at 15 min, 24 hr and 96 hr after the first two doses from every mouse. After the third dose, the time points of blood collection were 15 min, 24 hr, 96 hr and 168 hr. (A) Trastuzumab-VcMMAE analog (in house) inhibited the growth of NCI-H1975 in B-SDG rats. (B) Body weight changes during treatment. (C) Time course of drug concentration in blood. Results showed that Her2-targeting ADC drug was efficacious in controlling tumor growth in B-SDG rats in a dose-dependent manner. The drug concentration was maintained at a steady high level in the high dosing group. There is a significant correlation between the efficacy and drug concentration. Therefore, B-SDG rats provide a powerful preclinical model for in vivo efficacy evaluation and pharmacokinetics study of ADC drugs. Values are expressed as mean ± SEM.
